It’s never good when your boss calls at 5 pm on a Friday. “The weekly analytics didn’t build correctly. What happened? Call me every hour with updates until you figure it out!”
For many data professionals, this situation is all too familiar. Analytics, in the modern enterprise, span toolchains, teams, and data centers. Large enterprises ingest data from dozens or hundreds of internal and external data sources. An error could occur in any of the millions of steps in the data pipeline.
DataOps uses automation to create unprecedented visibility into data operations. Every operation, every step, and every transaction in the data pipeline is tested and verified. Warnings and failures appear in logs and reports that can help the data team pinpoint problems with laser-like accuracy. Below we’ll show an actual report used by a DataOps enterprise. It enables all of the stakeholders to view the real-time status of analytics build operations. It helps people keep their “finger on the pulse” of what is happening, so stakeholders started calling it the “Pulse Report.”
The Pulse Report
The Pulse Report is a set of workflows and reports that provide detailed, up-to-the-minute build status. Imagine that data are collected from data sources over SFTP, email, and S3-to-S3 transfer and deposited in an S3 repository. Any one of these sources could have a problem. A report called “Upcoming Data Sources” shows the arrival status of each data source.
If critical data is present, the automated orchestration executes the builds. A report titled “Daily Build Summary” presents the status of analytics builds that instantiate data and analytics for users, such as, for example, data mart schemas employed by users for self-service analytics. The “Current Data Sources” report enables users to see the timestamp (or other recency information) of data sources to understand analytics better. The reports mentioned are further explained below.
Upcoming Data Sources Report
The Upcoming Data Sources Report tracks all data sources received and collected for inclusion in future builds. Data files arrive on their own schedule – some hourly, some weekly, or perhaps in the middle of the night. The Upcoming Data Sources Report monitors each data source with respect to its schedule and reports its status. This report gives the data team an easy way to check whether a build is on track or at risk.
The report shows the status of each data source:
- OK – received on time
- Stale – new file expected but not yet late – the data team pays attention to these to avoid missing builds
- Late – new file not present after a specific target delivery time
- Received Late – file received after scheduled build start-time
The proactive data team doesn’t wait for a data source to be late before taking action. They monitor the data sources and follow up on those that are “stale.” With large numbers of data sources, automation can monitor status and promptly deliver stale or late alerts to the data team.
Upcoming Data Sources
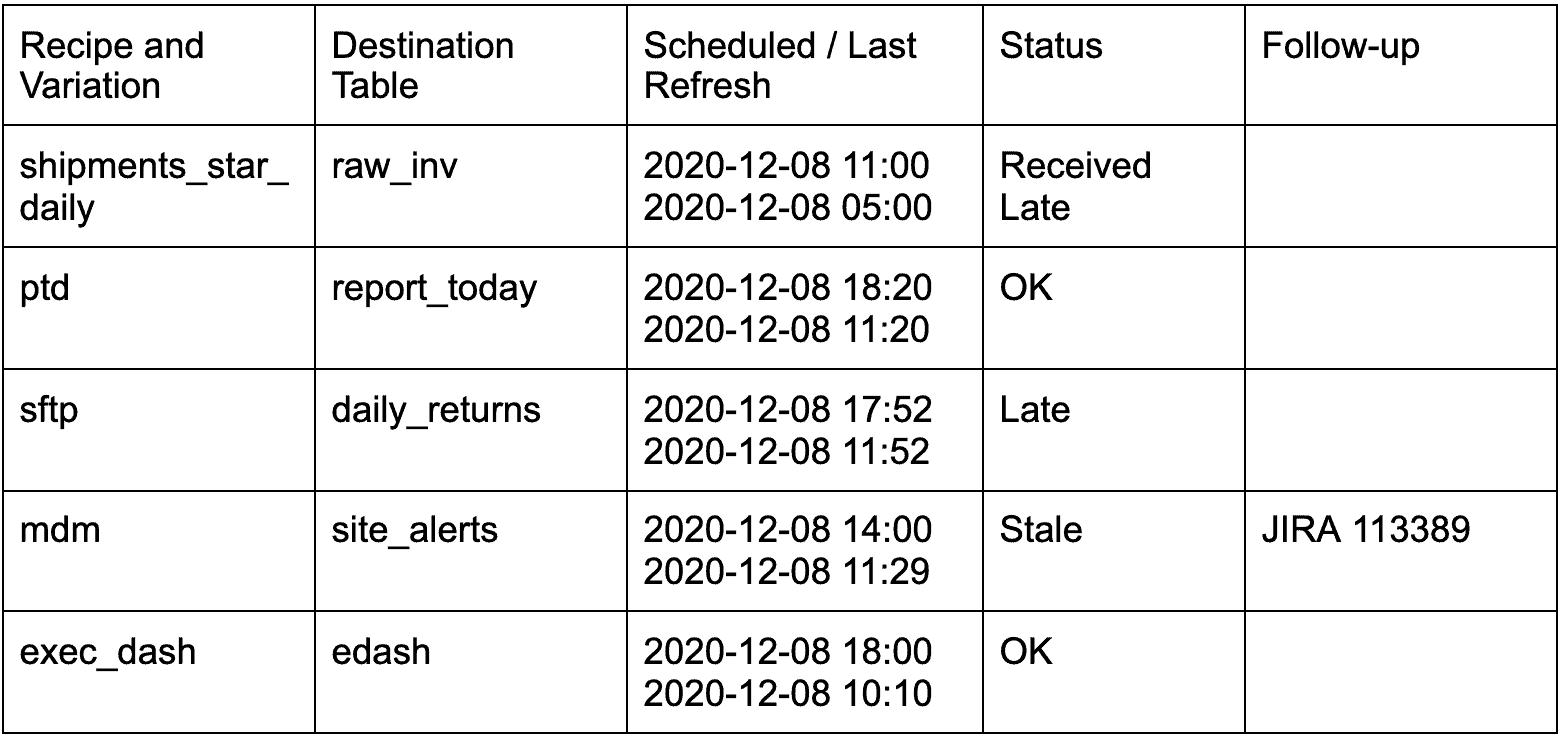
The Upcoming Data Sources Report provides the data team with status of incoming files required for pending builds.
Daily Build Summary Report
The Daily Build Summary shows the status of each daily build. Builds or “Order Runs” are automated data-flows that run as scheduled, triggered, or manual processes, called “Recipe Variations” on DataKitchen DataOps Automation. The Daily Build Summary includes the current status of builds run in the production system; specifically, production Kitchens.
When the system wants to start a build, the key question is whether it has all the component files ready to go. If a file is missing, the build orchestration script updates the Pulse Report and, if so configured, alerts the data team.
Build Types are:
- Analytic – analytic products like star schemas and data marts for end-users
- Process – smaller processes geared to a specific task or deliverable
- Source – ingestion of source data used by other builds
- Third-Party – ingestion of third-party data sources involving little additional manipulation
- Utility – processes used for data management and oversight
Each build listed shows a build status as well as the results of the prior build:
- Completed – Order Run completed with a note of “late start” if applicable
- Upcoming – Scheduled build time approaching
- Prior Build Error – Order Run failed to complete
For scheduled and triggered Order Runs, the report shows the schedule or condition which activates the build. It also shows the Order’s planned and actual start and end times, determining whether an Order started or completed late. Automated processes update the Daily Build Summary at frequent intervals throughout the day.
Some data sources are critical and must stop a build. For example, an updated production status could be in that category for certain applications. Other data sources are less important – a build can proceed without them. For example, the status of reverse logistics might not be critical in some instances. Use cases determine the criticality of each data source.
Daily Build Summary
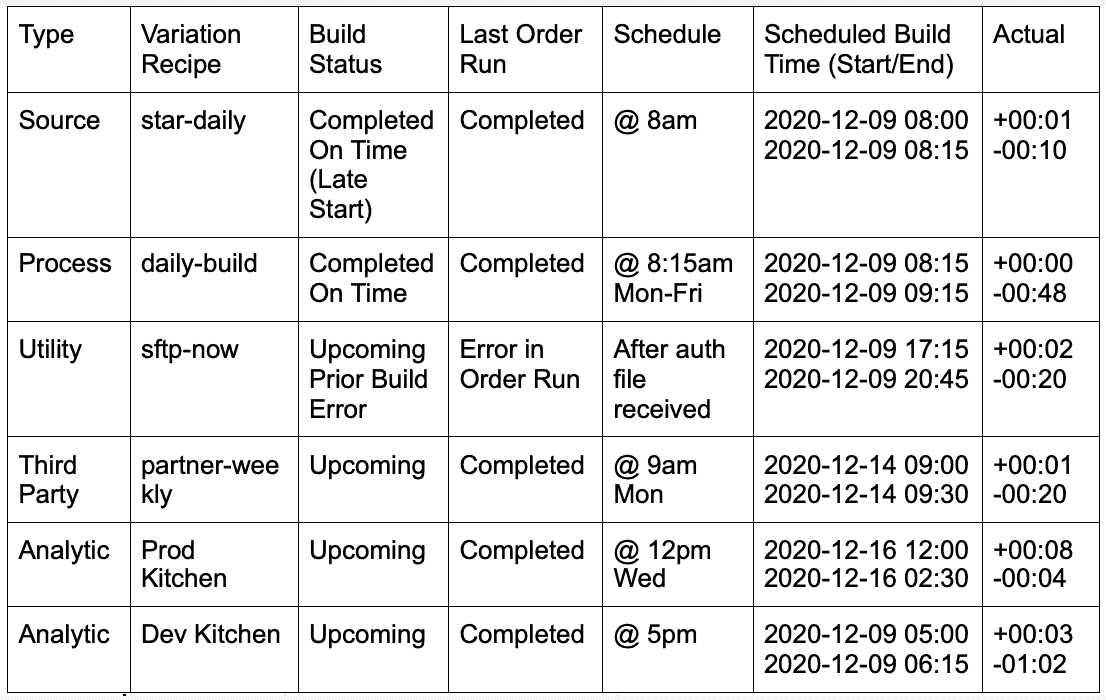
The Daily Build Summary shows the status of each daily build.
When a build is complete, a table is added to each schema indicating the refresh date for each source file. These timestamps are available to users via the “Current Data Sources” report to understand the recency or “freshness” of the analytics reports.
If a file is missing, a build did not run, or a file is late, the system can notify the data team as appropriate. For example, the automated orchestration responsible for the build can report errors by creating a JIRA ticket or sending an email or slack message.
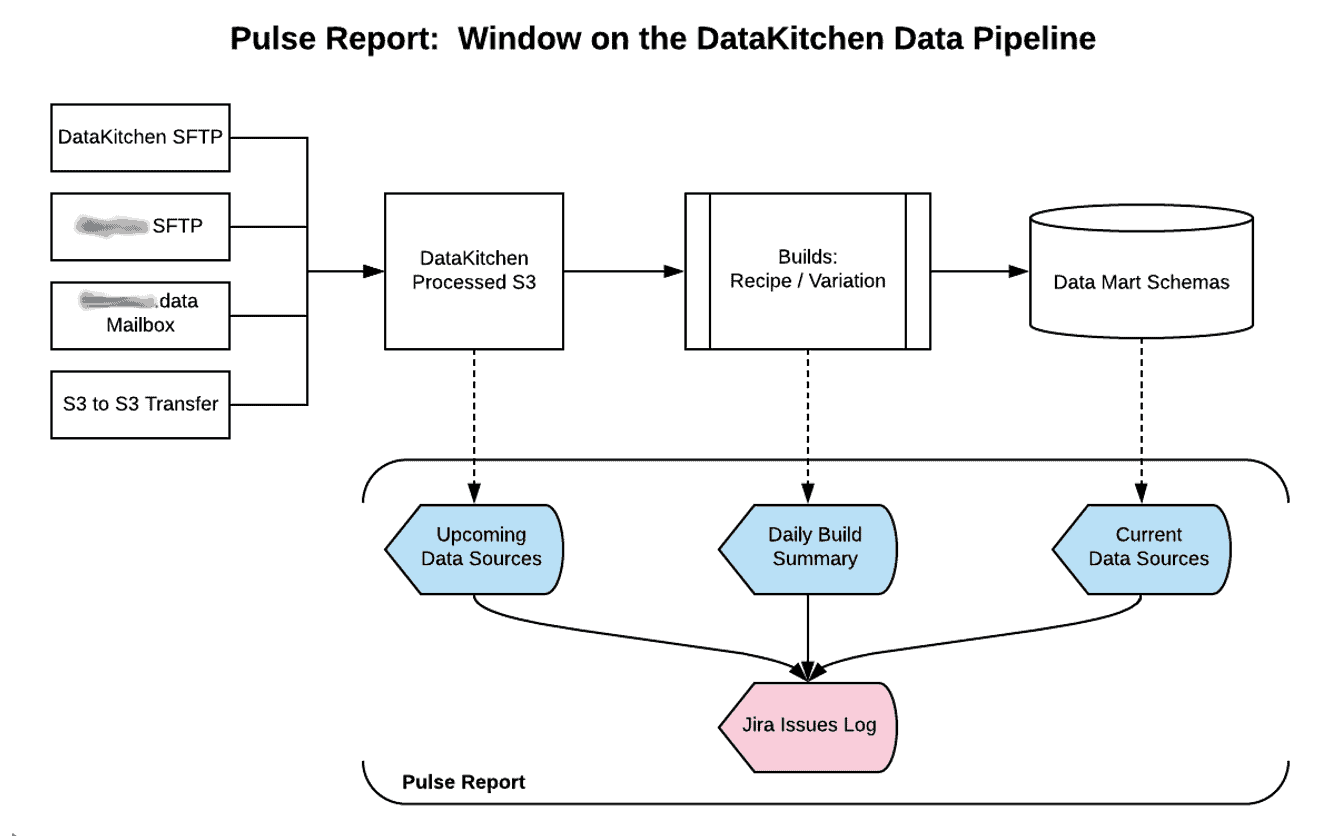
Overview of the Pulse Report and associated data.
Proactive Problem Solving with the Pulse Report
With DataOps and the Pulse Report, the data team can easily see which builds failed and which file arrivals affected the build. When a build does not run, the Pulse Report indicates whether the data set components were in place to support the build. If not, the data team would have known immediately, instead of finding out from users that something was wrong. As data set status flipped to stale, the data team might have been able to resolve an issue and keep the build on track proactively.
FAQ
What are the key points in this blog?
The Pulse Report is a set of automated workflows and reports that show up-to-the-minute build status across a data pipeline. Three reports carry it: Upcoming Data Sources grades each incoming file as OK, Stale, Late, or Received Late; Daily Build Summary shows each build as Completed, Upcoming, or Prior Build Error with planned versus actual times; and Current Data Sources shows how recent the data behind the analytics is.
What is a DataOps Pulse Report?
A DataOps Pulse Report is a set of workflows and reports that give every stakeholder the real-time status of analytics build operations — which data sources arrived, which builds ran, and when the data behind a report was last refreshed. The name came from its users, who described it as keeping a finger on the pulse of what was happening in the pipeline.
What do the Upcoming Data Sources report statuses mean?
OK means the file was received on time. Stale means a new file is expected but is not yet late. Late means no new file is present after a specific target delivery time. Received Late means the file arrived after the scheduled build start time. Each source is tracked against its own schedule, because files arrive hourly, weekly, or in the middle of the night.
What does the Daily Build Summary report show?
The status of each daily build running in production: Completed, with a note of late start where it applies, Upcoming, or Prior Build Error. It also lists the schedule or trigger condition and the planned and actual start and end times. Builds are typed as Analytic, Process, Source, Third-Party, or Utility, and automated processes refresh the summary at frequent intervals through the day.
What is an Order Run?
An Order Run is an automated data flow that runs as a scheduled, triggered, or manual process. On DataKitchen DataOps Automation an Order Run executes a Recipe Variation, the specific pipeline configuration for a particular use case, and production runs execute inside production Kitchens, the isolated workspace environments where teams build and run pipelines.
How does a data team learn that a build failed or a file is late?
From the report and from a push notification rather than from a user. When a required file is missing, the build orchestration updates the Pulse Report and, where configured, alerts the team by creating a JIRA ticket or sending an email or Slack message. DataKitchen DataOps Observability applies the same idea, with rules that fire on failed runs and late arrivals.