Catch bad data the moment it lands
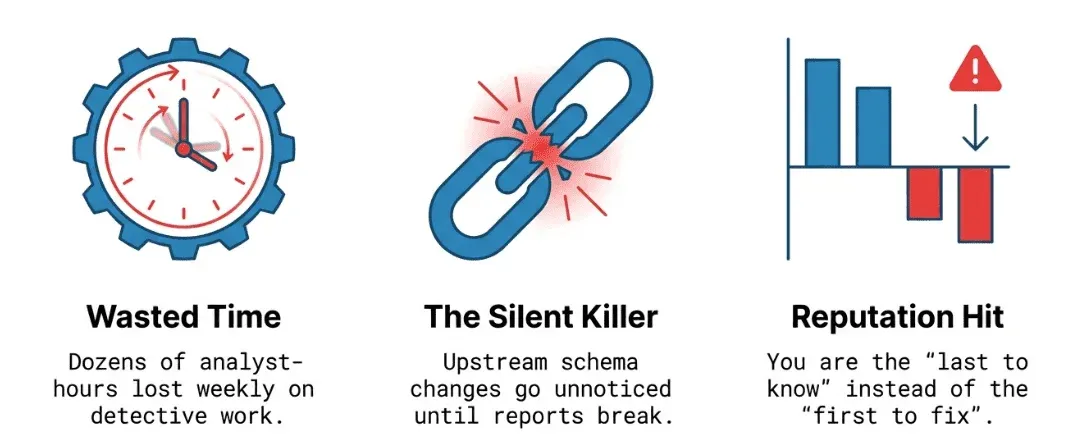
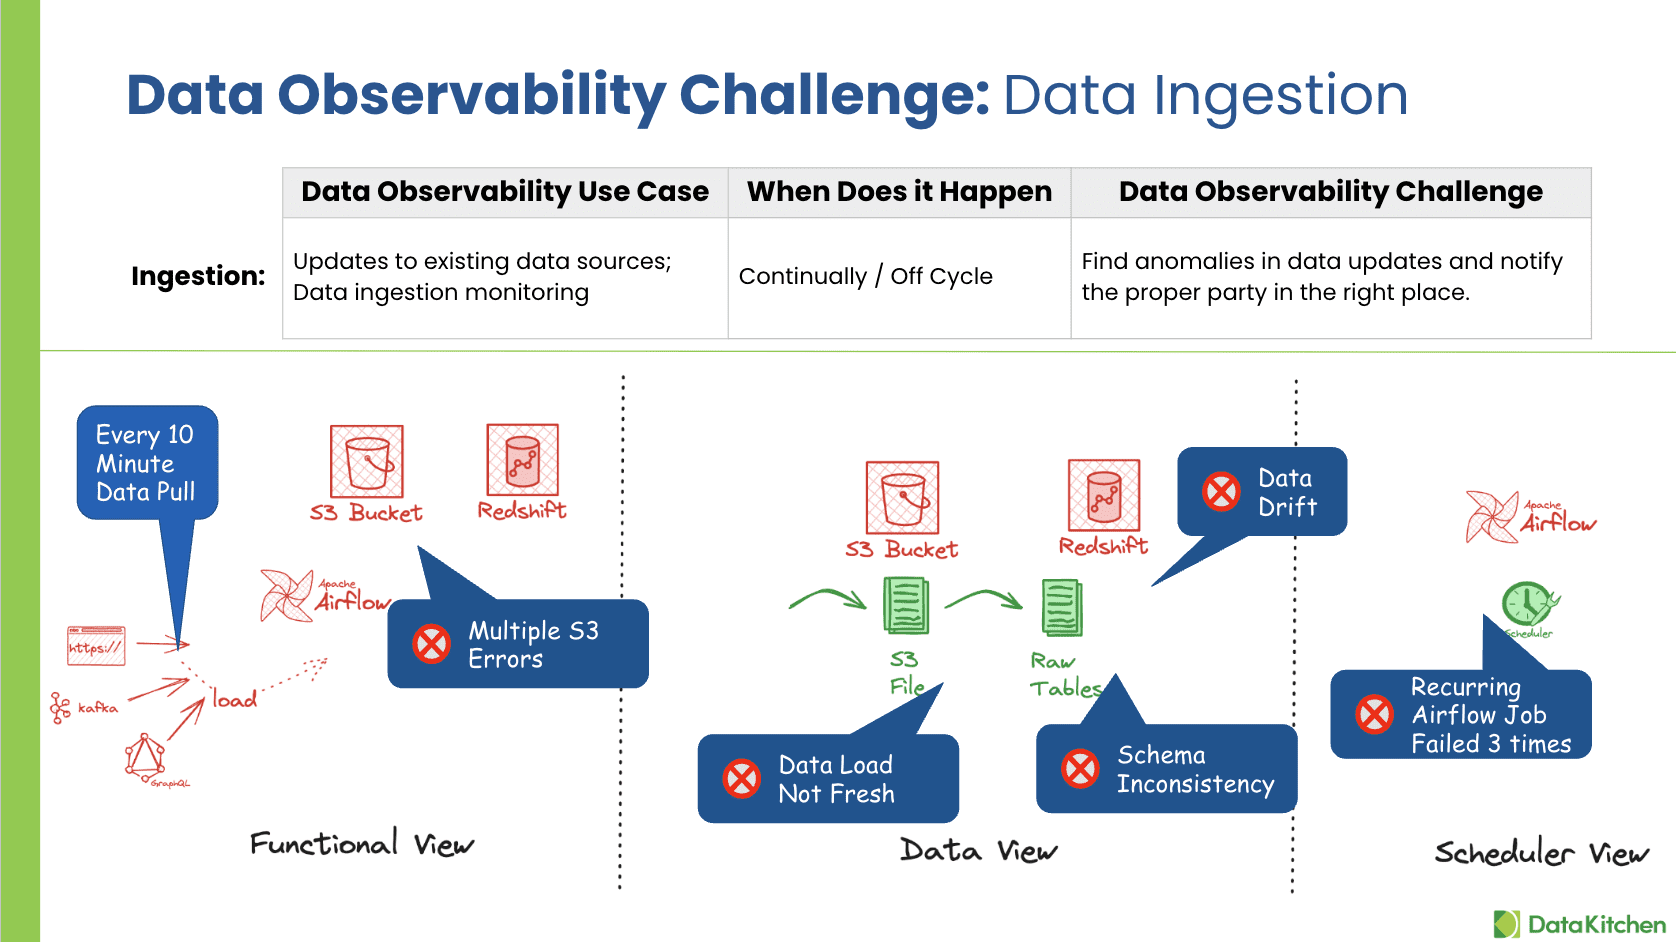
Your sources change without telling you. Schema shifts, vendors send half a file, a column that was always populated suddenly has nulls. TestGen Monitors watches every table on every refresh with ML anomaly detection. Freshness, volume, schema, and metrics. Open source. Free.
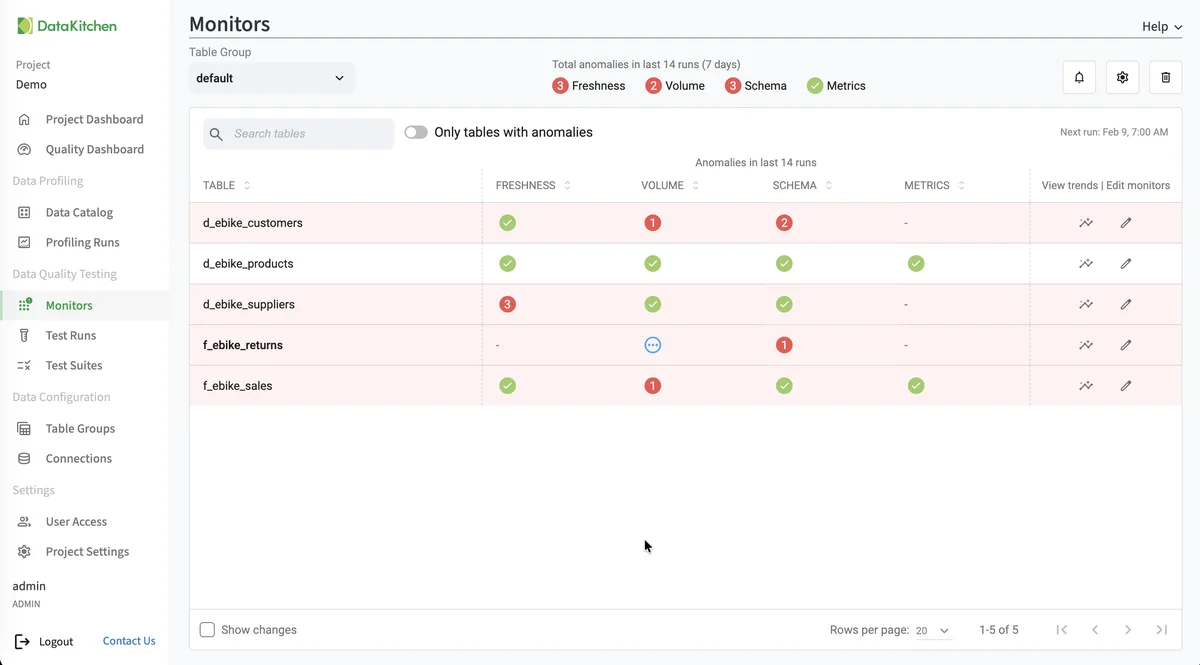
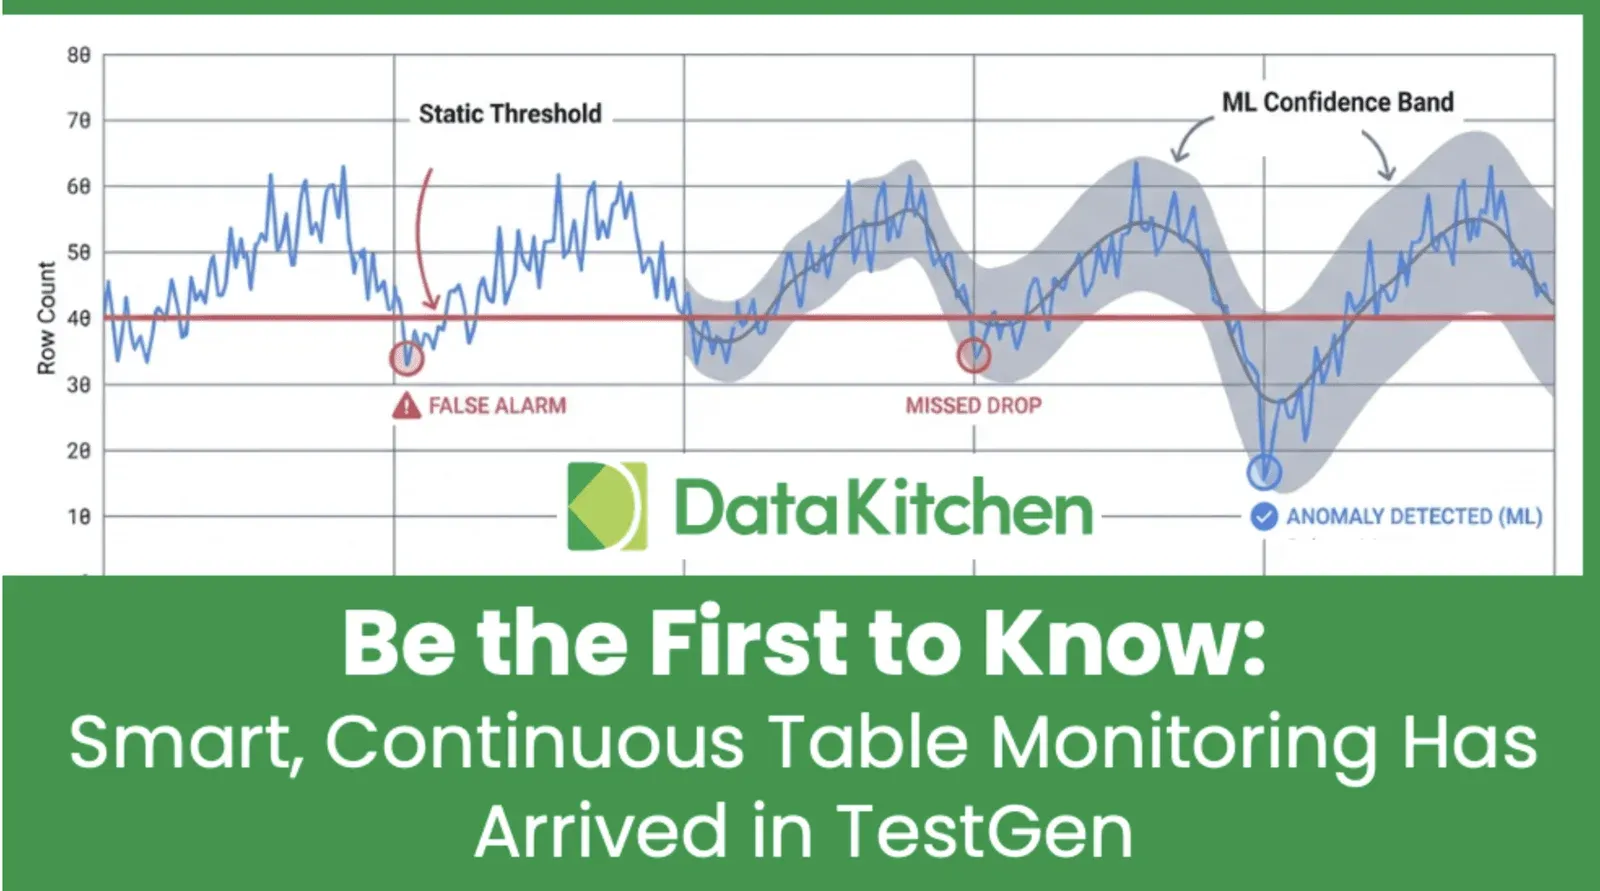
Watch every table with ML anomaly detection
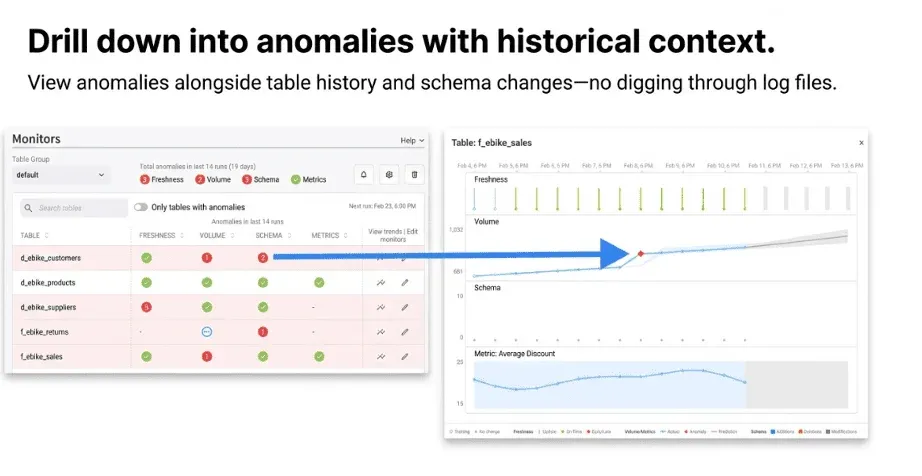
TestGen profiles every table and learns what normal looks like: row counts at this hour, value distributions for this column, the freshness pattern you've come to expect. On every refresh it compares against the baseline and flags anomalies before anyone has a chance to look at the data. The Monitors page rolls everything up by table over a 14-day window. Green means healthy. Red means somebody is going to file a ticket. The pattern is automatic. Nobody is hand-coding thresholds.
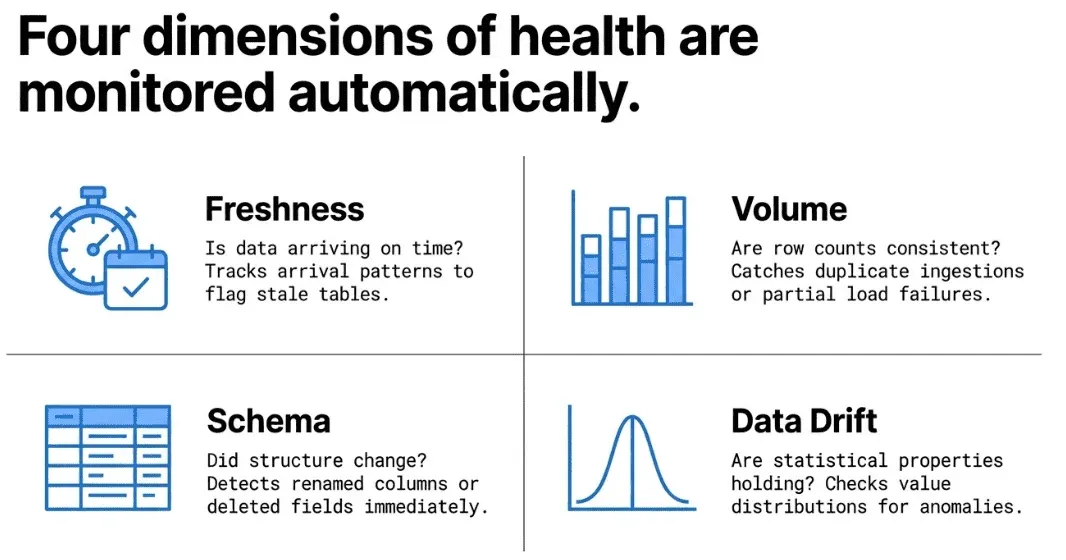
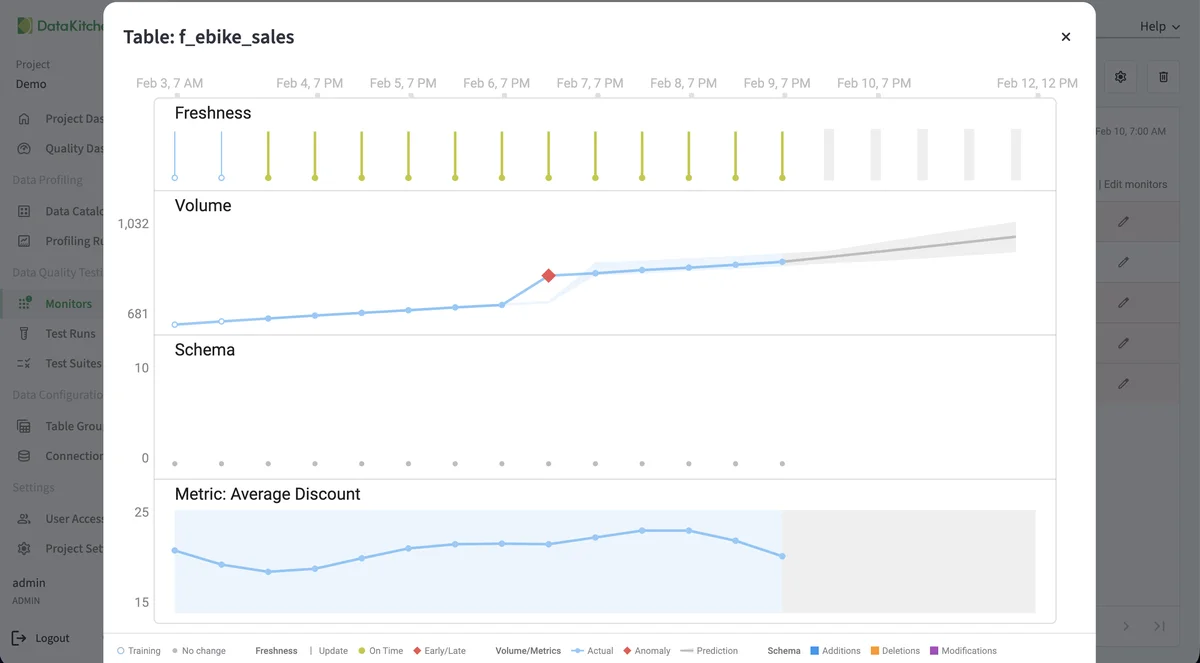
Freshness, volume, schema, and metrics out of the box
TestGen runs four baseline checks on every table. Freshness: did new data arrive on schedule? Volume: are the row counts in line with the last 14 days? Schema: did a column rename, drop, or change type? Metrics: did the average, the median, or the null rate drift outside the expected band? You don't write any of these. They're generated when TestGen profiles the table the first time, and they re-baseline as the data evolves. The four catch the most common bad-ingest scenarios: late files, partial loads, vendor-side schema changes, and silent corruption.
Build custom monitors for the metrics you actually care about
The four baseline checks cover most ingestion failures. The fifth covers the one your team actually cares about. Maybe it's the average sale price after the daily ETL. Maybe it's the count of distinct customer IDs in a CRM dump. Maybe it's whether the timestamp range covers the full business day. Write a custom monitor as a SQL expression. TestGen takes care of running it on every refresh and tracking the trend. You don't manage cron jobs or alerting infrastructure.
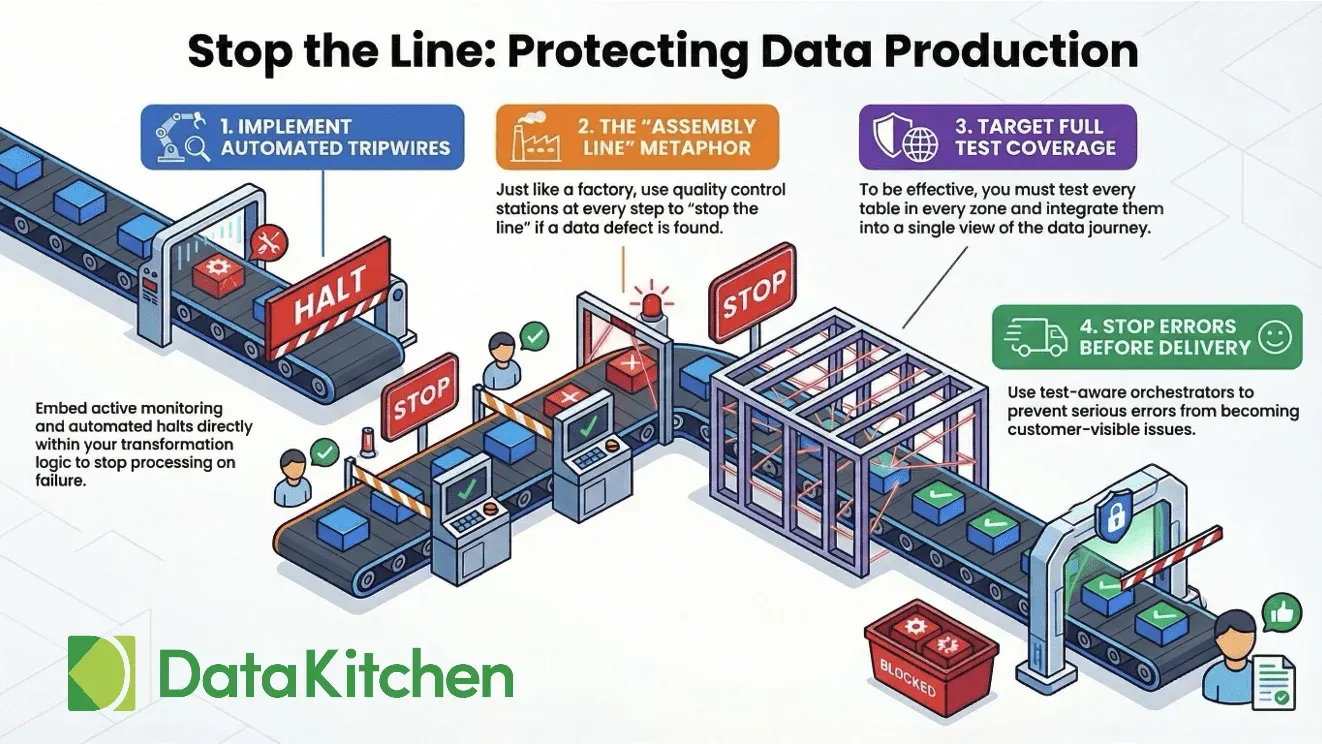
Catch errors before they become problems
Your dashboard shows the wrong number at 9am on Monday and a VP is on the phone by 9:15. The cost of finding a data error at the source is about a dollar a record. The cost when the customer finds it is a hundred. TestGen runs at ingestion, before the data flows downstream. Tag a failing test as a tripwire and the next pipeline step doesn't run until you fix it. Your downstream tables stay on the last good data. The Monday-morning ticket doesn't happen.
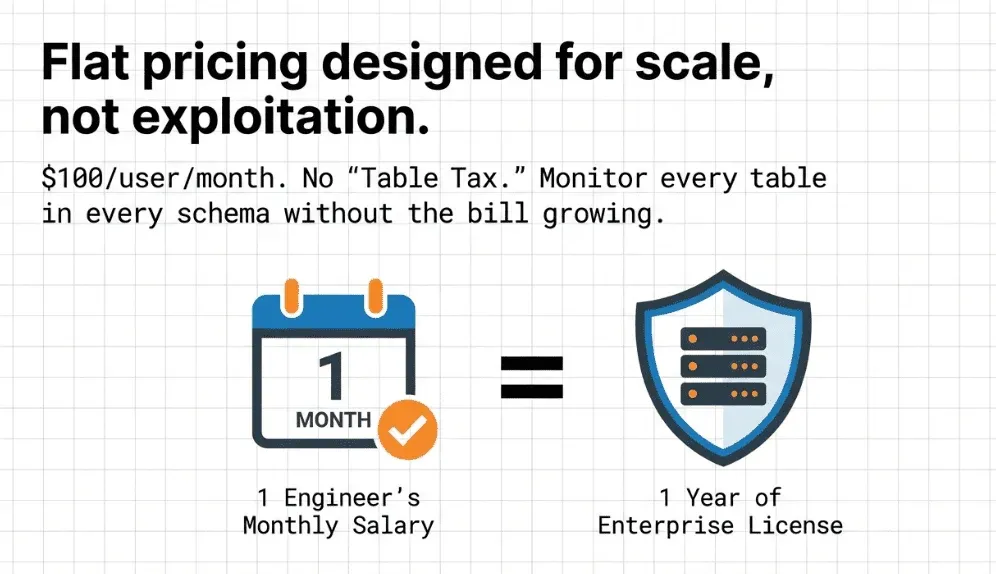
Open source. Low cost. No table tax
TestGen is open source and ships in a Docker container. Stand it up against PostgreSQL, Snowflake, Redshift, BigQuery, Databricks, Oracle, or SAP HANA in 15 minutes. No per-row pricing. No table tax. No consultant required. The Enterprise edition adds collaboration features for larger teams, but the Monitors and anomaly-detection engine that ingestion teams rely on is in the free version. The source is on GitHub.
Stand up TestGen Monitors against your sources
Profile your ingestion tables, baseline the four health dimensions, and catch the next bad refresh before anyone files a ticket. Free, no vendor lock-in.