The primary source of information about DataOps is from vendors (like DataKitchen) who sell enterprise software into the fast-growing DataOps market. There are over 70 vendors that would be happy to assist in your DataOps initiative. Here’s something you likely won’t hear from any of them (except us) – you can start your DataOps journey without buying any software.
It’s important to remember that DataOps is a culture and methodology, implemented using automated augmentation of your existing tools. You are free to select one of many best-in-class free and open source tools. When we started sharing the “Seven Steps of DataOps” a few years ago, our intent was (and still is) to evangelize DataOps as a free and open methodology.
If you are a CDO or a VP, you have the power to institute broad change, but what if you are an individual contributor? What can you do? This is a common question that we hear from our conversations with data scientists, engineers and analysts. An individual contributor has assigned duties and usually no ability to approve purchases. How can one get started given these limitations?
DataOps is not an all-or-nothing proposition. There are small but impactful things that an individual contributor can do to move forward. Hopefully, with metrics in place, you can show measured improvements in productivity and quality that will win converts. As your DataOps activities reach enterprise scale, you may indeed decide that it’s much easier to partner with a vendor than to build and support an end-to-end DataOps Platform from scratch. When that day arrives, we’ll be here, but until then, here are some suggestions for DataOps-aligned improvements you can make with open-source tools and a little self-initiative.
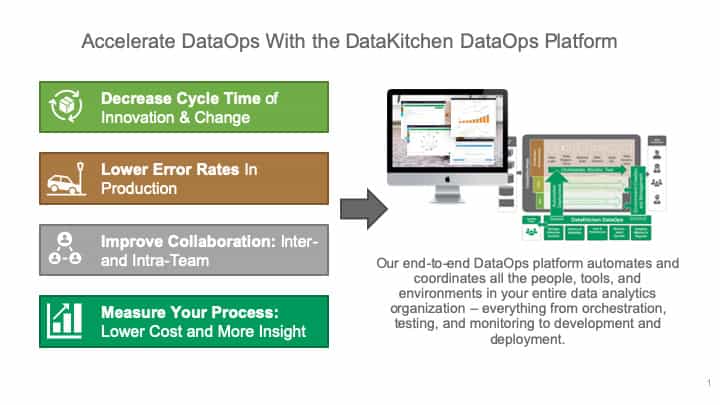
DataOps Objectives
DataOps includes four key objectives:
- Measure Your Process – As data professionals, we advocate for the benefits of data-driven decision making. Yet, many are surprisingly unanalytical about the activities relating to their own work.
- Improve Collaboration, both Inter- and Intra-team – If the individuals in your data-analytics team don’t work together, it can impact analytics-cycle time, data quality, governance, security and more. Perhaps more importantly, it’s fun to work on a high-achieving team.
- Lower Error Rates in Development and Operations – Finding your errors is the first step to eliminating them.
- Decrease the Cycle Time of Change – Reduce the time that elapses from the conceptualization of a new idea or question to the delivery of robust analytics.
We view the steps in analytics creation and data operations as a manufacturing process. Like any complex, procedure-based workflow, the data-analytics pipeline has bottlenecks. We subscribe to the Theory of Constraints, which advises to find and mitigate your bottlenecks to increase the throughput of your overall system.
If that’s too abstract, we’ll suggest four projects, one in each of the areas above, that will start the ball rolling on your DataOps initiative. These tasks illustrate how an individual contributor can start to implement DataOps on their own.
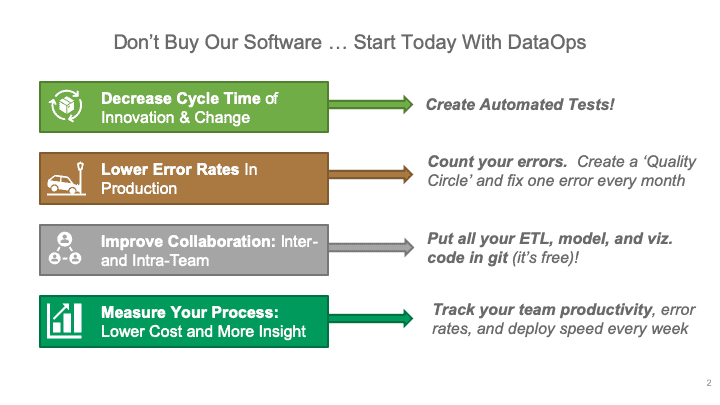 Figure 1: 4 simple projects to get started with DataOps.
Measure Your Process
Internal analytics could help you pinpoint areas of concern or provide a big-picture assessment of the state of the analytics team. A burn-down chart, velocity chart, or tornado report can help your team understand its bottlenecks. A data arrival report enables you to track data suppliers and quickly spot delivery issues. Test Coverage and Inventory Reports show the degree of test coverage of the data analytics pipeline. Statistical process controls allow the data analytics team to monitor streaming data and the end-to-end pipeline, ensuring that everything is operating as expected. A Net Promoter Score is a customer satisfaction metric that gauges a team’s effectiveness.
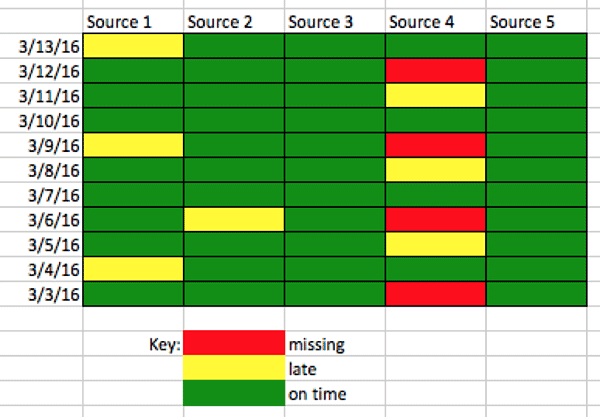
Figure 2: The data arrival report shows which data sources meet their target service levels.
When you bring these reports to the team, it will help everyone understand where time and resources are being wasted. Perhaps this will inspire a project to mitigate your worst bottleneck, leading to another project in one of the next areas.
Improve Collaboration
Conceptually, the data-analytics pipeline is a set of stages implemented using a wide variety of tools. All of the artifacts associated with these tools (JSON, XML, scripts, …) are just source code. Code deterministically controls the entire data-analytics pipeline from end to end.
If the code that runs your data pipeline is not in source control, then it may be spread out on different systems, not revision controlled, even misplaced. You can take a big step toward establishing a controlled, repeatable data pipeline by putting all your code in a source code repository. For example, Git is a free and open-source, distributed version control system used by many software developers. With version control, your team will be better able to reuse code, work in parallel and trace bugs back to source code changes. Version control also serves as the foundation for DataOps continuous deployment, which is an excellent long-term goal.
Lower Error Rates
Maybe the test coverage report mentioned above helped you understand that your data operations pipeline needs more tests. Tests apply to code (analytics) and streaming data. Tests can verify inputs, outputs and business logic at each stage of the data pipeline. Testing should also confirm that new analytics integrate seamlessly into the current production pipeline.
Below are some example tests:
- The number of customers should always be above a certain threshold value.
- The number of customers is not decreasing.
- The zip code for pharmacies has five digits.
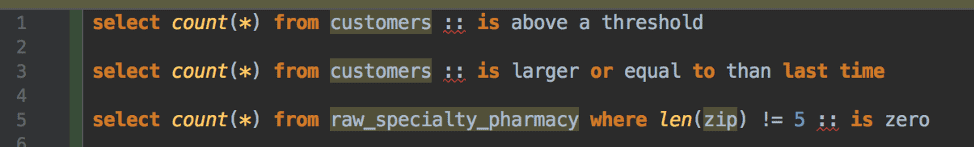
Figure 3: Every processing or transformation step should include tests that check inputs, outputs and evaluate results against business logic.
When you have started counting and cataloging your errors, start a quality circle, find patterns and aim to fix one error per month.
Decrease the Cycle Time of Change
In many enterprises, lengthy cycle time is a primary reason that analytics fail to deliver on the promise of improving data-driven decision making. When the process for creating new analytics depends on manual processes, there are many opportunities for a project to go off track.
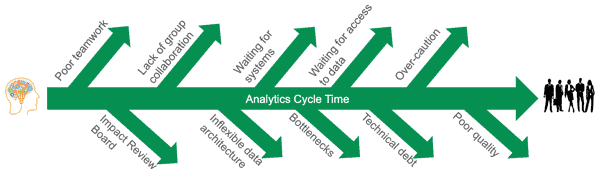
Figure 4: Factors that derail the development team and lengthen analytics cycle time
Leading software organizations deploy new and updated applications through an automated procedure that might resemble something like this:
- Spin-up hardware and software infrastructure
- Check source code out of source control
- Build
- Test
- Deploy into production
The first step in creating an efficient, repeatable build process is to minimize any dependencies on manual intervention. Each of these steps is a whole topic unto itself, but when you are starting out, a good place to focus is on testing. Your code tests should fully validate that analytics work, can handle errors such as bad data (by stopping or sending alerts) and integrate with the existing operations pipeline.
The image below shows the many different kinds of tests that should be performed. We explain each of these types of tests in our recent blog on impact view.

Figure 5: A broad set of tests can validate that the analytics work and fit into the overall system.
Tests that validate and monitor new analytics enable you to deploy with confidence. When you have certainty, you can deploy and integrate new analytics more quickly.
Conclusion
There are many small yet effective projects that you can start today that will serve your DataOps goals. Hopefully, we’ve given you a few ideas. We encourage you to learn more about DataOps by reading our book, “The DataOps Cookbook.” Good Luck, and tweet us to let us know how it goes. (@datakitchen_io #DataOps).
And, if you want to accelerate your DataOps journey, we have some software that can help you!