Why Observe Your Data Journey?
Problem #1: Many tools and pipelines — too many errors and delays:
- No enterprise-wide visibility of 100’s, 1000’s tools, pipelines, and data sets
- No end-to-end quality control
- Hard to diagnose issues
- Errors in data and elsewhere create distractions that limit new insight development
Problem #2: Data and analytic teams face friction in fixing these problems:
- Very Busy: teams are already busy and stressed — and know they are not meeting their customer’s expectations
- Low Change Appetite: Teams have complicated in-place data architectures and tools. They fear changing what is already running.
- No single pane of glass: no ability to see across all tools, pipelines, data sets, and teams in one place
- Teams don’t know where or how to check for data or artifact problems
- Teams experience a lot of blame and shame without shared context to see and diagnose problems in real time
What Problem Does Observing Your Data Journey Solve?
Many data teams are stuck in “hoping and praying” that their latest data feeds, system changes, and integrations won’t break anything. They wait for customers to find problems. They blindly trust their providers to deliver good data quickly without changing data structures. They interrupt the daily work of their best minds to chase and fix a single error in a specific pipeline. They do not know if the other thousands of data pipelines and tasks are failing.
It’s a culture of productivity drains, which results in customers losing trust in the data. Another result is rampant frustration within data teams. A survey of data engineers conducted by DataKitchen in 2022 revealed some shocking statistics: 78% feel they need to see a therapist, and a similar number have considered quitting or switching careers.
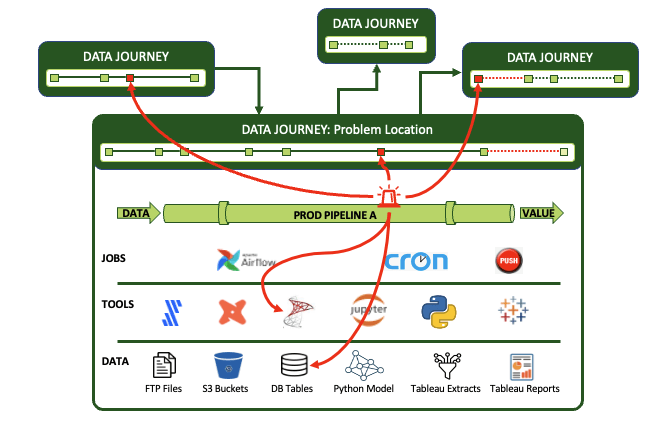
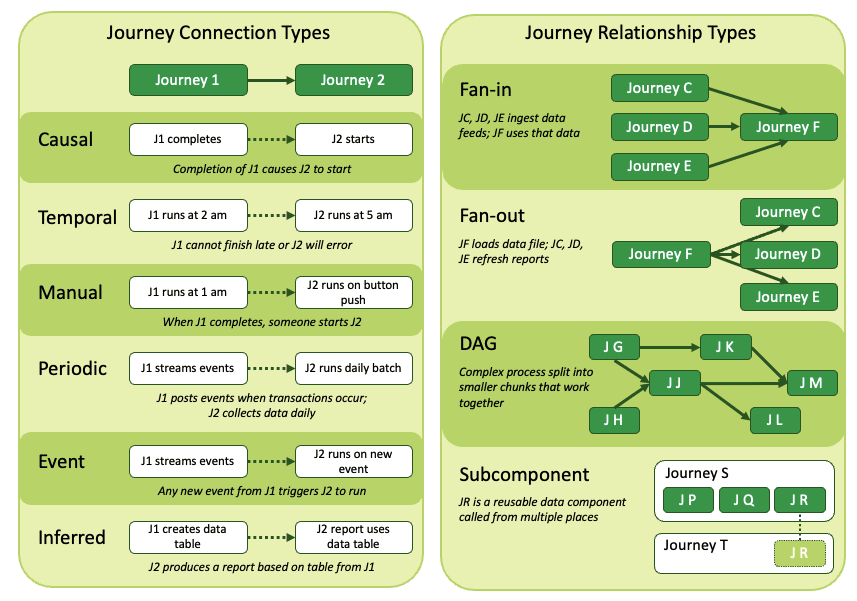
What Is A Data Journey?
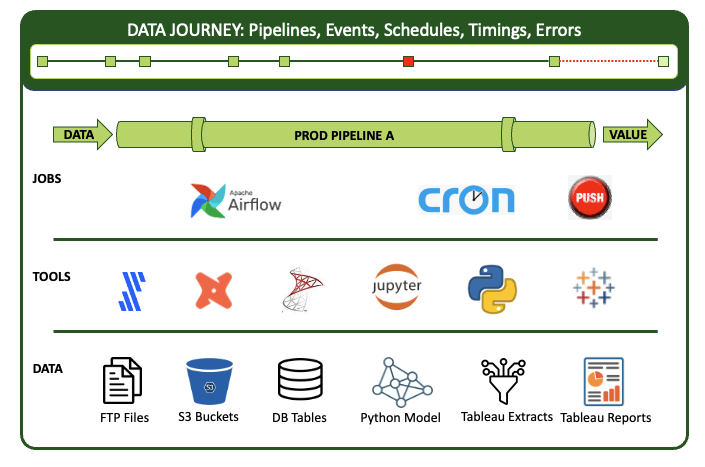
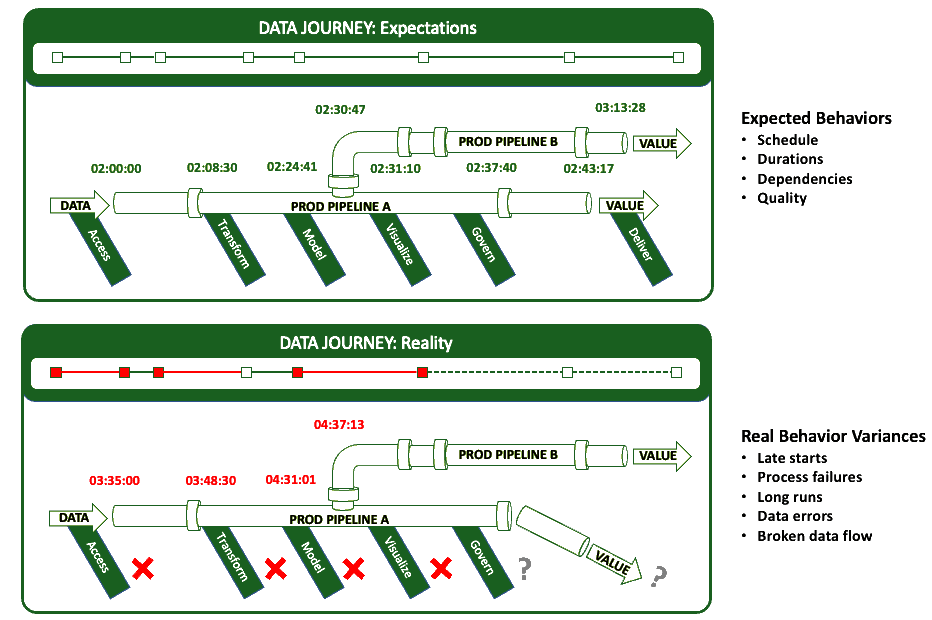
The data journey is about observing what you have done, not changing your existing data estate. Data Journeys track and monitor all levels of the data stack, from data to tools to code to tests across all critical dimensions. A Data Journey supplies real-time statuses and alerts on start times, processing durations, test results, and infrastructure events, among other metrics. With this information, you can know if everything ran on time and without errors and immediately identify the parts that didn’t.
Learn more about the principles and ideas in a Data Journey:
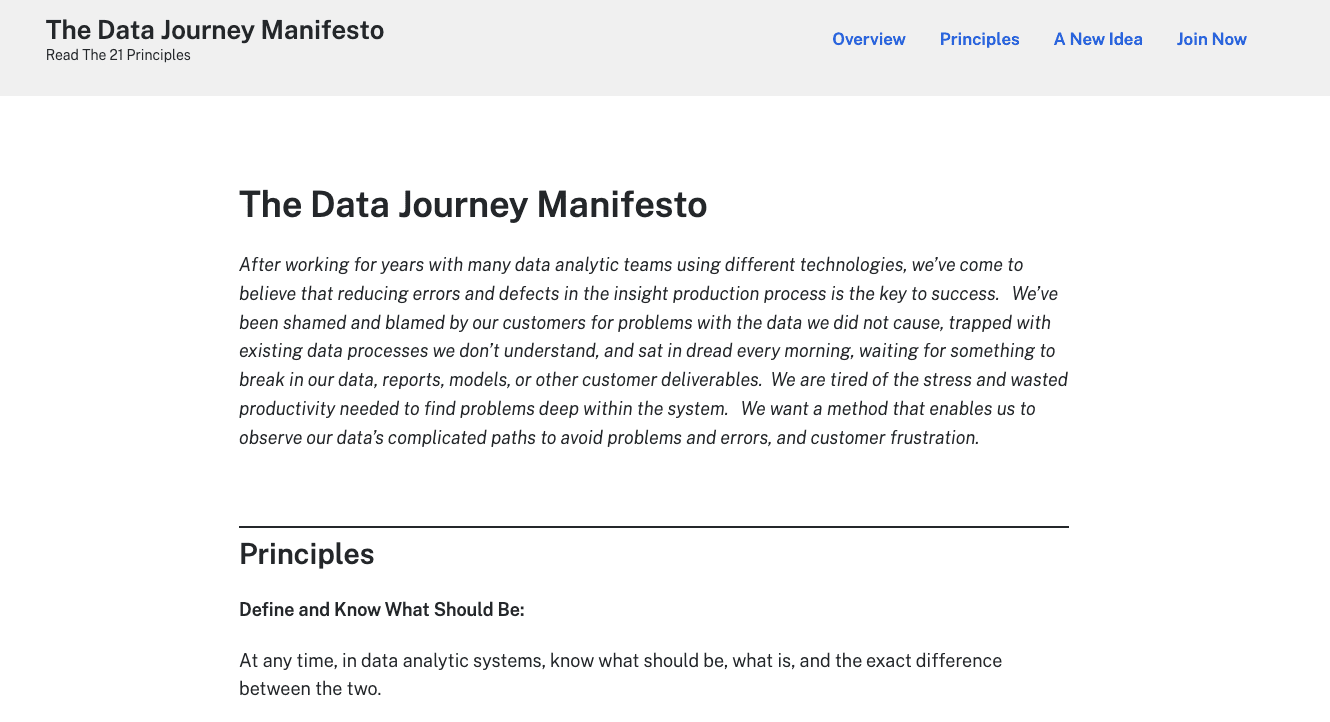
- Data Journey Manifesto
- Why the Data Journey Manifesto?
- Five Pillars of Data Journeys
- Data Journey First DataOps
- The Terms and Conditions of a Data Contract are Data Tests
- “You Complete Me,” said Data Lineage to Data Journeys
- Two Downs Make Two Ups: The Only Success Metrics That Matter
- Webinar: Data Journey — The Missing Piece
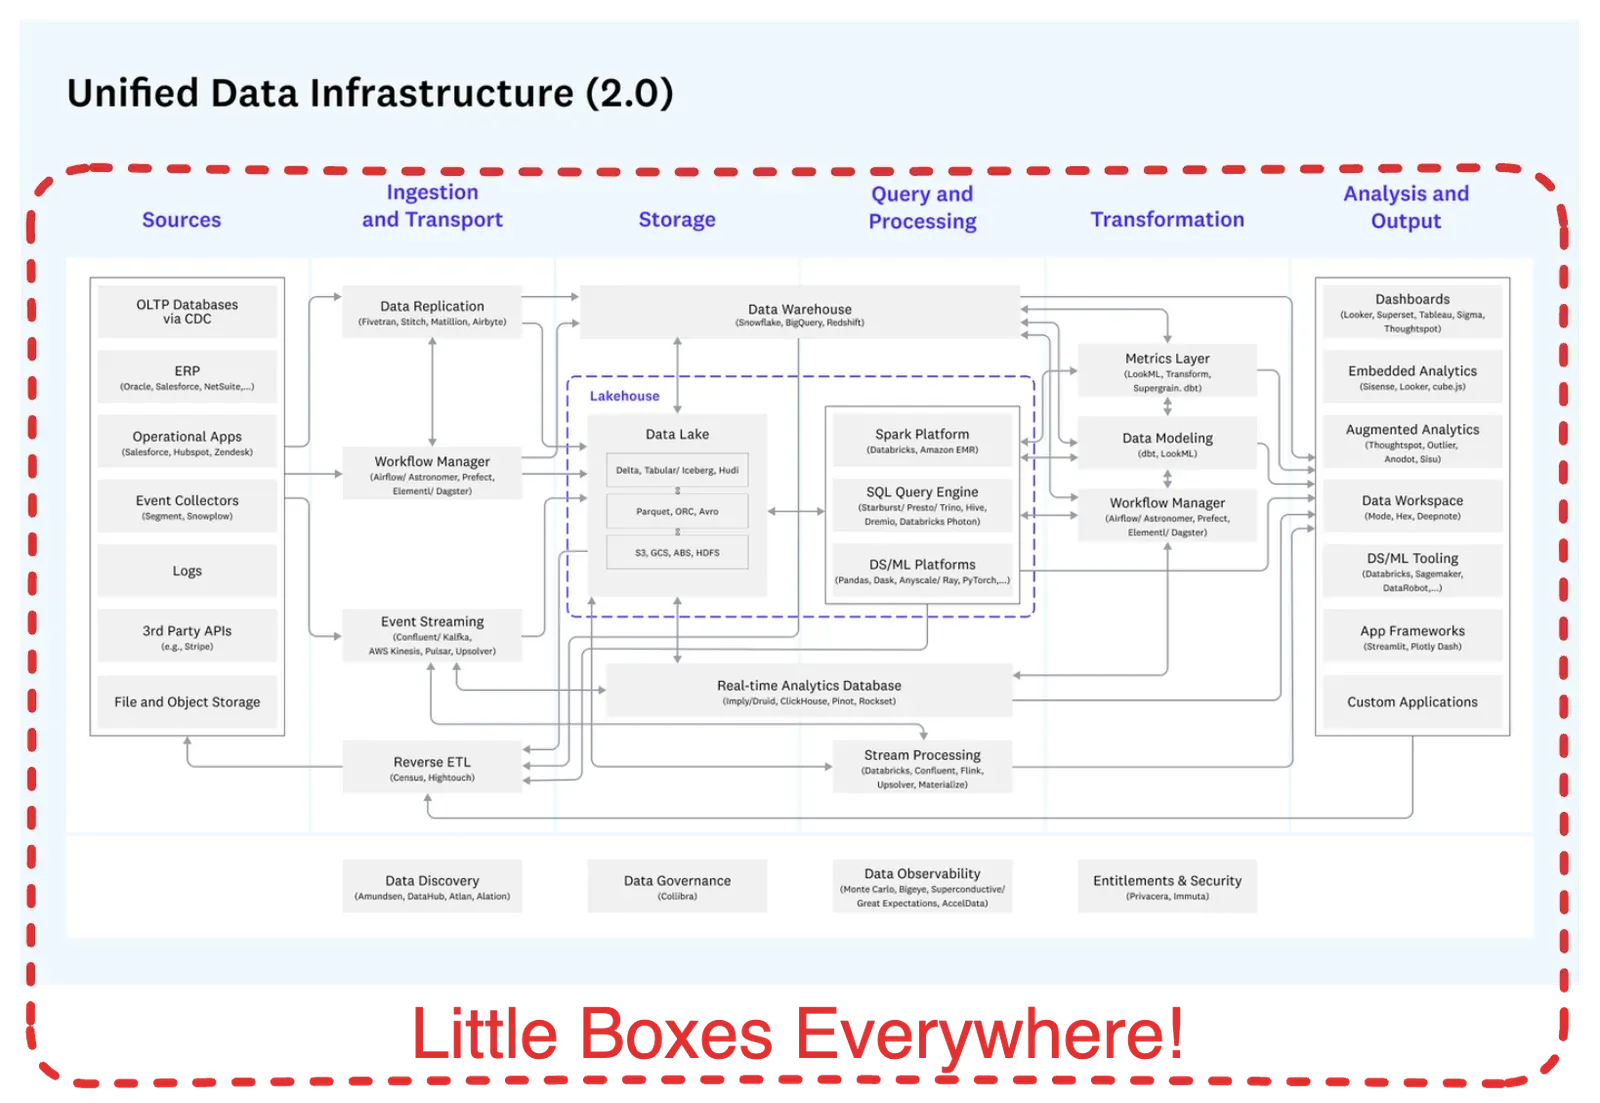
Why Is the ‘Modern Data Stack’ So Complicated?
The industry has valuable data, automation, and data science/analytic tools. But none of these tools fully addresses the core problem: Data Teams must monitor the entire data estate and why pipelines may succeed or fail across all these technologies and related data. Making matters more difficult is that this is a $60 Billion a year industry with hundreds of vendors.
How Does DataOps Observability Differ from Data Lineage?
Data lineage answers the question, “Where is this data coming from, and where is it going?” It is a way to describe the data assets in an organization. However, data lineage cannot answer questions like: “Can I trust this data?” “What happened during the data journey that caused the problem?” “Has this data been updated with the most recent files?”
Think of it this way: if your house is on fire, you don’t want to go to town hall and get the blueprints of your home to understand better how the fire could spread. You want smoke detectors in every room so you can be alerted quickly to avoid damage. Data Lineage is the blueprint of the house; a Data Journey is the set of fire detectors sending you signals in real-time. Ideally, you want both.
Why Should I Care About Errors and Bottlenecks?
You have a significant investment in your data and the infrastructure and tools your teams use to create value. Do you know it’s all working correctly, or do you hope and pray that a source data change, code fix, or new integration won’t break things? If something does break, can you find the problem efficiently and quickly, or does your team spend days diagnosing the issue?
Don’t Current APM Tools Do This Already?
To see across all the journeys that data travels and up/down the tech and data stack requires a meta-structure that goes beyond typical application performance monitoring and IT infrastructure monitoring software products. While quite valuable, these solutions all produce lagging indicators. For example, you may know that you are approaching limits on disk space, but you can’t say if the data on that disk is correct.
Since data errors happen more frequently than resource failures, data journeys provide crucial additional context for pipeline jobs and tools and the products they produce. They observe and collect information, then synthesize it into coherent views, alerts, and analytics.
What Are the Components of a DataOps Observability Solution?
- Represent the Complete Data Journey: Monitor every step across tools, data, and infrastructure and over complex organizational boundaries.
- Production Expectations, Data and Tool Testing, and Alerts: Set time, quality control, and process step order rules with proactive push notifications.
- Development Data and Tool Testing: Validate your entire data journey in the development process. Enable team members to ‘pull the pain forward.’
- Historical Dashboards and Root Cause Analysis: Store data over time about what happened and learn from mistakes.
- A User Interface Specific for Every Role: Easy to understand, role-based UI for IT, managers, data engineers, scientists, analysts, and business customers.
- Simple Integrations and an Open API: Pre-built, fast, easy integrations and an open API for rapid implementations.
- Monitor Costs and End-User Usage: Include specific cost items and monitor usage data to evaluate if a data journey’s costs outweigh its benefits.
- Start Fast With Low Effort: Automatically generate a base set of data tests and expectations so teams can get value quickly.
Who Cares About DataOps Observability?
Data and analytic teams and their leaders (CDOs, Directors of Data Engineering / Architecture / Enablement / Science). Small data teams that develop and support customer-facing data and analytic systems. Any group wanting to work with less embarrassment, hassle, and more time to create original insight.
How Does This Compare with Data Quality?
Many enterprises have few process controls on data flowing through their data factory. “Hoping for the best” is not an effective manufacturing strategy. You want to catch errors as early in your process as possible.
A sole focus on source data quality does not fix all problems. DataOps Observability ensures continuous testing and improvement in data integrity, working 24x7 to validate the correctness of your data and analytics journey.
Quality = Data Quality + Process Quality
How Is DataOps Observability Different from Data Observability?
Data Observability tools test data in the database. This is a fine thing, and DataKitchen has been promoting the idea of data tests for many years. However, you need to correlate those test results with other critical elements of the data journey — that is what DataOps Observability does.
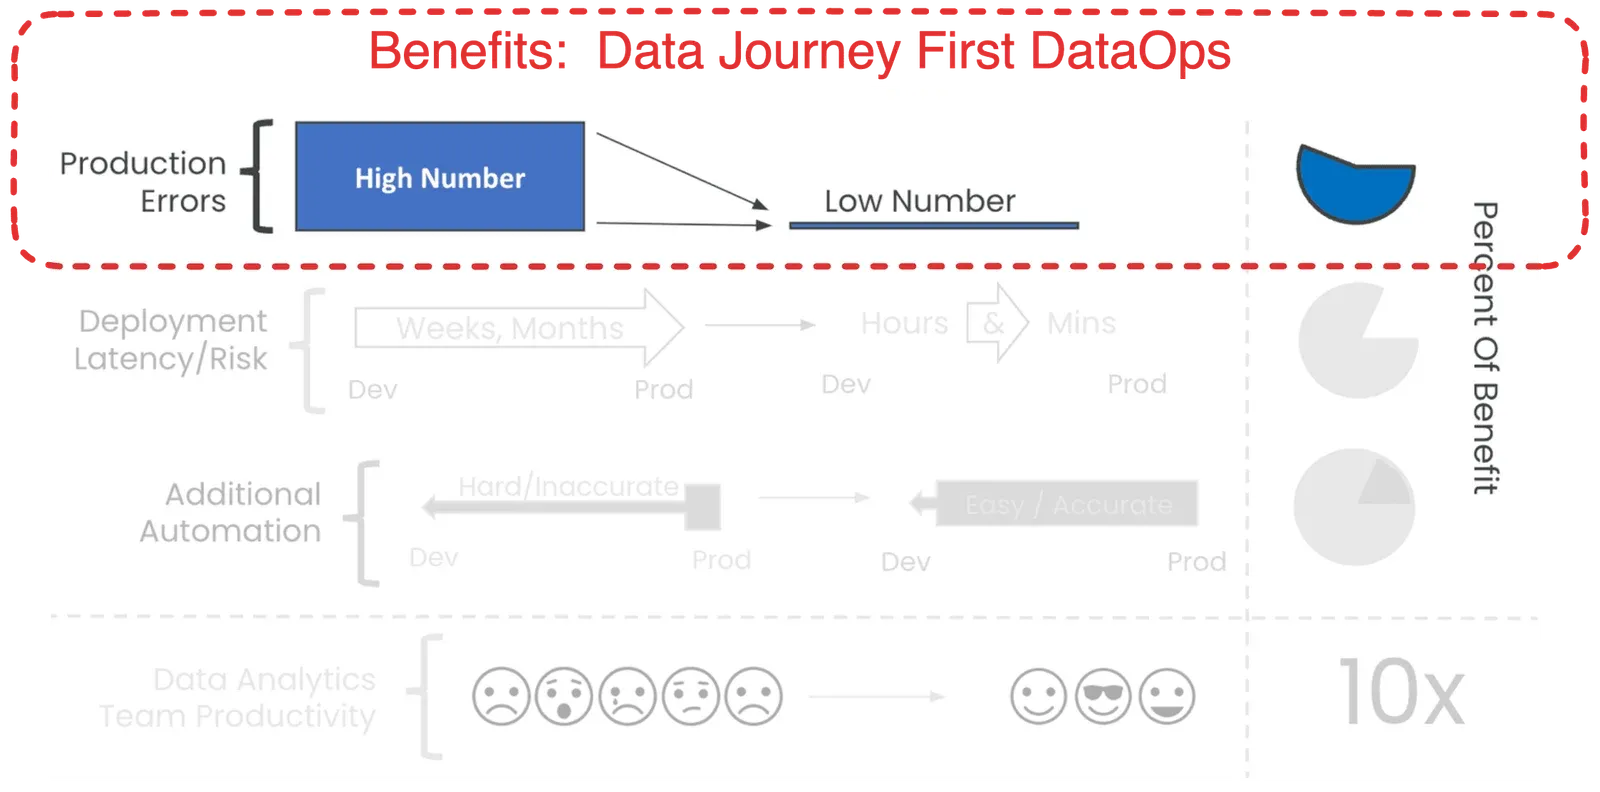
Why Data Journey First DataOps?
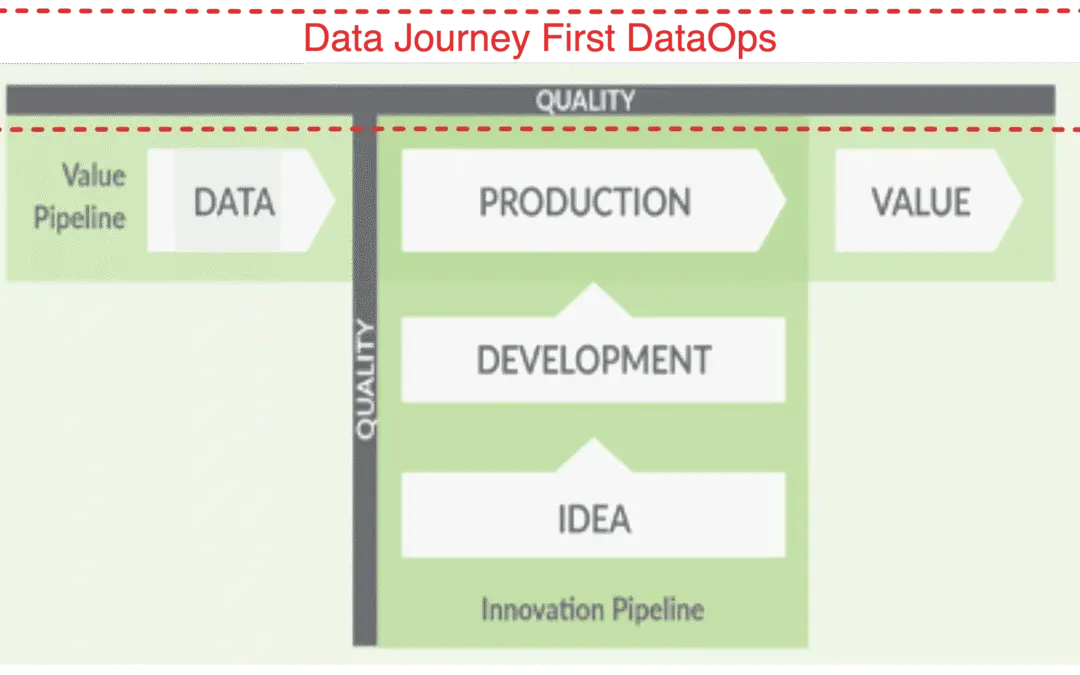
Given the complicated distributed systems we use to get value from data and the diversity of data, we need a simplifying framework. That idea is the Data Journey. In an era where data drives innovation and growth, it’s paramount that data leaders and engineers understand and monitor the five pillars of a Data Journey.
Data Journey First DataOps requires a deep and continuous understanding of your production data estate. It provides a dynamic understanding of how your data flows, transforms, gets enriched, and is consumed. It allows you to trust through active verification. By observing Data Journeys, you can detect problems early, streamline your processes, and lower embarrassing errors in production.
Where Can I Learn More?
A great place to start is The DataOps Cookbook. Other useful resources include: