How much of your time do you spend writing tests? In a DataOps enterprise, data professionals spend 20% of their time writing tests. This may seem like a lot, but if an organization is wasting time due to errors, every hour spent on tests saves many hours in lost productivity.
In a recent Gartner survey, data professionals spent 56% of their time on operational execution and only 22% of their time on innovation that delivers value. These can and should be reversed with the right tools strategy and methodology.
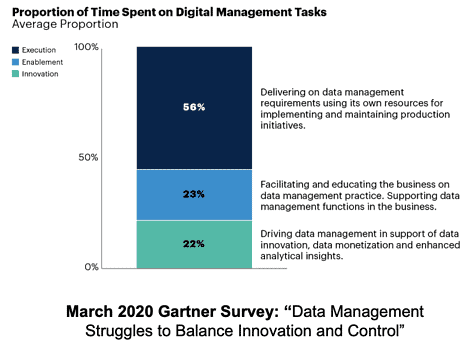
Figure 1: March 2020 Gartner Survey, Data Management Struggles to Balance Innovation and Control
Gartner describes the time spent on “operational execution” as using the data team to implement and maintain production initiatives. A big percentage of the time that data scientists spend on operational maintenance is consumed servicing errors and outages, including data errors, production process issues, outages and missed service level agreements (SLA).
Enterprises that follow DataOps principles typically have less than 1 error per year. That is orders of magnitude better than the industry norm. In a recent DataOps survey, only 3% of the companies surveyed approached that level of quality. Eighty percent of companies surveyed reported three or more errors per month. Thirty percent of respondents reported more than 11 errors per month. This is a staggering figure, and it has implications.
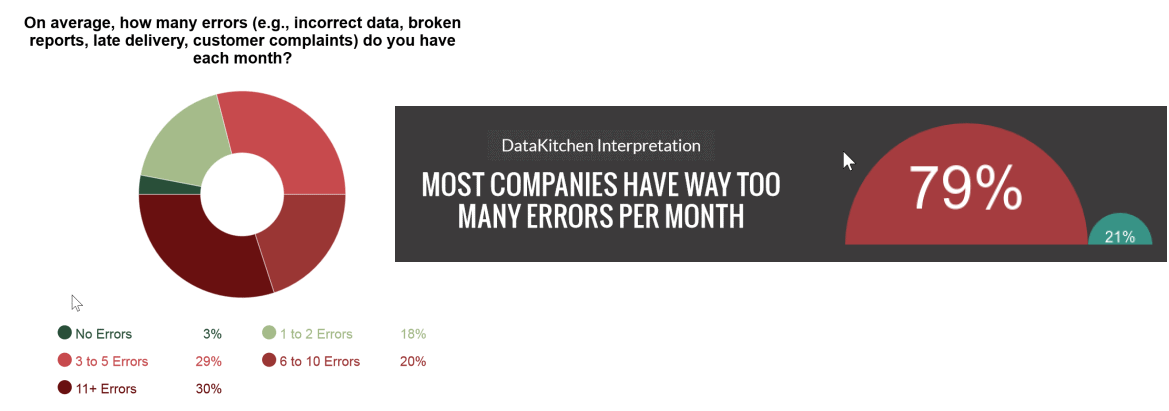
Figure 2: Results of a DataOps survey on the number of errors per month experienced by enterprises.
Benefits of reducing errors:
- More Innovation – Reducing errors eliminates unplanned work that pulls members of the data team from their high-priority analytics development tasks. An enterprise cannot derive value from its data unless data scientists can stay focused on innovation.
- More Trust – Errors undermine trust in data and in the data team. Less confidence means less data-driven decision making; in other words, emotionally-biased decision making.
- Less Stress – Errors can occur at any moment. The feeling of continuous anxiety is unhealthy for team members and reduces their ability to relax and enjoy their work. Happy and relaxed people think more clearly and creatively.
- Less Embarrassment – Errors in data analytics tend to occur in a very public manner. When data errors corrupt reports and dashboards, it can be extremely uncomfortable for the manager of the data team. As embarrassing as it is to have your mistakes highlighted in public, it’s actually much worse if the errors go unnoticed. Imagine if the business makes a costly and critical decision based on erroneous data?
The Value and Innovation Pipelines
Testing plays a dual role in a DataOps enterprise. The Value Pipeline represents data operations. It takes data and transforms it to create value for the organization. We don’t want data pipeline errors ruining operational analytics. We don’t want to learn about analytics quality issues from users and customers.
The Innovation Pipeline is the collection of processes that create new analytics. The Innovation Pipeline creates new analytics, based on an idea, and deploys them into production. This is closer to a code development workflow. We want to make sure that deployed changes do not break or create errors in data operations.
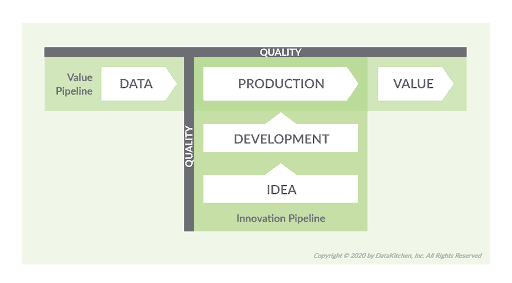
Figure 3: The Value and Innovation Pipelines in data analytics.
DataOps employs automated testing to address errors in both the Value and Innovation Pipelines. The type of testing needed in the Value and Innovation Pipelines is different. We explained this further in our blog “DataOps is NOT Just DevOps for Data.” In this blog, we are going to focus on testing the Value Pipeline (the data operations pipeline).
Errors in the Value Pipeline
Errors in the Value Pipeline are like defective cars coming off an automobile manufacturing assembly line. Fortunately, industrial manufacturers have been working on improving quality and reducing errors for over a century. They apply measurement and statistical controls to each stage of work-in-progress (WIP).
Similarly, the key to lowering the error rate in the Value Pipeline is to automate the monitoring and testing of the data operations pipeline. As the figure below shows, DataOps tests each stage of the data-analytics pipeline from data integration to ETL to the publication of analytics.
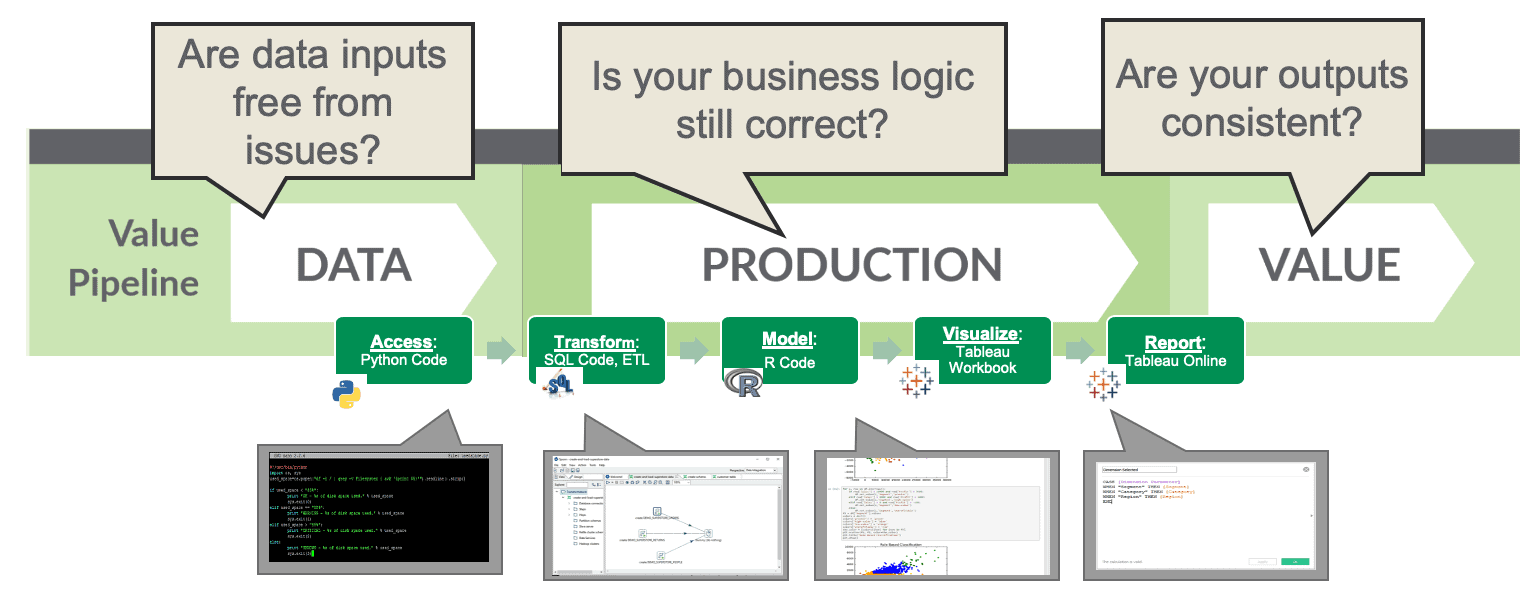
Figure 4: Data pipeline tests catch errors by checking inputs, business logic and outputs at each processing step.
Data operations pipeline tests come in a wide variety of shapes and sizes. Basic types of tests include input, output and business logic tests. Here are some examples:
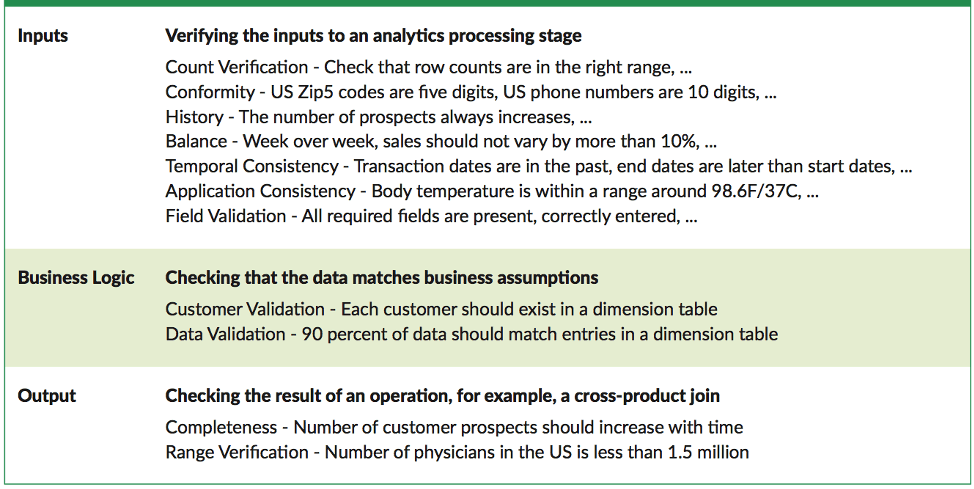
Figure 5: Three types of tests: input tests, business logic tests and output tests.
Two common tests are location balance and historical balance tests. The location balance tests check the number of rows, dimension and facts at each stage of the data pipeline. If they don’t match business logic, the orchestration engine optionally stops the data pipeline and issues an alert or warning to the data team.
The historical balance test compares current data to previous or expected values. These tests rely upon historical values as a reference to determine whether data values are reasonable (or within the range of reasonable). For example, a test can check the top fifty customers or suppliers. Did their values unexpectedly or unreasonably go up or down relative to historical values?
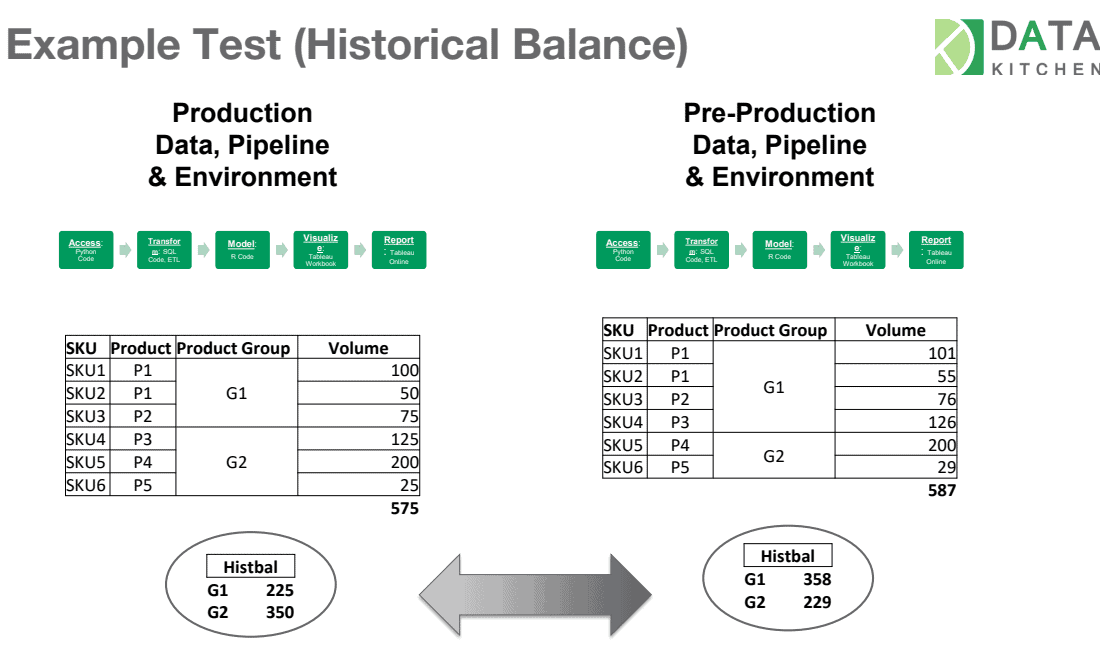
Figure 6: Historical balance tests compare current data to previous or expected values.
In the figure above, the historical balance test shows how group G1 increased significantly and G2 greatly decreased. The automated historical balance test notifies the appropriate member of the data team who investigates. Upon closer examination, the data analyst sees that product P3 was moved from group G2 to G1. Perhaps this happened because of a change in a company-wide standard metric. It’s much preferred for the data team to inform users about changes like this proactively rather than field complaints that the charts and graphs look wrong. As many data professionals know from experience, users mistrust analytics that don’t match their assumptions. A simple heads up about changes like these can maintain trust in the data and the data team.
Below are some additional illustrations of tests. The first two queries below verify that the customer count is above a certain value (location balance) and that the number of customers is not shrinking (historical balance).
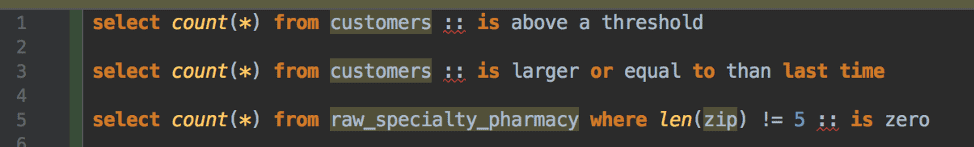
Figure 7: Tests can be as simple as an SQL query.
No one has a perfect test suite on day one. The key is to start writing tests and keep adding to them. Over time, your pipeline tests will grow in breadth and robustness. Testing is well worth the investment of time. As testing improves, error rates decline and productivity improves.
Tests also provide transparency to the data operations pipeline. When using a DataOps Platform, the orchestration engine executes DAG and collects status on each executed node. Below is a simple diagram of node status.
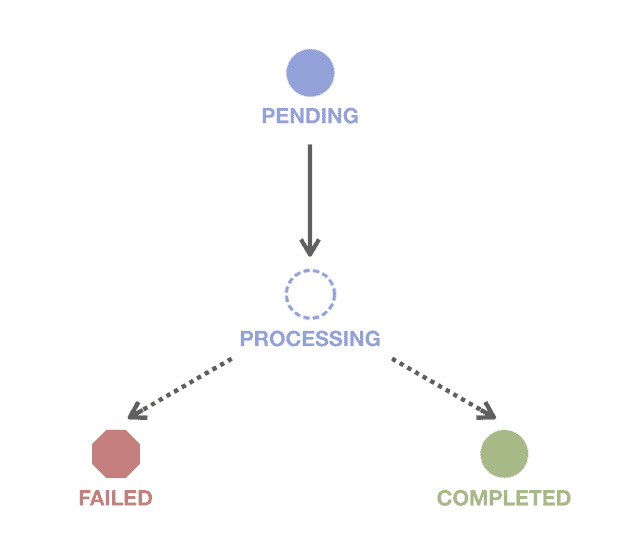
Figure 8: The DataOps Platform collects status on each executing node in the data operations pipeline.
In the below example, the first-level node “mio” is a processing step in the data operations pipeline. Node mio executes and fails one of its tests. Nodes at the same level as mio can execute, but any node dependent on mio has an issue. In this case, the node “another” depends on the output of mio. The orchestration can be configured to take steps to address this failure mode depending on the severity of an error.
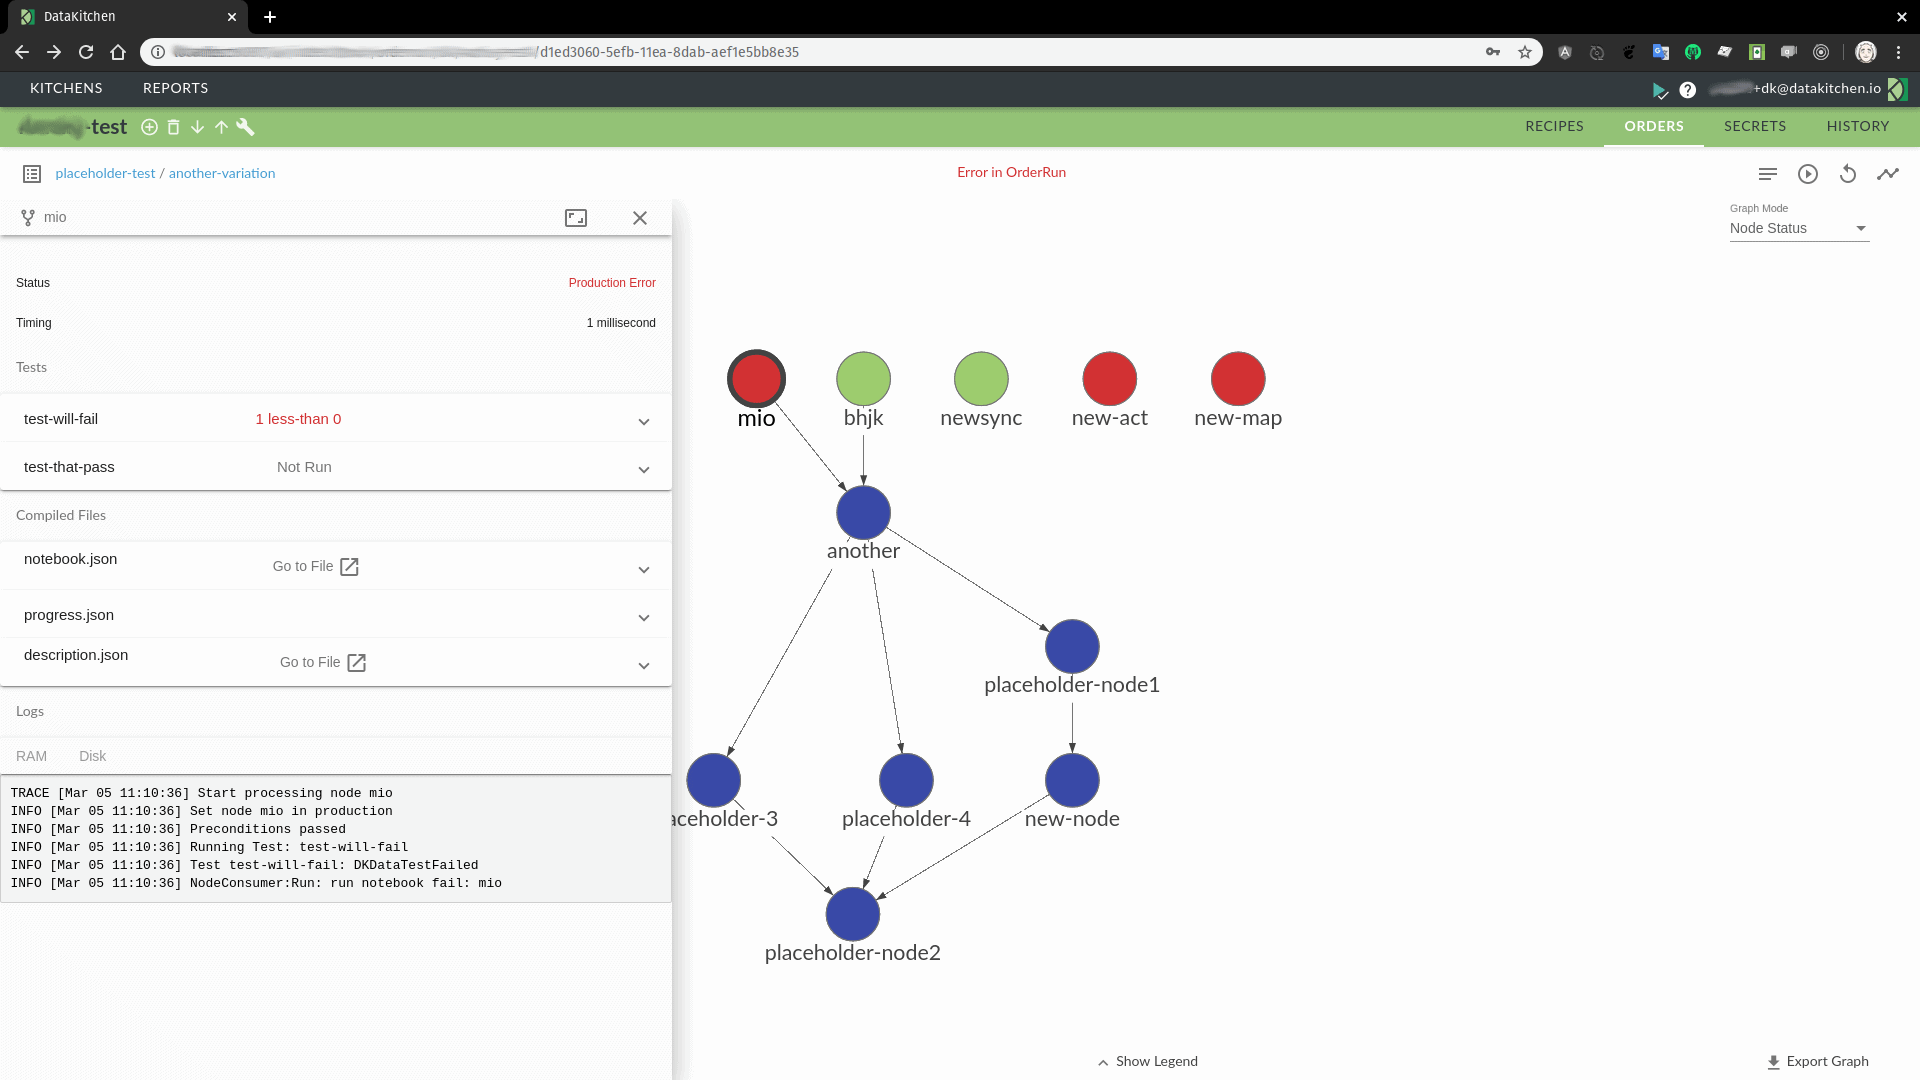
Figure 9: Execution status within a DAG
When the status of all nodes is aggregated, you have a high-level picture of how your data pipeline is running. It could be as simple as green (pass) or red (fail) for the whole pipeline. A manager in charge of operations might glance at this top-level indicator every hour or so just to make sure it is still green. This can be a huge time saver and a great way to keep one’s finger on the pulse of data operations in real-time.
When tests fail or issue warnings, the orchestration engine could be programmed to take action. In many cases, that is an alert or message sent through slack, email or another messaging application. The image below shows how a pipeline error in the “s3_to_redshift” node triggers messaging applications.
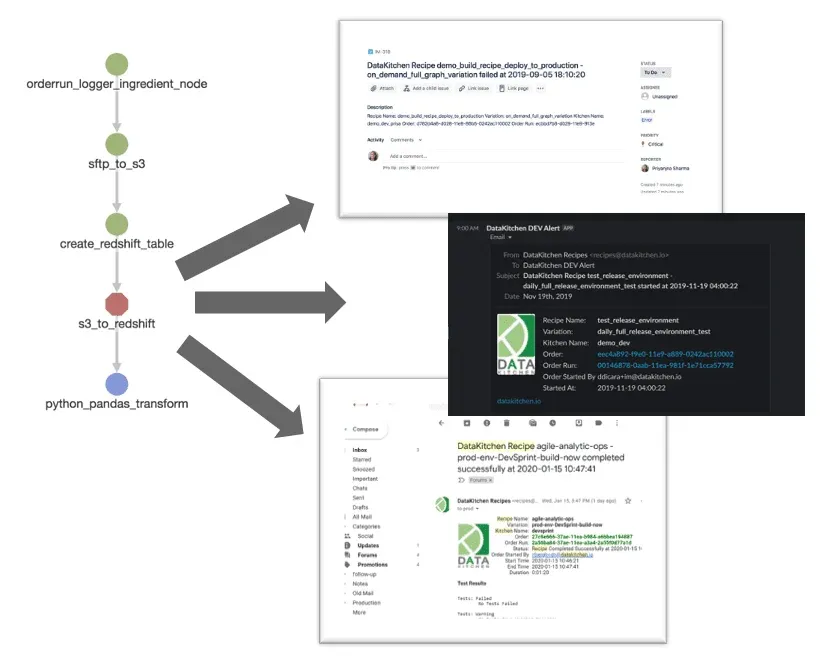
Figure 10: Errors trigger alerts or warnings communicated via messaging applications.
The Role of a DataOps Platform
The diagram below shows the number of tests associated with each step in a data pipeline. A DataOps Platform integrates the processing nodes in each data pipeline with their associated tests. It also creates a common framework that can accept heterogeneous tools used in each node. So each data engineer or data scientist can use the tool that they prefer and the DataOps Platform standardizes the interfaces.
The typical data pipeline uses numerous tools, each performing a specific job. The DataOps Platform spans the entire pipeline, from data sources to published analytics, allowing you to write tests for each and every step along the way. Imagine having to learn all of the tools in the data pipeline and writing tests within each tool’s domain for its subset of operations.
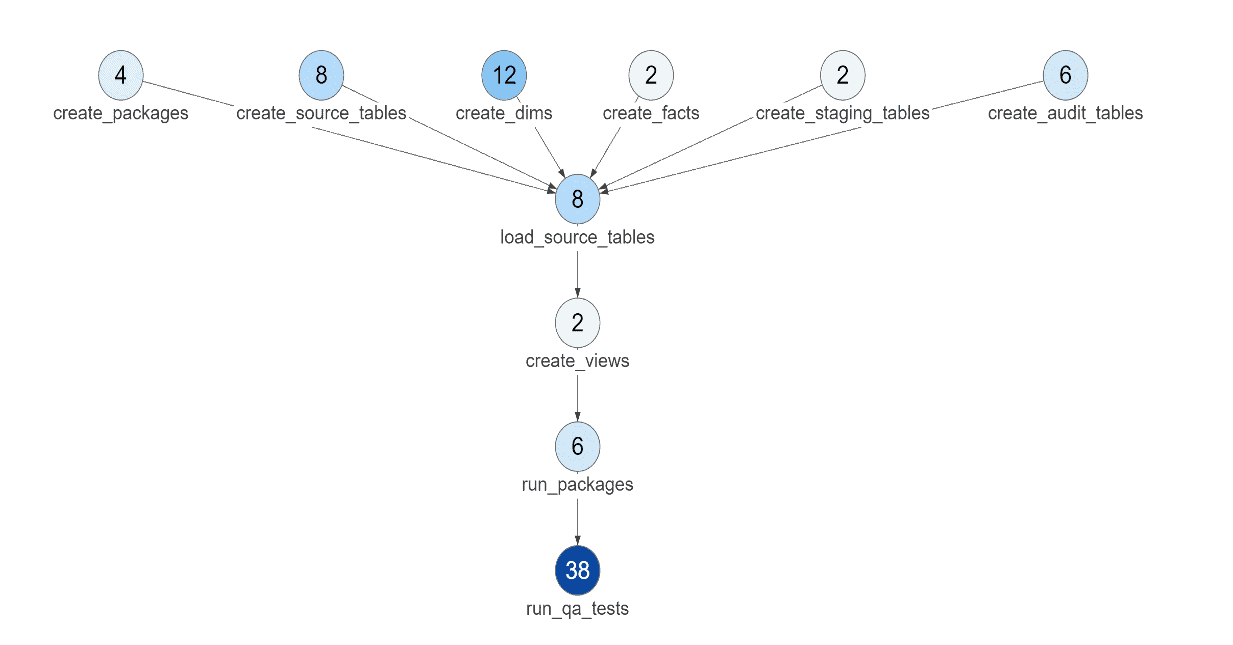
Figure 11: The number of tests in each node of a DAG.
DataOps Kitchens
Pipeline orchestrations with associated tests become reusable components that members of the data team can share with each other through a virtual environment called a Kitchen. The Kitchen environment is a workspace; a place where data professionals do their work. It allows data scientists, analysts and engineers to share data pipelines, along with their tests, with each other. The data pipeline appears in a library of reusable components, which can be used or modified. The tests that everyone develops are also shared and as the tests grow in number, quality improves. Below is a screenshot of a DataOps Kitchen UI.
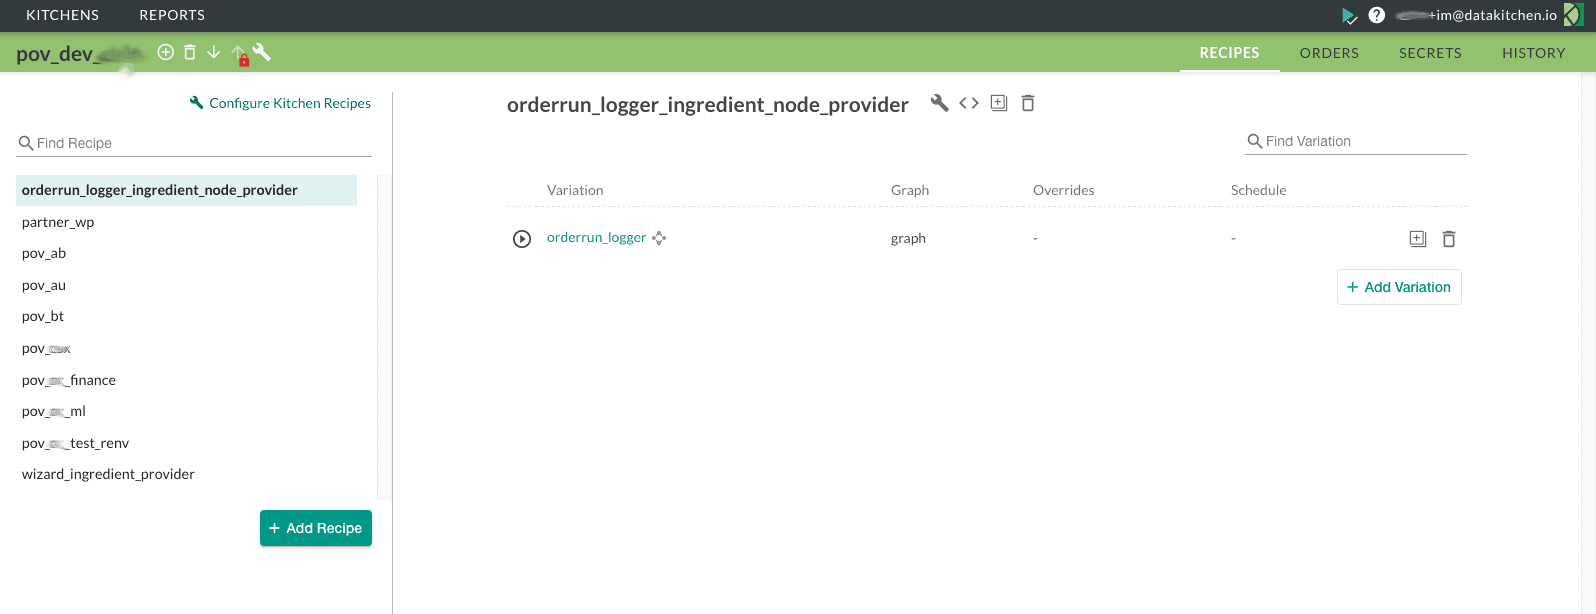
Figure 11: A Kitchen environment is a workspace; a place where data professionals do their work.
When an enterprise uses the DataKitchen Platform to implement DataOps, they spend far less time on errors and operational tasks. They find they can spend the majority of their time on innovative new features for their internal customers and stakeholders.
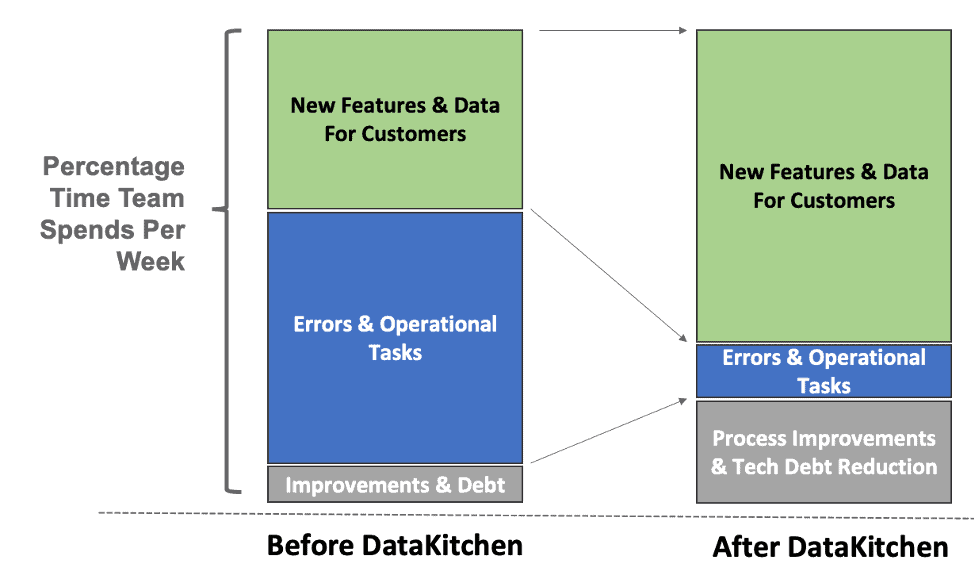
Figure 12: The percentage of time a team spends on errors and operational tasks decreases significantly with the DataKitchen Platform
A DataOps Platform sits atop the end-to-end toolchain and automatically orchestrates the processing and testing for the Value Pipeline. It sends alerts and notifications when an issue occurs and manages logs that assist in debugging. Lowering the rate of errors reduces the level of stress on the data team, and ultimately leads to more innovation.
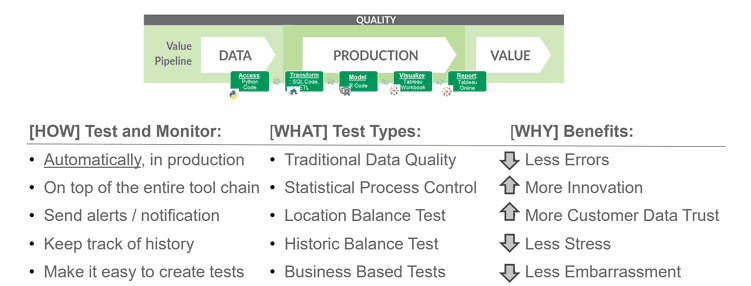
Figure 13: Among other things, a DataOps Platform drives production testing, which lowers error rates and encourages trust in the data.
The DataOps Platform automates the execution of tests, freeing up the data team to invest in high-priority projects. As the number of tests in the Value Pipeline grows, the number of errors gradually drops to nearly zero. With a more productive, trusted and responsive data team, an enterprise turns data-analytics into a true competitive advantage.
To understand a day in the life of a data professional working in a DataOps organization, please see our blog “Improving Teamwork in Data Analytics with DataOps.”