Enterprises have adopted self-service analytics in order to promote innovation – self-service tools are ubiquitous. While data democracy improves productivity, self-service analytics also bring a fair amount of chaos. Enterprises are searching for ways to control self-service users from a governance perspective without stifling innovation. CDO’s find themselves managing a delicate balance between centralization and freedom.
Centralization enables data organizations to control access to sensitive information, standardize metrics, clean/wrangle data, deliver data and analytics on an enterprise level, and control operations. However, centralized development teams can’t keep up with the never-ending flow of requests and ideas from business users.
The advent of self-service tools has created a many-to-many relationship between analytics development and production (Figure 1). Users and analysts across the enterprise develop and deploy analytics for a variety of consumers. One major brokerage firm equipped 16,000+ employees with self-service analytics tools and saw a significant increase in the creation of analytics. Recognizing the benefit of empowering users with data, an enterprise still has to manage all of that grass-roots innovation to safeguard personal information, adhere to regulations and keep practices and definitions consistent. No small task and if it isn’t done correctly, heads will roll.
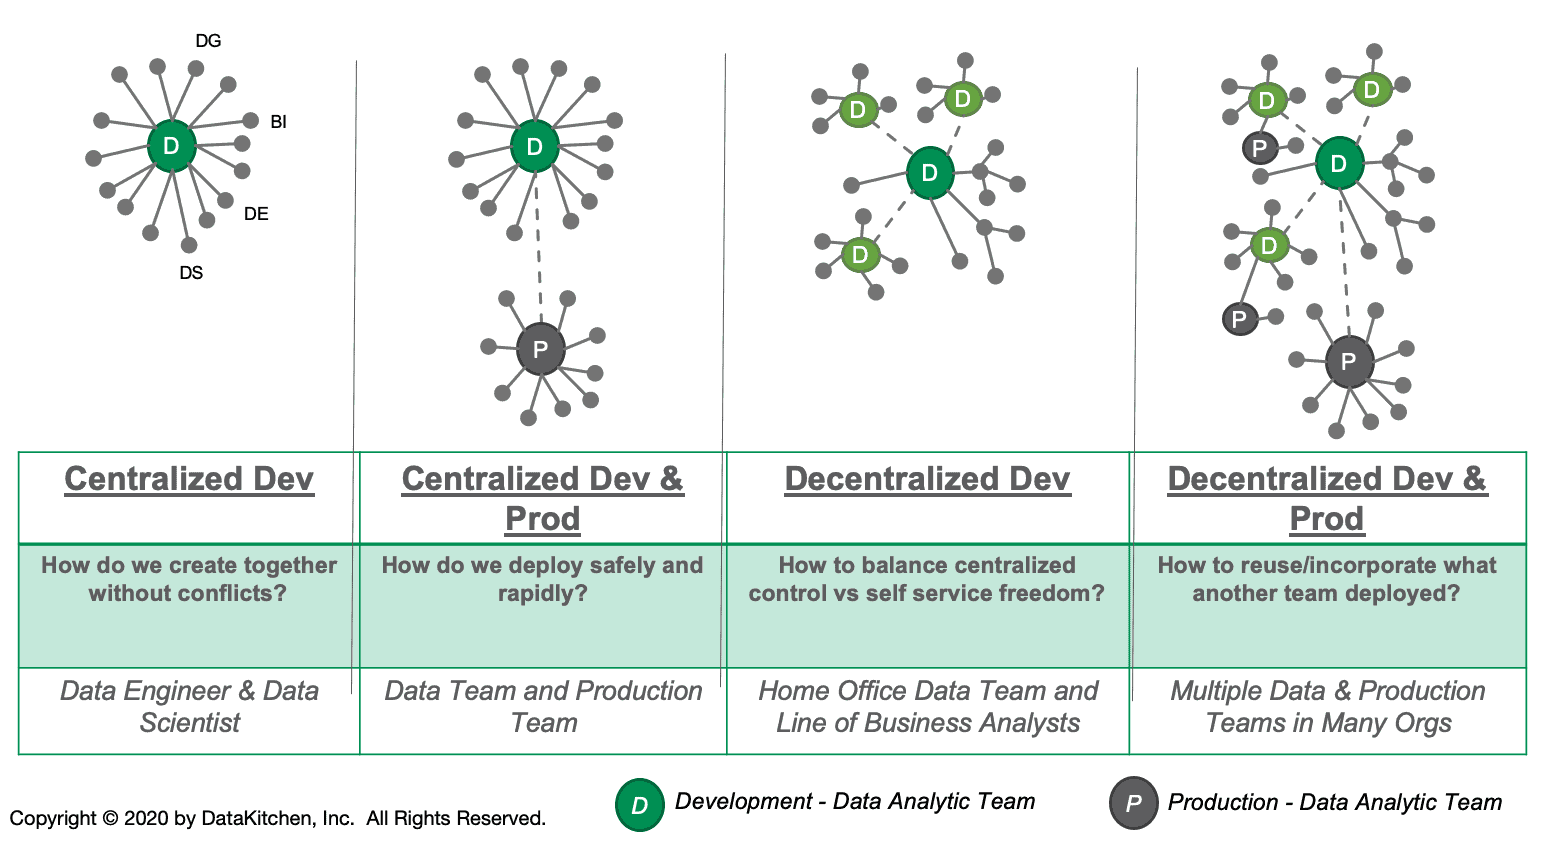
Figure 1: Most analytics organizations have a mix of self-service and centralized tools that combine to deliver insight to their end customers. Decentralized development creates a many-to-many relationship between development and production, but that activity must be governed.
Creative Chaos
If an enterprise constrains freedom, users rebel. They will copy data to their laptop, data science appliance, or cloud service in order to use their preferred toolchain. If they create analytics on an island, the source code may never be reintegrated into centralized source control. After all, users tend to focus on their immediate goals – adherence to governance and policies is secondary. Users like the creative side of projects. Many of them would rather not own the repetitive deployment phase of analytics and the continuous documentation that is necessary for proper governance.
From the CDO’s perspective, self-service analytics spur innovation, but can be difficult to manage. Data flowing into uncontrolled workspaces complicates security and governance. Without visibility into decentralized development, the organization loses track of its data sources and data catalog, and can’t standardize metrics. The lack of cohesion makes collaboration more difficult, adds latency to workflows, creates infrastructure silos, and complicates analytics management and deployment. It’s hard to keep the trains running on time amid the creative chaos of self-service analytics.
Governance and security are not optional. Existing and emerging regulations now require enterprises that collect customer data to manage it carefully. Uncontrolled behavior simply can’t be allowed. Below are some example regulations:
- Gramm-Leach-Bliley Act (GLBA) – mandates that financial institutions (defined broadly) ensure the security and confidentiality of customer information at all times, even while the information is in transit; including file, message, and email transfers.
- California Consumer Privacy Act – Modeled after the EU’s General Data Protection Regulation (GDPR), the California Consumer Privacy Act (CCPA) introduces new privacy rights for consumers and will force companies that conduct business in California to implement structural changes to their privacy programs.
In addition to the two regulations mentioned above, there are many other proposals working their way through state and federal governments. While there are many positive reasons to adopt and encourage self-service analytics, managers can’t ignore the need for robust governance and security. The question is how to empower users to maximize productivity while adhering to policies? Managers must do both.
Finding the Balance
New tools and methods, collectively called DataOps, make it possible to support data democracy while enforcing controls. DataOps is an application of Agile Development, DevOps and lean manufacturing principles to data analytics. When backed by an automated platform, such as the DataKitchen DataOps Platform, enterprises can empower users with self-service tools within a robust framework that monitors and enforces governance policies. Here’s how it works.
Among its many functionalities, the DataKitchen Platform orchestrates three basic workflows:
- self-service sandboxes – environments where analytics are developed
- analytics deployment pipelines – how analytics are moved from dev to production
- data operations pipelines – where analytics drive applications or produce reports, dashboards, etc., …
We’ll touch on each of these orchestrations and how they combine to create a governance framework within which users can freely pursue their innovative ideas.
Orchestrating Self-Service Sandboxes
The key to maximizing user productivity lies in designing automated orchestrations of common workflows that can be run by users on-demand. For example, when a project begins, users create a development environment that includes tools, data and everything else they need. In a non-DataOps enterprise, this process involves a lot of manual steps and delays. For example:
- Multiple management approvals
- Authentication of the user requesting the sandbox
- Provisioning of hardware assets
- Purchase/installation/configuration of software
- Replication/preprocessing/deidentification of data
We spoke to one enterprise recently that took between 10-20 weeks to complete these tasks. In order to improve their agility, we helped them implement self-service sandboxes. A self-service sandbox is an environment that includes everything a data analyst or data scientist needs in order to create analytics. For example:
- Complete toolchain
- Security vault providing access to tools
- Prepackaged data sets
- Role-based access control for a project team
- Integration with workflow management
- Orchestrated path to production – continuous deployment
- DataKitchen Kitchen – a workspace that integrates tools, services and workflows
- Governance – tracking user activity with respect to regulated data
The environment is “self-service” because it can be created on demand by any authenticated user. Creating and deleting sandboxes on demand affords much greater flexibility and agility as compared to waiting months for environment creation.
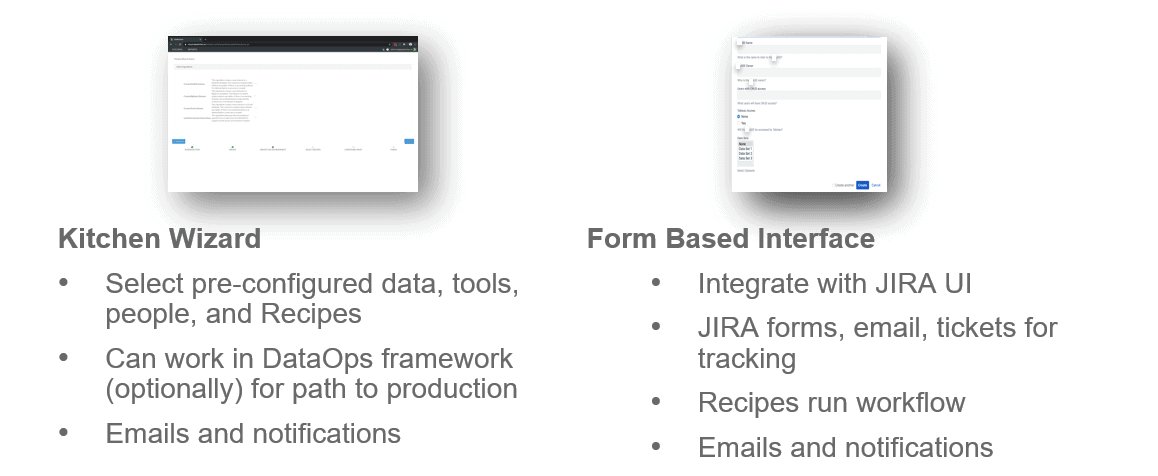
Figure 2: To create a self-service sandbox, users fill out a simple form or walk through a wizard.
We call the environment a “sandbox” because it is a private workspace where one or more users can play with analytics ideas. If the ideas don’t work out, then the sandbox can be destroyed – no harm done. If the analytics created in the sandbox merit wider distribution then there is a built-in path to orchestrated deployment. The self-service sandbox addresses two important capabilities that Gartner recommends for analytics organizations as part of their “Reference Data Analytics Architecture (Figure 3).”
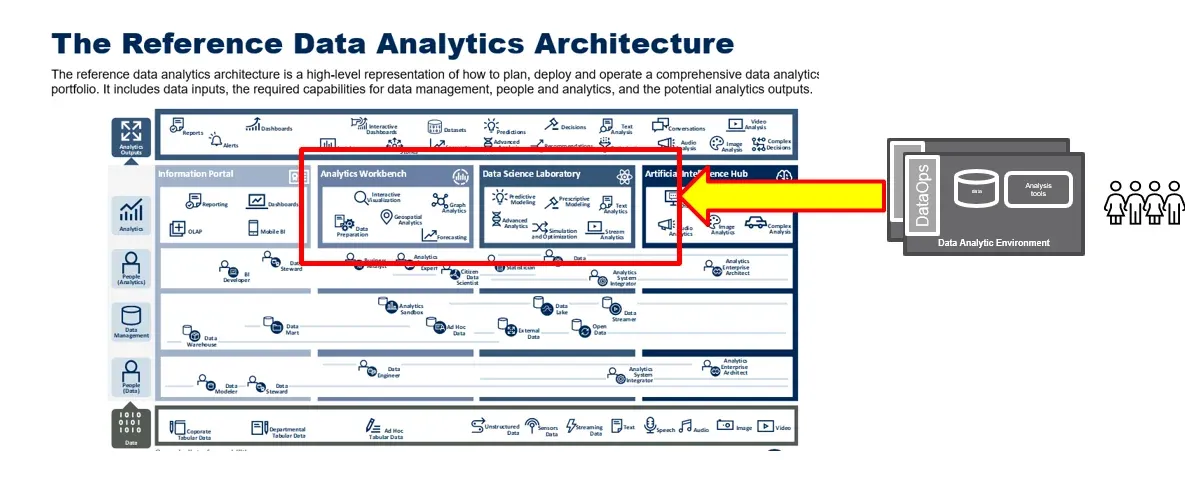
Figure 3: The self-service sandbox provides the “analytics workbench” and “data science laboratory” that Gartner recommends as part of their “Reference Data Analytics Architecture.”
The orchestration of environments is much faster and more efficient than creating them manually, but it’s important to understand how self-service sandboxes support governance. The tools, data sets and orchestrated workflows made available in the self-service sandbox are pre-approved by the data governance board. Additionally, the sandbox is monitored from a governance perspective by a background process. If the user violates a rule, like exporting data from a sensitive database, the governance monitor forwards an alert to the appropriate person or group. Everyday activities like database/table creation or running a data pipeline are added to an event log for potential use in an audit or review.
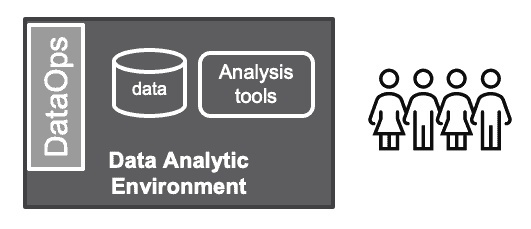
Figure 4: The Self-Service Sandbox is a DataOps analytics-development environment that contains everything a self-service analytics user needs in order to be productive.
Users like self-service sandboxes because they are easy to create and they contain everything they need in order to be productive, including self-service tools. Sandboxes have a built-in integration and deployment mechanism so users can publish analytics without having to assume ownership for data operations. (Figure 4)
Data stewards like self-service sandboxes because everyone can be productive while still being actively monitored from a compliance and governance perspective. Data stewards can empower users by making services, resources and data available to users as part of sandbox creation. If someone or something violates the rules, their access to data can be constrained or withheld.
Self-service sandboxes incorporate elements of centralization and freedom in a way that enables everyone to pursue their mission without conflict. In Figure 5, we see the centralized IT or data group designing the orchestration mechanism that grants self-service sandboxes on demand to users. The centralized group also monitors user activity by building governance automation into the sandboxes. If policies are violated, the centralized IT team can impose limits on the user.
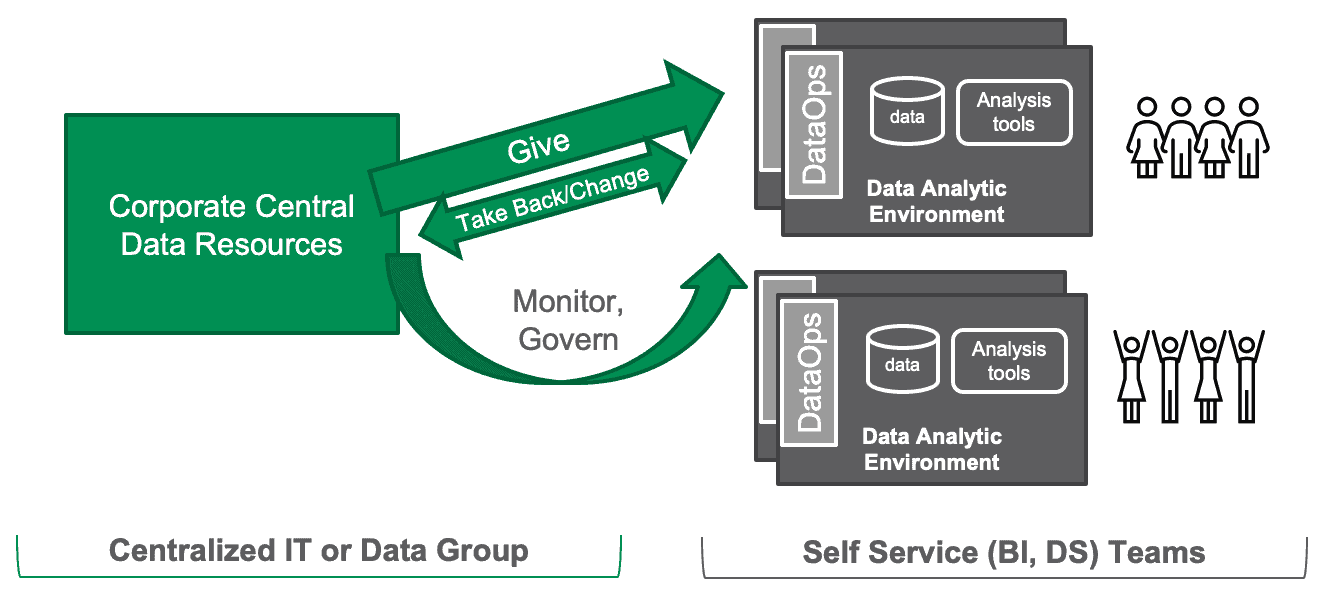
Figure 5: In the figure above, self-service sandbox orchestration with automated governance monitoring is preconfigured by a centralized IT or data group.
Orchestrating Deployment Pipelines
When a development effort doesn’t pan out, the sandbox is deleted. The top sandbox in the Figure 6 below is an example of a one-off experiment that does not advance to production. The middle sandbox does get deployed. The sandbox user invokes an orchestrated sequence of steps which integrates code, tests analytics in an environment built to mirror production and when all tests pass, automatically deploys the analytics into operations. The lower sandbox in the figure above represents a locally-developed analytics solution that is deemed useful to the broader organization. It takes another path to deployment. It is handed off to the central data group who take over responsibility for it. It may be a shared service that is added as a reusable component to future sandboxes.
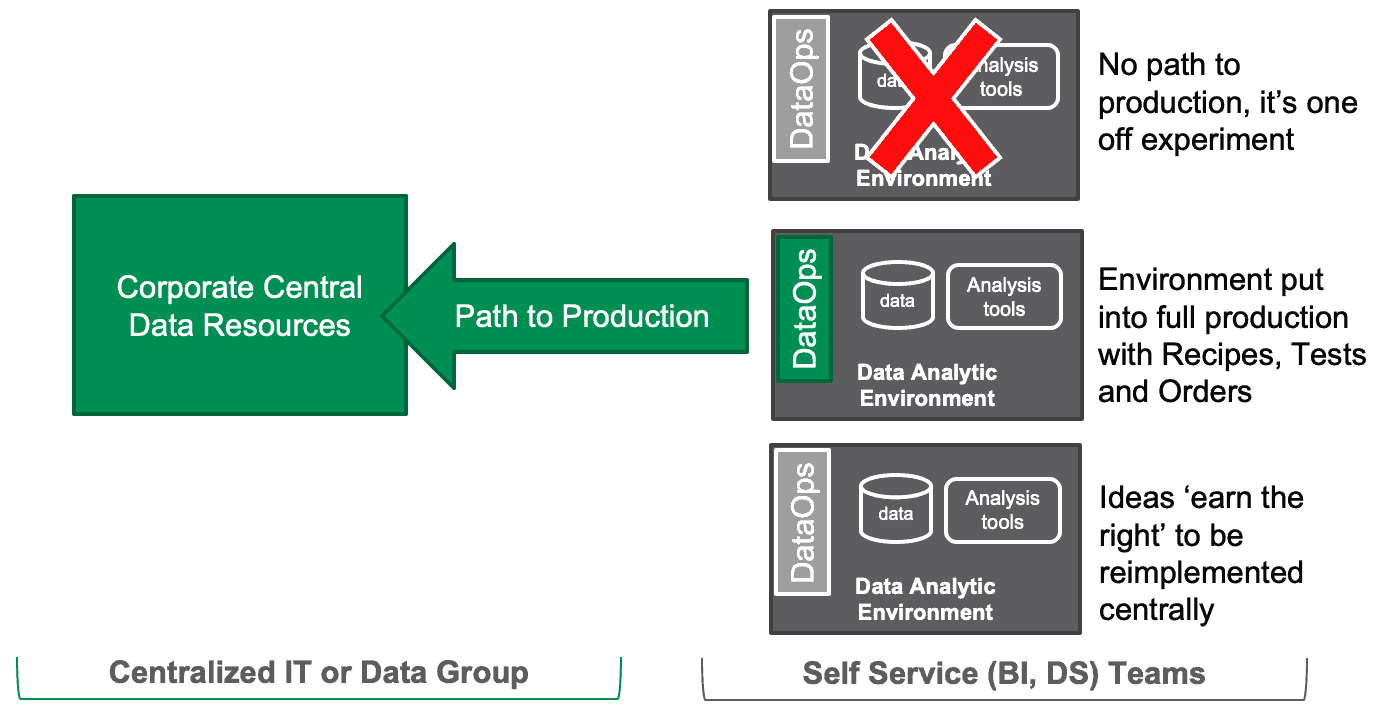
Figure 6: Sandbox development can be abandoned, orchestrated into data operations or migrated to a centralized IT group who add new services to future sandboxes.
Orchestrating Collaboration
Self-service sandboxes can be used effectively to coordinate the activities of distributed groups. Figure 7 shows a multi-cloud or multi-data center pipeline with integration challenges. The home office site in Boston and the self-service site in New Jersey have different personnel, different iteration cadences, different tools and are located far away from each other. Distributed groups like these sometimes fight like warring tribes, yet, they have to provide an integrated analytics solution for the VP of Marketing.
The two groups managing the two halves of the solution have difficulty maintaining quality, coordinating their processes and maintaining independence (modularity). Each group independently tests their portion of the overall system. Do the two disparate testing efforts deliver a unified set of results (and alerts) to all stakeholders? Can their tests evolve independently without breaking each other? These issues repeatedly surface in data organizations.
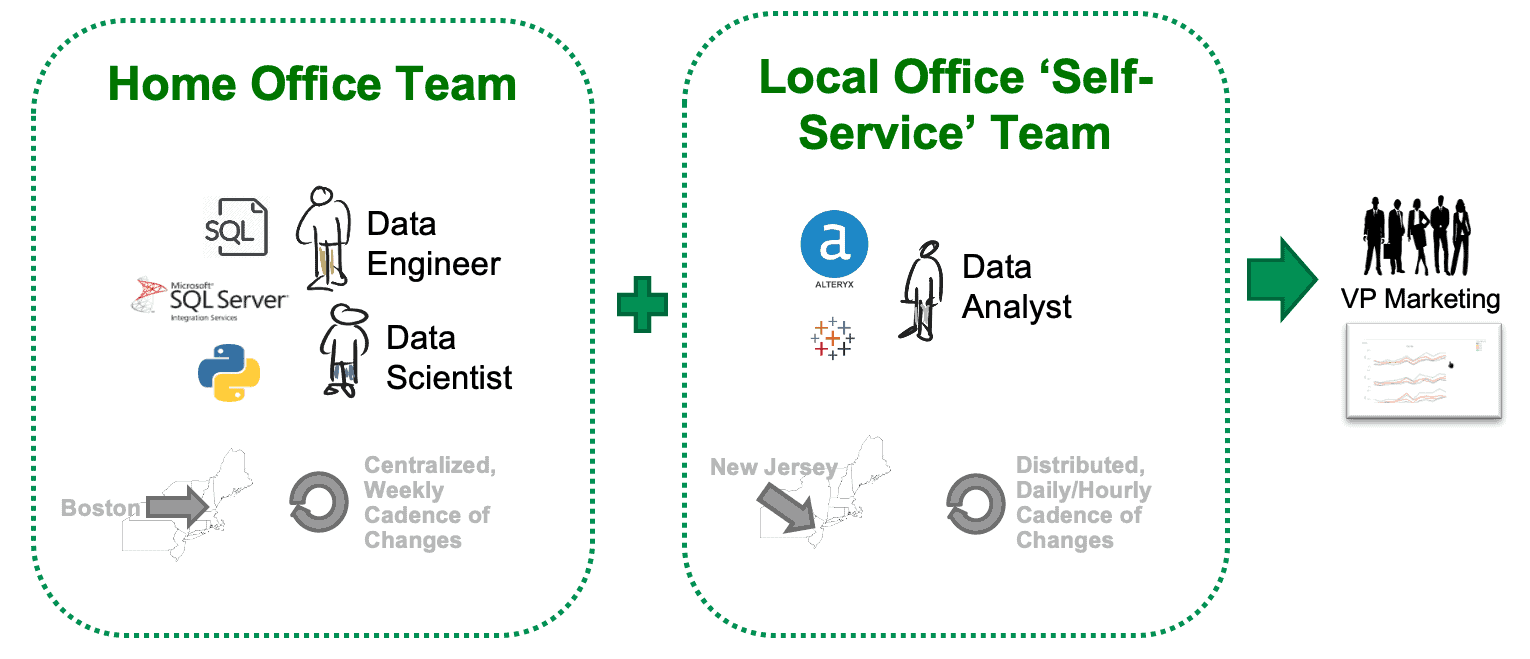
Figure 7: Distributed groups are challenged to coordinate an integrated analytics solution.
Self-service sandboxes and DataOps automation address these difficult challenges. The self-service sandboxes in this environment are built within a seamless orchestration and meta-orchestration framework. The home office team in Boston uses sandboxes built for their own data pipeline (Load, Transform, Calculate, Segment). The self-service team in New Jersey uses sandboxes aligned with their data pipeline (Add Data, Deploy, Publish). The sandboxes deploy analytics enhancements into their respective local data pipelines. The local pipelines are orchestrated by a DataOps Platform such as that supported by DataKitchen.
The meta-orchestration is the top-level pipeline (run-home-ingredient and run-local-ingredient) – perhaps managed by a centralized IT organization – also orchestrated by DataKitchen software. The local teams don’t have to understand the meta-orchestration or the toolchain of the other office. If any part of a local orchestration or meta-orchestrations fails a test, the group responsible is notified and can address it.
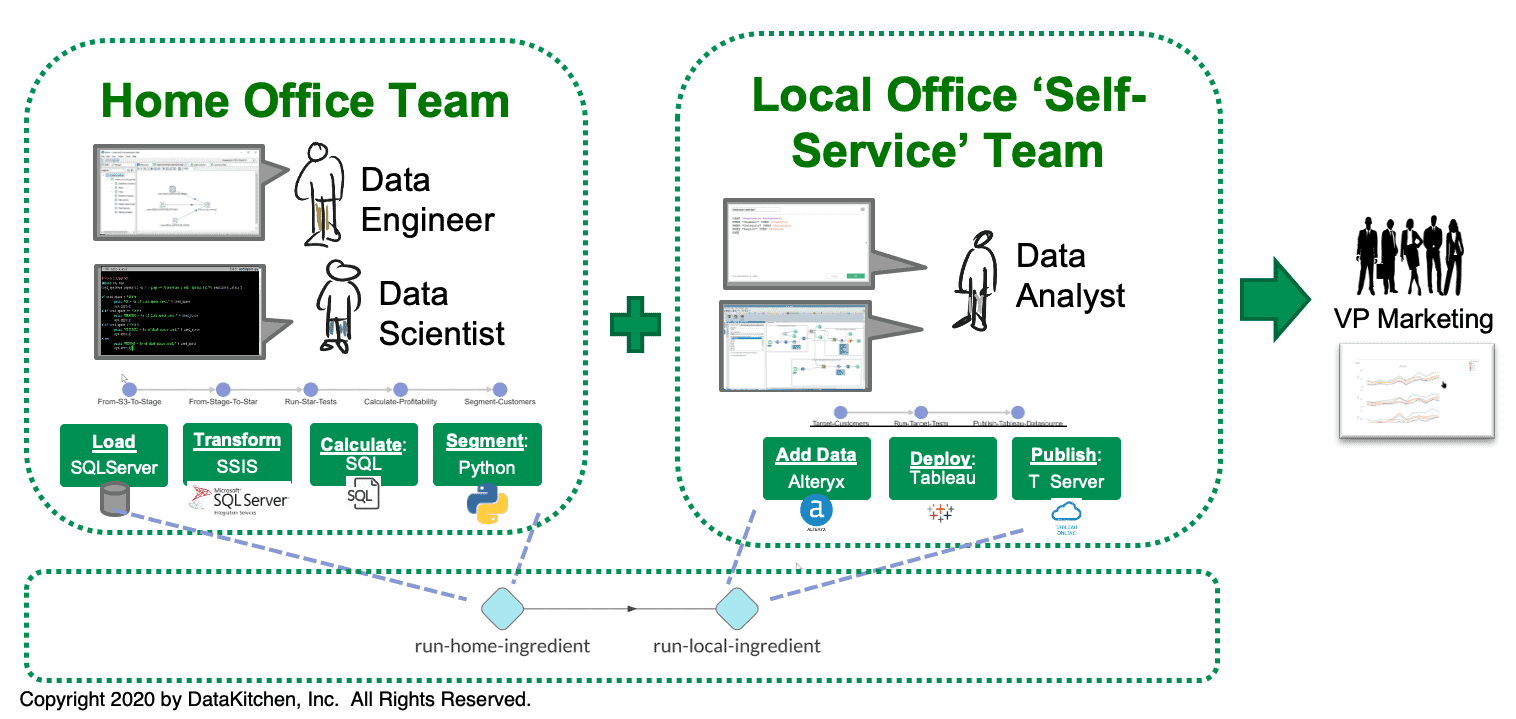
Figure 8: The DataKitchen DataOps Platform orchestrates the local pipelines and meta-orchestrates a top-level pipeline so that the two team efforts are coordinated and integrated.
Orchestrating Operations Pipelines
The meta-orchestration and sandbox model can also be applied to facilitate the collaboration of centralized IT teams with data groups. In Figure 9, we see the Value Pipeline; a data operations pipeline flowing horizontally that takes raw data through production analytics and creates value for the organization.
The enterprise relies upon a centralized IT group to manage the data progressing through the Value Pipeline. This effort includes some Python, SQL and other ETL tools. The centralized IT group is shown with an Innovation Pipeline that flows into the data portion of the Value Pipeline. When there are ideas to add new data sets, the centralized IT group develops and deploys those updates into production.
The analytics that turn that data into value are managed by self-service business intelligence and data science teams. These teams have their own Innovation Pipelines that create and update models, clean and wrangle data and generate reports.
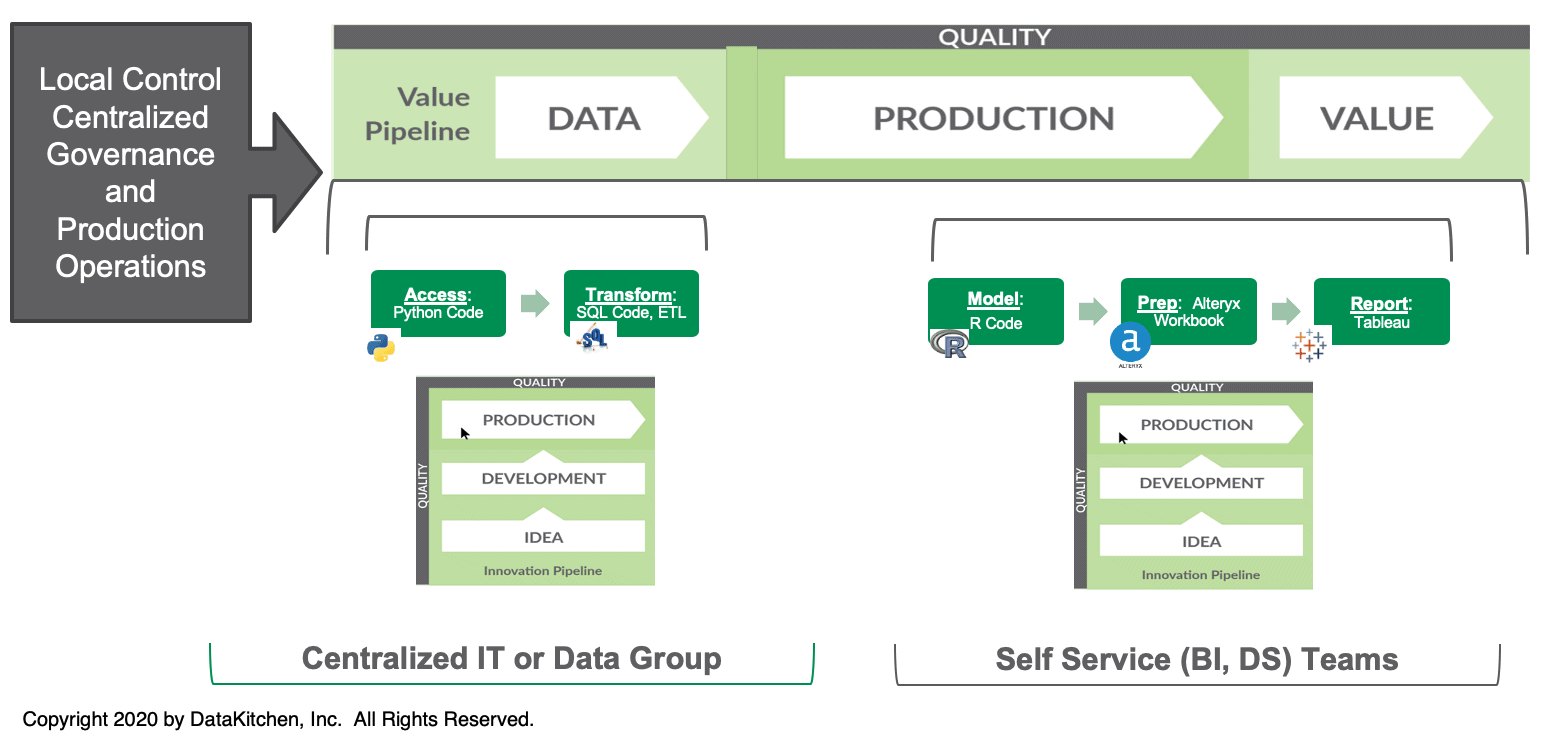
Figure 9: The meta-orchestration and sandbox model can also be applied to facilitate the collaboration of centralized IT teams with data groups.
Every user sandbox is built with continuous deployment orchestrations that enable it to update a specific section of the data operations pipeline. The centralized IT and self-service teams work together yet independently. They can use different cadences and tools. They don’t have to coordinate activities – the meta-orchestration integrates their work and runs tests to ensure quality at each step of the data operations pipeline. DataOps monitors governance in the background for the respective teams.
Innovation Without Compromise
DataOps automation resolves the tension between self-service analytics and governance. It uses self-service sandboxes to enable users to create analytics development environments on demand. These sandboxes help users channel their creativity into new analytics that create value for the enterprise. Sandboxes also tie into orchestrations and meta-orchestrations that help individuals collaborate across locations, data centers, and groups. DataOps delivers all of these benefits while monitoring governance and enforcing policies as part of an automated framework. With DataOps automation, enterprises can take advantage of grass-roots innovation stimulated by self-service analytics without compromising on governance and security.