
Without DataOps, a Bad System Overwhelms Good People
When enterprises invite us in to talk to them about DataOps, we generally encounter dedicated and competent people struggling with conflicting goals/priorities, weak process design, insufficient resources, clashing mindsets, and differing views of reality. Inadequate workflow processes prevent them from doing their best work. The team lacks the structural and contextual support necessary to enable successful teamwork.
Imagine that a Vice President of Marketing makes an urgent request to the data analytics team: “I need new data on profitability ASAP.” At many organizations the process for creating and deploying these new analytics would go something like this:
- The new requirement falls outside the scope of the development “plan of record” for the analytics team. Changing the plan requires departmental meetings and the approval of a new budget and schedule. Meetings ensue.
- Padma, a Data Engineer, requests access to new data. The request goes on the IT backlog. IT grants access after several weeks.
- Padma writes a functional specification and submits the proposed change to the Impact Review Board (IRB), which meets monthly. A key-person is on vacation, so the proposed feature waits another month.
- Padma begins implementation. The change that she is making is similar to another recently developed report. Not knowing that, she writes the new analytics from scratch. The test environment does not match “production.” so her testing misses some corner cases.
- Testing on the target environment begins. High-severity errors pull Eric, a Production Engineer, into an “all-hands-on-deck” situation, putting testing temporarily on hold.
- Once the fires are extinguished, Eric returns to testing on the target and uncovers some issues in the analytics. Eric feeds error reports back to Padma. She can’t easily reproduce the issues because the code doesn’t fail in the “dev” environment. She spends significant effort replicating the errors so she can address them. The cycle is repeated a few times until the analytics are debugged.
- Analytics are finally ready for deployment. Production schedules the update. The next deployment window available is in three weeks.
- After several months have elapsed (total cycle time), the VP of Marketing receives the new analytics, wondering why it took so long. This information could have boosted sales for the current quarter if it had been delivered when she had initially asked.
Every organization faces unique challenges, but the issues above are ubiquitous. The situation we described is not meeting anyone’s needs. Data engineers went to school to learn how to create analytic insights. They didn’t expect that it would take six months to deploy twenty lines of SQL. The process is a complete hassle for IT. They have to worry about governance and access control and their backlog is entirely unmanageable. Users are frustrated because they wait far too long for new analytics. We could go on and on. No one here is enjoying themselves.
The frustration sometimes expresses itself as conflict and stress. From the outside, it looks like a teamwork problem. No one gets along. People are rowing the boat in different directions. If managers want to blame someone, they will point at the team leader.
At this point, a manager might try beer, donuts and trust exercises (hopefully not in that order) to solve the “teamwork issues” in the group. Another common mistake is to coach the group to work more slowly and carefully. This thinking stems from the fallacy that you have to choose between quality and cycle time. In reality, you can have both.
We recommend a process-oriented solution that addresses everyone’s goals and priorities, coordinates tasks, provisions resources, and creates a shared reality. DataOps can turn a band of squabbling data professionals into a high-performance team.
DataOps Improves Teamwork
DataOps shortens the cycle time and improves the quality of data analytics. Data teams that do not use DataOps may try to reduce the number of errors by being more cautious and careful. In other words, slowing down. DataOps helps organizations improve data quality while going faster. This might seem impossible until you learn more about how DataOps approaches analytics development and deployment.
DataOps is a set of methodologies supported by tools and automation. To say it in one breath; think Agile development, DevOps and Lean manufacturing (i.e., statistical process controls) applied to data analytics. DataOps comprehends that enterprises live in a multi-language, multi-tool, heterogeneous environment with complex workflows. To implement DataOps, extend your existing environment to align with DataOps principles. You can implement DataOps by yourself in seven steps, or you can adopt a DataOps Platform. Here, we’ll describe how a DataOps Platform works and illustrate it with an example of a real-life analytics development project.
DataOps Job #1: Abstracting, Separating, and Aligning Release Environments
Enterprises that collocate development and production on the same system face a number of issues. Analytics developers sometimes make changes that create side effects or break analytics. Development can also be processor-intensive, impacting production performance and query response time.
DataOps provides production and development with dedicated system environments. Some enterprises take this step but fail to align these environments. Development uses cloud platforms while production uses on-prem. Development uses clean data while production uses real-world data. The list of opportunities for misalignment are endless. DataOps requires that system environments be aligned. In other words, as close as possible to identical. The more similar, the easier it will be to migrate code and replicate errors. Some divergence is necessary. For example, data given to developers may have to be sampled or masked for practical or governance reasons.
Figure 1 below shows a simplified production environment. The system transfers files securely using SFTP. It stores files in S3 and utilizes a Redshift cluster. It also uses Docker containers and runs some Python. Production alerts are forwarded to a Slack channel in real-time. Note that we chose an example based on Amazon Web Services, but we could have selected any other tools. Our example applies whether the technology is Azure, GCP, on-prem or anything else.
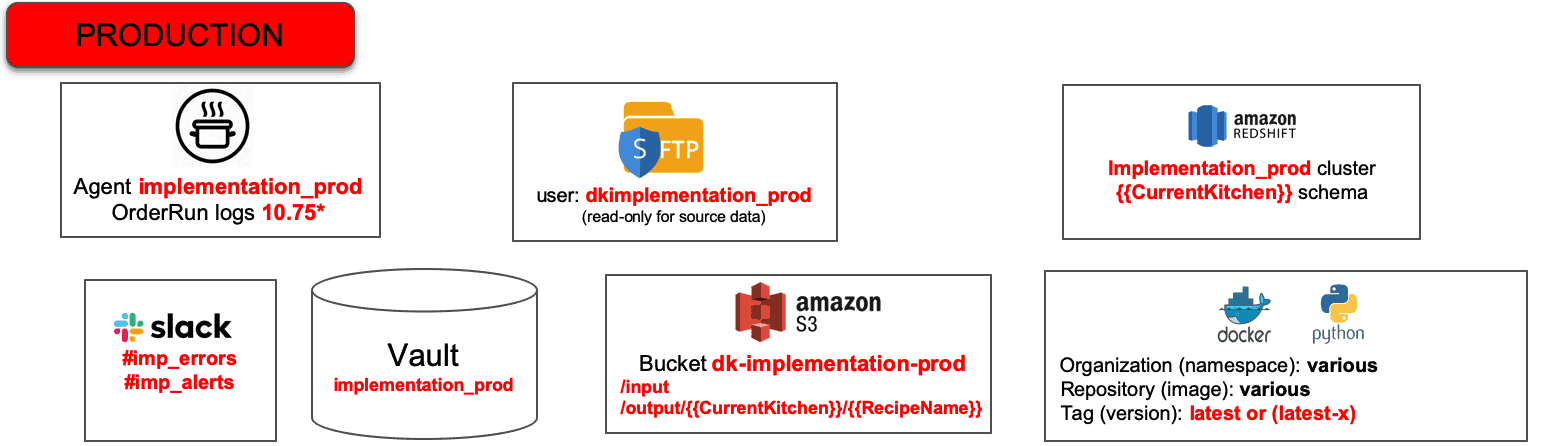
Figure 1: Simplified production technical environment
DataOps segments production and development into separate release environments — see Figure 2. In our parlance, a release environment includes a set of hardware resources, a software toolchain, data, and a security Vault which stores encrypted, sensitive access control information like usernames and passwords for tools. Our production engineer, Eric, manages the production release environment. Production has dedicated hardware and software resources so Eric can control performance, quality, governance and manage change. The production release environment is secure — the developers do not have access to it.
The development team receives its own separate but equivalent release environment, managed by the third important member of our team; Chris, a DataOps Engineer. Chris also implements the infrastructure that abstracts the release environments so that analytics move easily between dev and production. We’ll describe this further down below. Any existing team member, with DataOps skills, can perform the DataOps engineering function, but in our simplified case study, adding a person will better illustrate how the roles fit together.
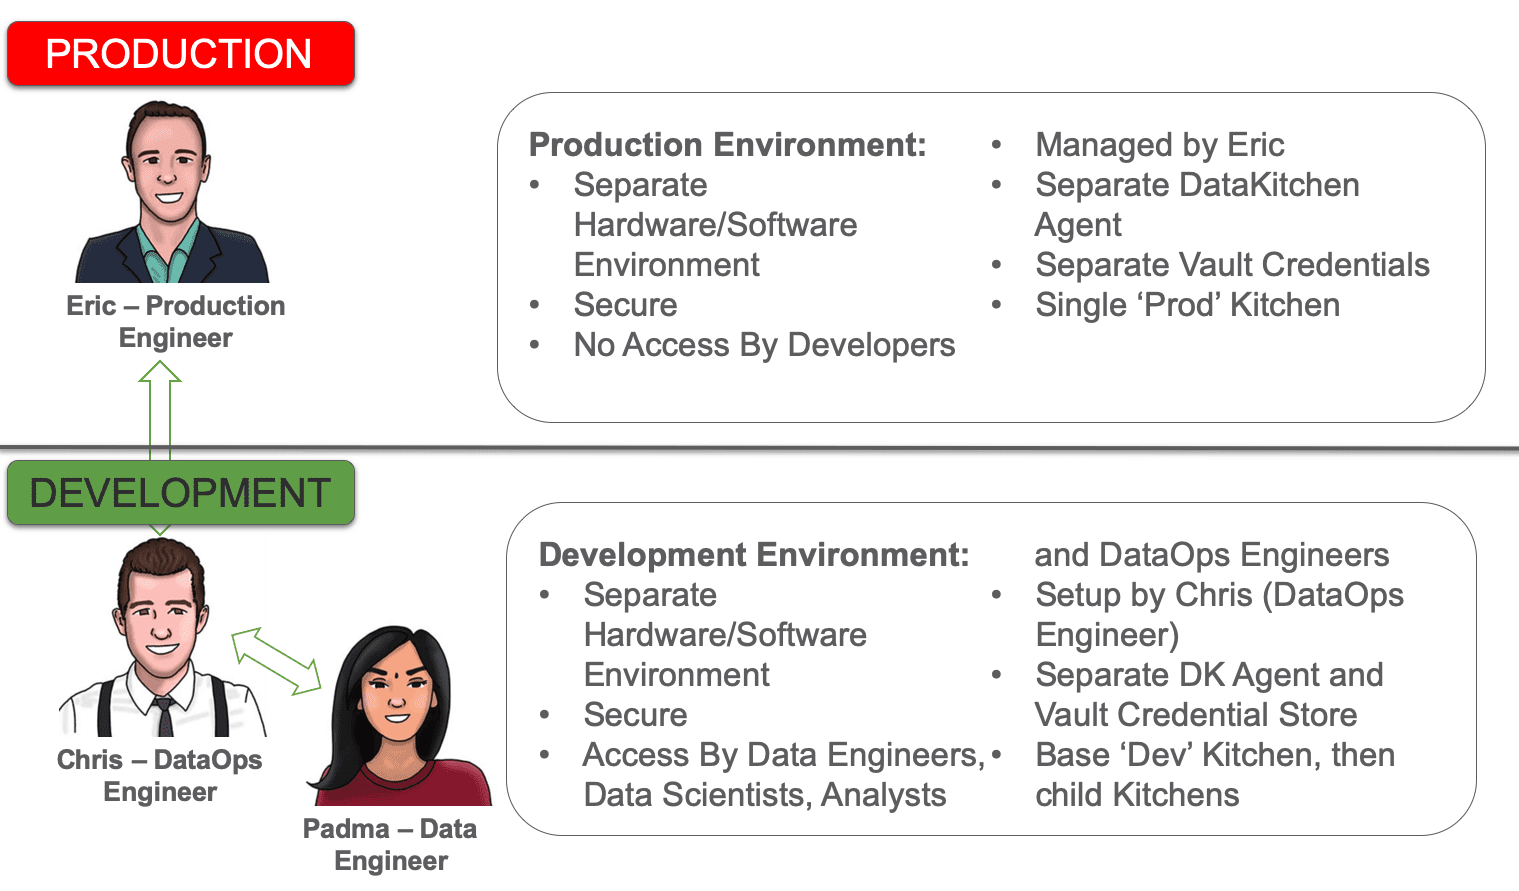
Figure 2: Production and development maintain separate but equivalent environments. The production engineer manages the production release environment and the DataOps engineer manages the development release environment.
Chris creates a development release environment that matches the production release environment. This alignment reduces issues when migrating analytics from development to production. Per Figure 2, the development environment has an associated security Vault, just like the production environment. When a developer logs into a development workspace, the security Vault provides credentials for the tools in the development release environment. When the code seamlessly moves to production, the production Vault supplies credentials for the production release environment.
Figure 3 below illustrates the separate but equivalent production and development release environments. If you aren’t familiar with “environments,” think of these as discrete software and hardware systems with equivalent configuration, tools, and data.
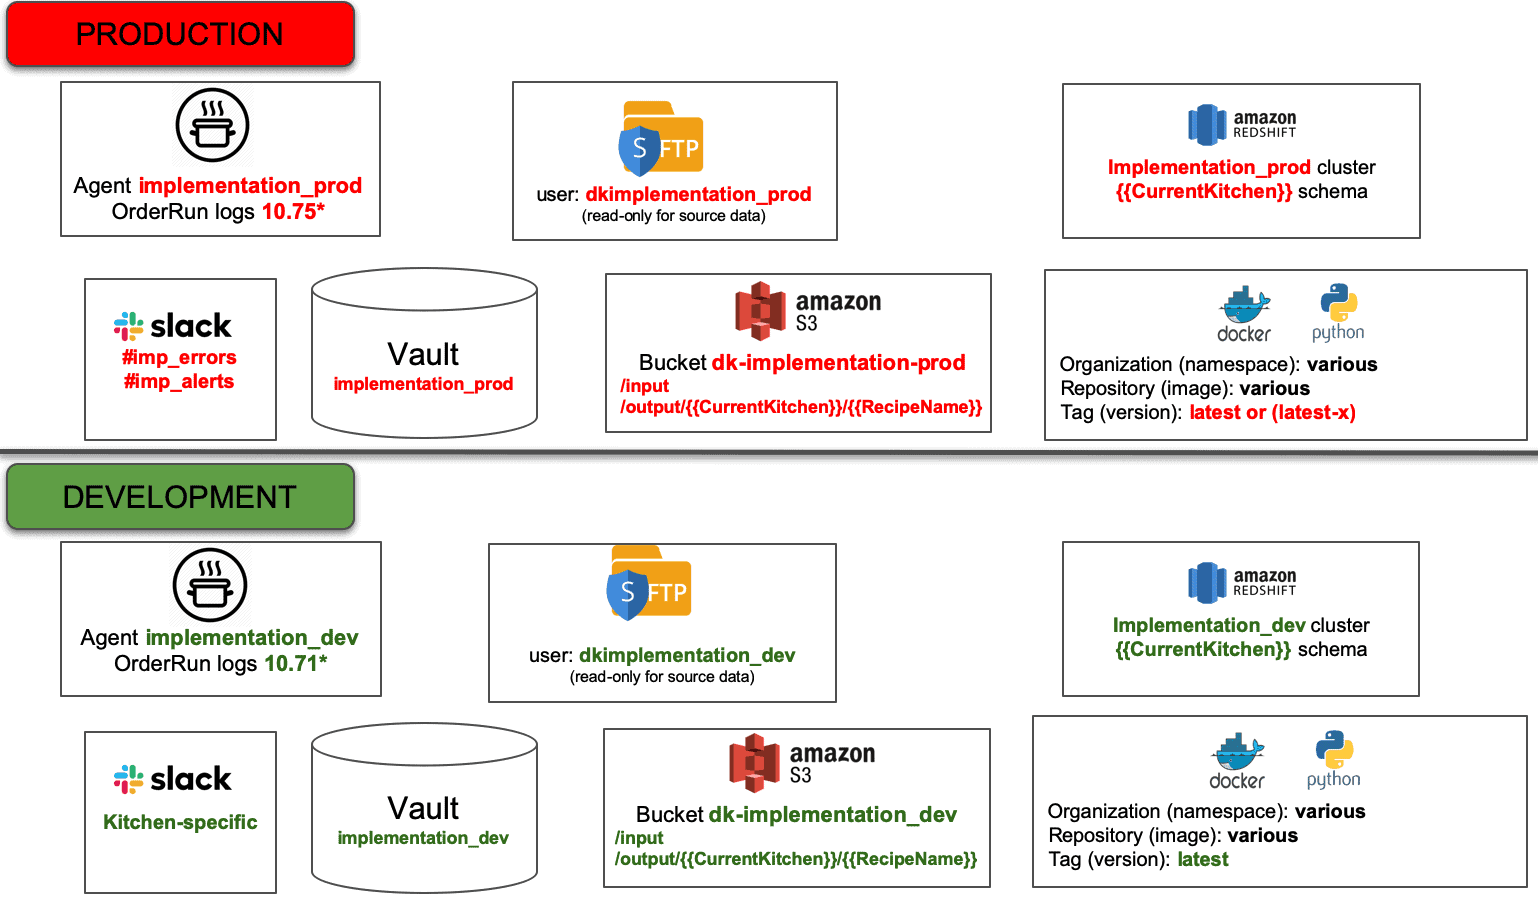
Figure 3: DataOps segments the production and development workspaces into separate but equivalent release environments.
Chris uses DataOps to create and implement the processes that enable successful teamwork. This activity puts him right at the nexus between data-analytics development and operations. Chris is one of the most important and respected members of the data team. He creates the mechanisms that enable work to flow seamlessly from development to production. Chris makes sure that environments are aligned and that everyone has the hardware, software, data, network and other resources that they need. He also makes available software components, created by team members, to promote reuse — a considerable multiplier of productivity. In our simple example, Chris manages the tasks that comprise the pre-release process. Padma appreciates having Chris on the team because now she has everything that she needs to create analytics efficiently on a self-service basis. Eric is happy because DataOps has streamlined deployment, and expanded testing has raised both data and analytics quality. Additionally, there is much greater visibility into the artifacts and logs related to analytics, whether in development, pre-release or in production. It’s clear that Chris is a key player in implementing DataOps. Let’s dive deeper into how it really works.
A DataOps “Kitchen”: A Release Environment, Workspace, and Pipeline Branch
Our development team in Figure 2 consists of Chris and Padma. In a real-world enterprise, there could be dozens or hundreds of developers. DataOps helps everyone work as a team by minimizing the amount of rekeying required so that analytics move seamlessly from developer to developer and into production. DataOps also organizes activities so that tasks remain coordinated and team members stay aligned. The foundation of these synchronized activities is a virtual workspace called a “Kitchen.”
A Kitchen is a development workspace with everything that an analytics developer requires. It contains hardware, software, tools, code (with version control) and data. A Kitchen points to a release environment which gives it access to all of the resources associated with that environment. A Kitchen also enforces workflow and coordinates tasks.
The processing pipelines for analytics consist of a series of steps that operate on data and produce a result. We use the term “Pipeline” to encompass all of these tasks. A DataOps Pipeline encapsulates all the complexity of these sequences, performs the orchestration work, and tests the results. The idea is that any analytic tool that is invokable under software control can be orchestrated by a DataOps Pipeline. Kitchens enable team members to access, modify and execute workflow Pipelines. A simple Pipeline is shown in Figure 4.
Pipelines, and the components that comprise them, are made visible within a Kitchen. This encourages the reuse of previously developed analytics or services. Code reuse can be a significant factor in reducing cycle time.
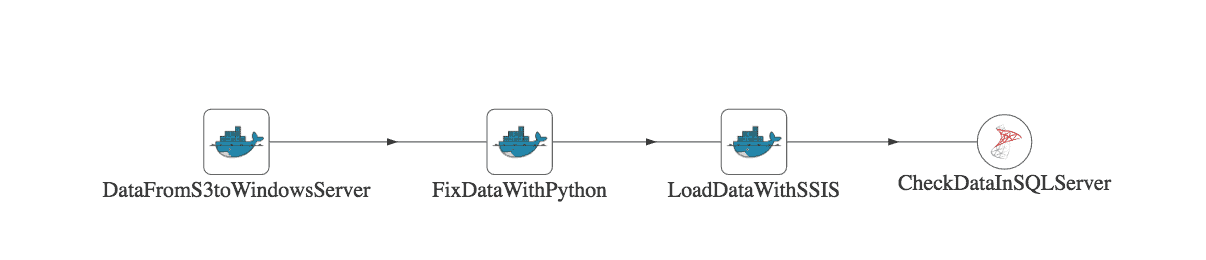
Figure 4: A simple DataOps pipeline is represented by a directed acyclic graph (DAG). Each node in the graph is a sequence of orchestrated operations.
Kitchens also tightly couple to version control. When the development team wants to start work on a new feature, they instantiate a new child Kitchen which creates a corresponding Git branch. When the feature is complete, the Kitchen is merged back into its parent Kitchen, initiating a Git merge. The Kitchen hierarchy aligns with the source control branch tree. Figure 5 shows how Kitchen creation/deletion corresponds to a version control branch and merge.
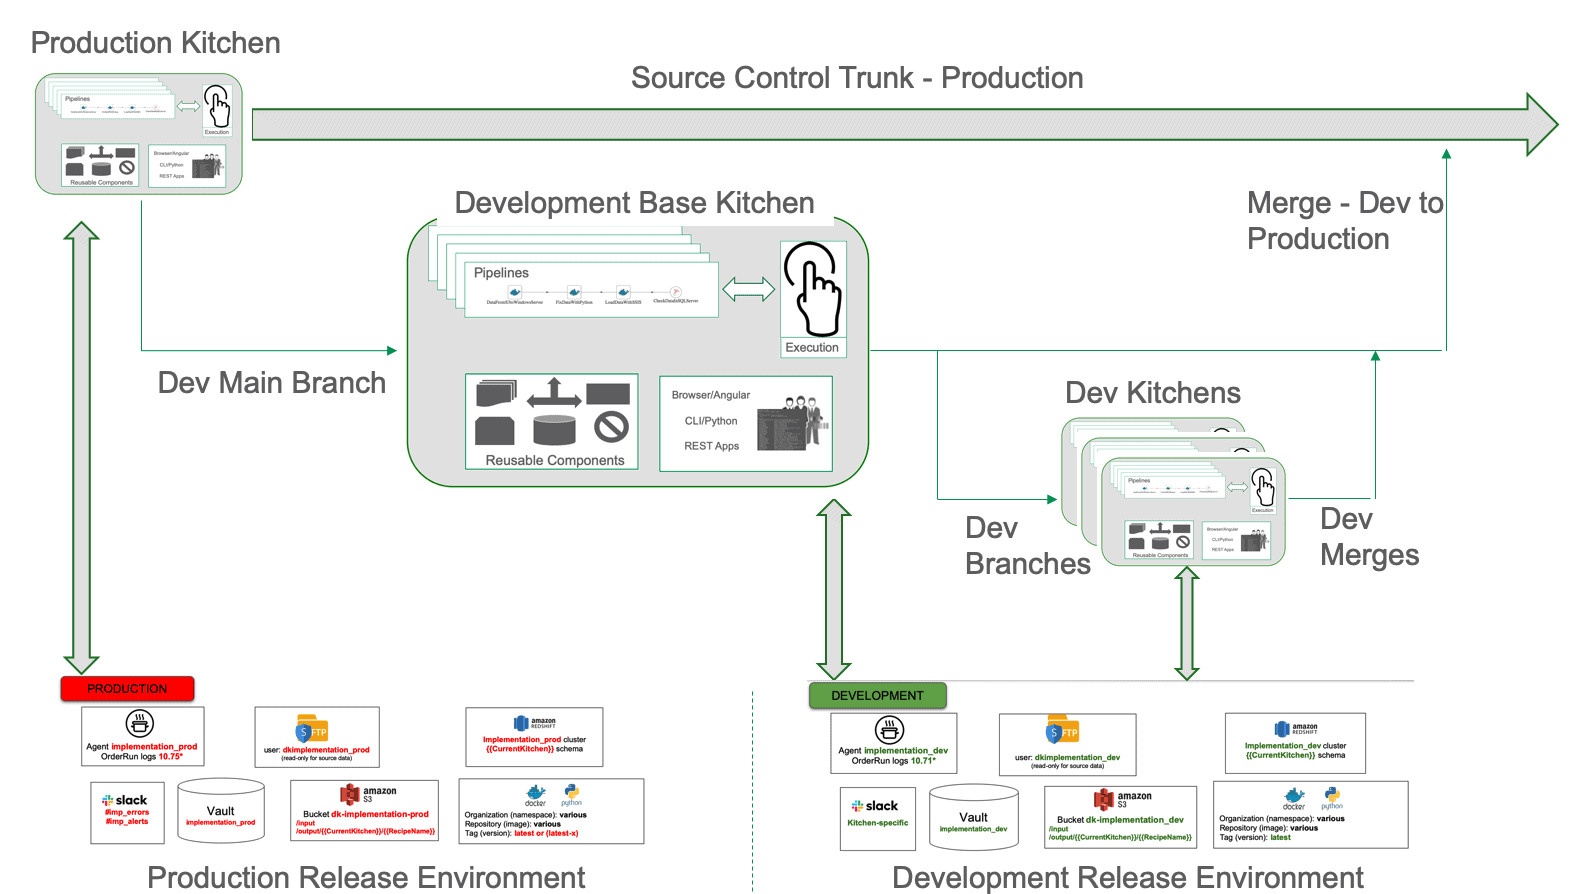
Figure 5: Kitchens point to a release environment. They represent source control branches and merges, and also serve as development, test, and release workspaces.
Kitchens may be persistent or temporary; they may be private or shared, depending on the needs of a project. Access to a Kitchen is limited to a designated set of users or “Kitchen staff.” The Vault in a release environment supplies a Kitchen with the set of usernames and passwords needed to access the environment toolchain.
DataOps empowers an enterprise to provide people access to data, eliminating gatekeepers. As mentioned above, developers access test data from within a Kitchen. In another example, a Pipeline could extract data from a data lake and create a data mart or flat file that serves Alteryx, Tableau and Excel users in the business units. DataOps promotes and enables data democratization , providing everyone access to the data relevant to their job. When “ self-service” replaces “gatekeepers,” more work gets done in parallel and analytics development cycle-time accelerates significantly.
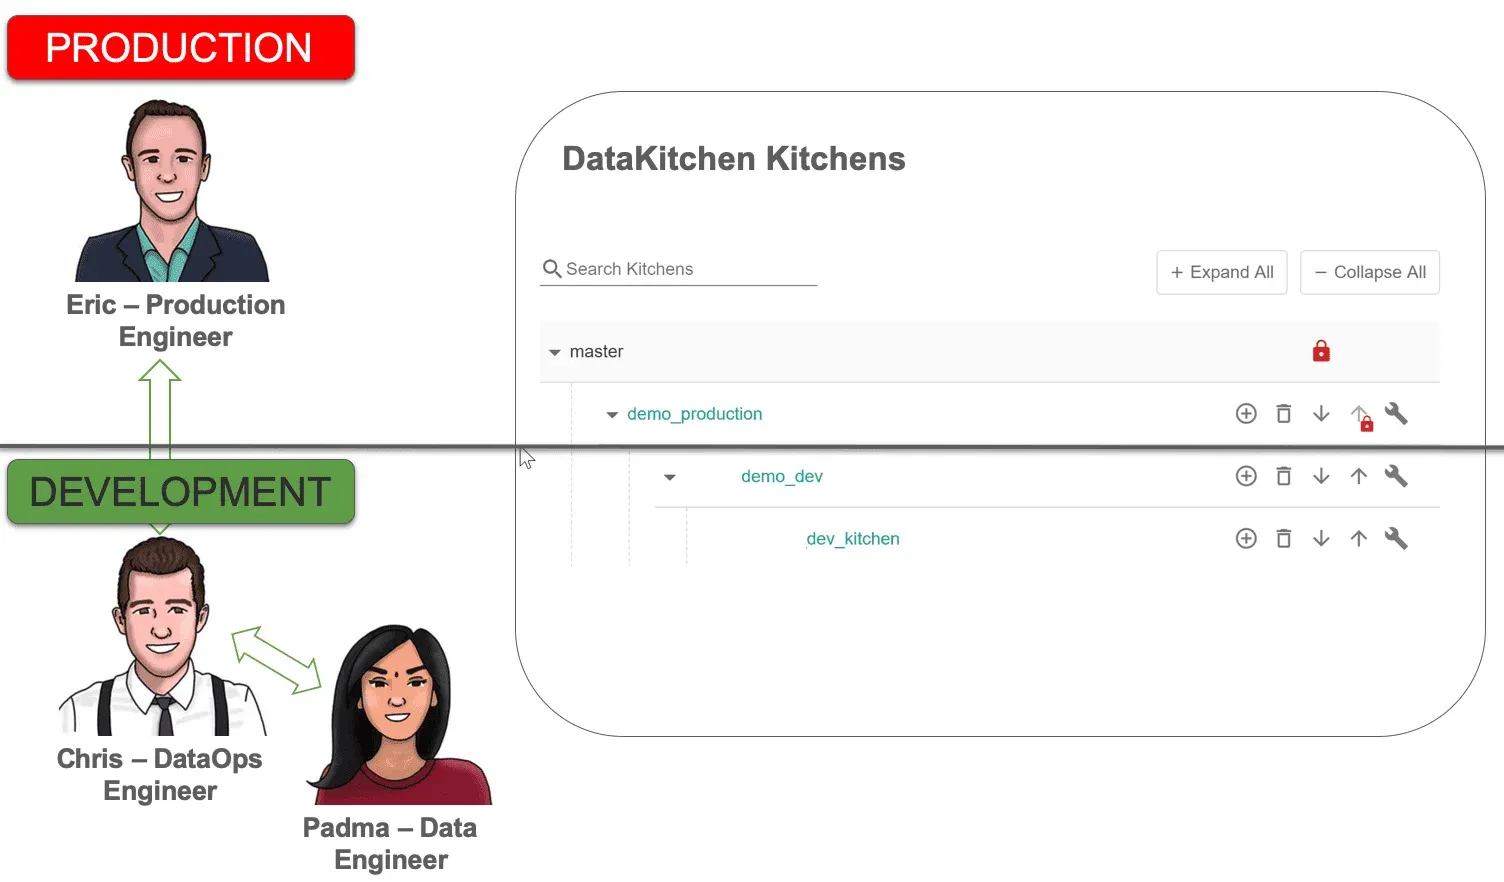
Figure 6: Eric, Chris, and Padma each have personal Kitchens, organized in a hierarchy that aligns with their workflow.
Figure 6 above shows a Kitchen hierarchy. The base Kitchen is “demo_production,” which points to the production release environment described earlier. This Kitchen is Eric’s workspace, and it enables him to coordinate his interactions with the development team. There is only one Kitchen corresponding to Eric’s production release environment. No iterative work takes place in production. Instead, think of “demo_production” as a manufacturing flow where assembly lines run on a tight schedule.
Chris’ workspace is a Kitchen called “demo_dev.” The “demo_dev” Kitchen is the baseline development workspace, and it points to the development release environment introduced above, at the bottom of Figure 2. In our example, Chris’ Kitchen serves as a pre-release staging area where merges from numerous child development Kitchens consolidate and integrate before being deployed to production. With release environments aligned, Kitchens don’t have to do anything different or special for merges across release environments versus merges within a release environment.
Every developer needs a workspace so they may work productively without impacting or being impacted by others. A Kitchen can be persistent, like a personal workspace, or temporary, tied to a specific project. Once Kitchen creation is set-up, team members create workspaces as needed. This “self-service” aspect of DataOps eliminates the time that developers used to wait for systems, data, or approvals. DataOps empowers developers to hit the ground running. In Figure 6, Padma has created the Kitchen “dev_kitchen.” Padma’s Kitchen can leverage Pipelines and other services created by the dev team.
DataOps Segregates User Activity
With multiple developers sharing a release environment, the DataOps Platform segregates developer activity. For example, all of the developer Kitchens share the Redshift cluster shown in Figure 2. Note the notation “{{CurrentKitchen}}” associated with Redshift in Figure 2. Each developer has a Redshift schema within the cluster identified by their Kitchen name. For example, an access by Padma would target a schema identified by her unique Kitchen name “dev_kitchen.” The DataOps Platform uses Kitchen names and other identifiers to segregate user activity within a shared release environment. Segregation helps keep everyone’s work isolated while sharing development resources.
A DataOps Process
Now let’s look at how to use a DataOps Platform to develop and deliver analytics with minimal cycle time and unsurpassed quality. We’ll walk through an example of how DataOps helps team members work together to deploy analytics into production.
Think back to the earlier request by the VP of Marketing for “new analytics.” DataOps coordinates this multi-step, multi-person and multi-environment workflow and manages it from inception to deployment.
Step 1 — Starting From a Ticket
The Agile Sprint meeting commits to the new feature for the VP of Marketing in the upcoming iteration. The project manager creates a JIRA ticket.
Step 2 — Creation of the Development Kitchen
In a few minutes, Padma creates a development Kitchen for herself and gets to work. Chris has automated the creation of Kitchens to provide developers with the test data, resources, and Git branch that they need. Padma’s Kitchen is called “dev_Kitchen” (see Figure 6). If Padma takes a technical risk that doesn’t work out, she can abandon this Kitchen and start over with a new one. That effectively deletes the first Git branch and starts again with a new one.
Step 3 — Implementation
Padma’s Kitchen provides her with pipelines that serve as a significant head start on the new profitability analytics. Padma receives the test data (de-identified) she needs as part of Kitchen creation and configures toolchain access (SFTP, S3, Redshift, …) for her Kitchen. Padma implements the new analytics by modifying an existing Pipeline. She adds additional tests to the existing suite, checking that incoming data is clean and valid. She writes tests for each stage of ETL/processing to ensure that the analytics are working from end to end. The tests verify her work and will also run as part of the production flow. Her new pipelines include orchestration of the data and analytics as well as all tests. The tests direct messages and alerts to her Kitchen-specific Slack channel. With the extensive testing, Padma knows that her work will migrate seamlessly into production with minimal effort on Eric’s part. Now that release environments have been aligned, she’s confident that her analytics work in the target environment.
Before she hands off her code for pre-production staging, Padma first has to merge down from “demo_dev” Kitchen so that she can integrate any relevant changes her coworkers have made since her branch. She reruns all her tests to ensure a clean merge. If there is a conflict in the code merge, the DataOps Platform will pop-up a three panel UI to enable further investigation and resolution. When Padma is ready, she updates and reassigns the JIRA ticket. If the data team were larger, the new analytics could be handed off from person to person, in a line, with each person adding their piece or performing their step in the process.
Step 4 — Pre-Release
In our simple example, Chris serves as the pre-release engineer. With a few clicks, Chris merges Padma’s Kitchen “dev_Kitchen” back into the main development Kitchen “demo_dev,” initiating a Git merge. After the merge, the Pipelines that Padma updated are visible in Chris’ Kitchen. If Chris is hands-on, he can review Padma’s work, check artifacts, rerun her tests, or even add a few tests of his own, providing one last step of QA or governance. Chris creates a schedule that, once enabled, will automatically run the new Pipeline every Monday at 6 am. When Chris is satisfied, he updates and reassigns the JIRA ticket, letting Eric know that the feature is ready for deployment.
Step 5 — Production Deployment
Eric easily merges the main development Kitchen “demo_dev” into the production Kitchen, “demo_production,” corresponding to a Git merge. Eric can now see the new Pipelines that Padma created. He inspects the test logs and reruns the new analytics and tests to be 100% sure. The release environments match so the new Pipelines work perfectly. He’s also happy to see tests verifying the input data using DataOps statistical process control. Tests will detect erroneous data, before it enters the production pipeline. When he’s ready, Eric enables the schedule that Chris created, integrating the new analytics into the operations pipeline. DataOps redirects any Slack messages generated by the new analytics to the production Slack channels.
Step 6 — Customer Sees Results
The VP of Marketing sees the new customer segmentation and she’s delighted. She then has an epiphany. If she could see this new data combined with a report that Padma delivered last week, it could open up a whole new approach to marketing — something that she is sure the competitors haven’t discovered. She calls the analytics team and…back to Step 1.
DataOps Benefits
As our short example demonstrated, the DataOps Teamwork Process delivers these benefits:
- Ease movement between team members with many tools and environments — Kitchens align the production and development environment(s) and abstract the machine, tools, security and networking resources underlying analytics. Analytics easily migrate from one team member to another or from dev to production. Kitchens also bind changes to source control.
- Collaborate and coordinate work — DataOps provides teams with the compelling direction, strong structure, supportive context and shared mindset that are necessary for effective teamwork.
- Automate Work and Reduce errors — Automated orchestration reduces process variability and errors resulting from manual steps. Input, output and business logic tests at each stage of the workflow ensure that analytics are working correctly, and that data is within statistical limits. DataOps runs tests both in development and production, continuously monitoring quality. Warnings and errors are forwarded to the right person/channel for follow up.
- Maintain security — Kitchens are secured with access control. Kitchens then access a release environment toolchain using a security Vault which stores unique usernames/passwords.
- Leverage best practices and re-use — Kitchens include Pipelines and other reusable components which data engineers can leverage when developing new features.
- Self-service — Data professionals can move forward without waiting for resources or committee approval.
- Data democratization — Data can be made available to more people, even users outside the data team, who bring contextual knowledge and domain expertise to data-analytics initiatives. “Self-service” replaces “gatekeepers” and everyone can have access to the data that they need.
- Transparency — Pipeline status and statistics are available in messages, reports and dashboards.
Smooth Teamwork With DataOps
DataOps addressed several technical and process-oriented bottlenecks that previously delayed the creation of new analytics for months. Their processes can improve further, but they are now an order of magnitude faster and more reliable. At the next staff meeting, the mood of the team is considerably improved:
Manager: Good morning, everyone. I’m pleased to report that the VP of Marketing called the CDO thanking him for a great job on the analytics last week.
Padma (Data Engineer): Fortunately, I was able to leverage a Pipeline developed a few months ago by the MDM team. We were even able to reuse most of their tests.
Chris (DataOps Engineer): Once I set-up Kitchen creation, Padma was able to start being productive immediately. With matching release environments, we quickly migrated the new analytics from dev to production.
Eric (Production Engineer): The tests are showing that all data remains within statistical limits. The dashboard indicators are all green.
DataOps helps our band of frustrated and squabbling data professionals achieve a much higher level of overall team productivity by establishing processes and providing resources that support teamwork. With DataOps, two key performance parameters improve dramatically — the development cycle time of new analytics and quality of data and analytics code. We’ve seen it happen time and time again.
What’s even more exciting is the business impact of DataOps. When users request new analytics and receive them in a timely fashion, it initiates new ideas and uncharted areas of exploration. This tight feedback loop can help analytics achieve its true aim, stimulating creative solutions to an enterprise’s greatest challenges. Now that’s teamwork!