
Scaling Data Reliability: The Definitive Guide to Test Coverage for Data Engineers
The parallels between software development and data analytics have never been more apparent. Just as software teams would never dream of deploying code that has only been partially tested, data engineering teams must adopt comprehensive testing strategies to ensure the reliability, accuracy, and trustworthiness of their data products. This comprehensive guide explores the fundamental principles of test coverage in data and analytics systems, providing practical frameworks and strategies for implementing robust testing practices.
Let us show you how to implement full-coverage automatic data checks on every table, column, tool, and step in your delivery process. And how you can create 1000s of tests in a minute using open source tools.
Would you like to watch this as a webinar? Click Here
Not Just Software, But You’re Also Running Data Manufacturing
It’s not just software development that parallels data analytics, but manufacturing production. Data analytics processes fundamentally resemble manufacturing operations, where raw materials transform to produce refined outputs. In this context, data serves as the raw material, while the production outputs include refined datasets, visualizations, models, and reports. The analytic pipeline encompasses multiple stages, including data access through Python code, transformation via SQL and ETL processes, modeling using R or Python, visualization with tools like Tableau, and final reporting via various business intelligence platforms.
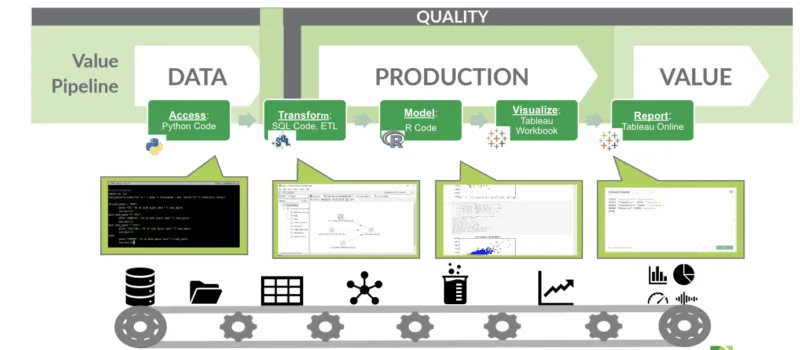
This manufacturing perspective highlights a critical truth: just as quality control is essential in manufacturing to prevent defective products from reaching customers, comprehensive testing is vital in data analytics to prevent erroneous insights from reaching business stakeholders. The consequences of inadequate testing can be severe, ranging from misguided business decisions to damaged customer relationships and regulatory compliance issues.
The Dual Challenge of Production and Development Testing
Test coverage in data and analytics operates across two distinct but interconnected dimensions: production testing and development testing. Production test coverage ensures that data quality remains high and error rates remain low throughout the value pipeline during live operations. Development test coverage provides confidence that changes made during the innovation pipeline will not break existing functionality when promoted to production.
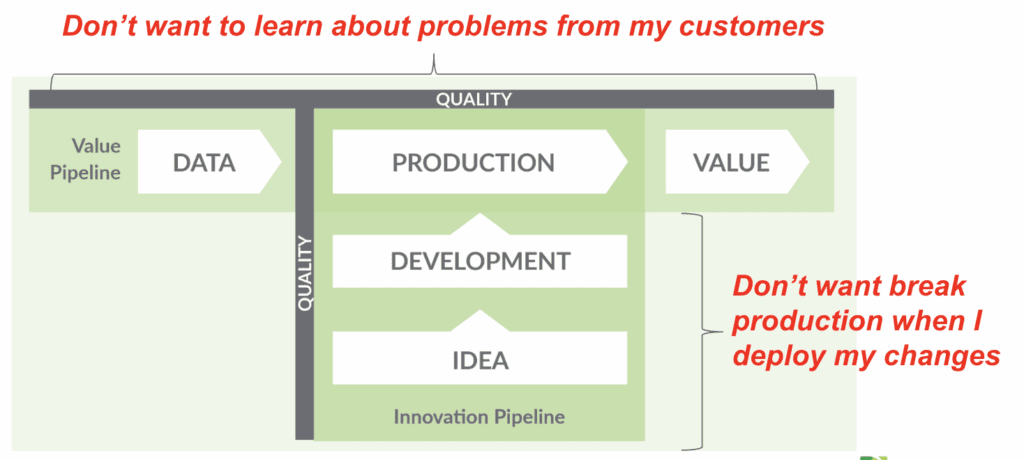
This dual nature creates an interesting dynamic where many tests serve double duty, functioning both as production monitors and development validators. Production testing focuses on maintaining data quality in live systems, while development testing ensures that new code changes do not introduce regressions or break existing functionality.
Shifting Left and Shifting Down
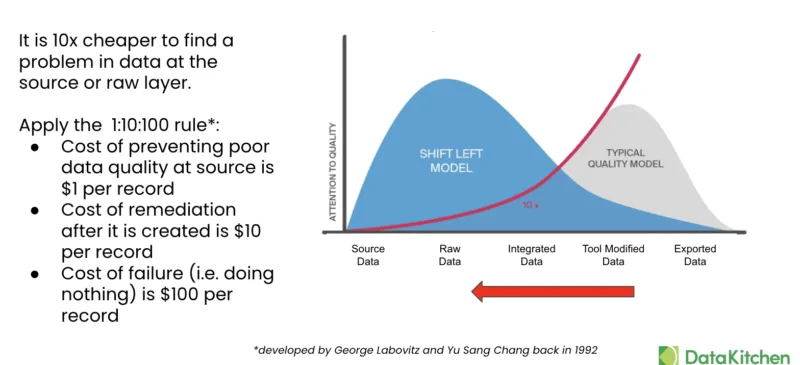
Two critical concepts underpin effective test coverage strategies: shifting left and shifting down. Shifting left involves executing data quality tests earlier in the data pipeline lifecycle, ensuring that issues are identified and resolved before they propagate downstream. This approach dramatically reduces the cost and complexity of addressing data quality issues.

Shift Left And Shift Down For Success
Shifting down emphasizes the use of integration and end-to-end testing methodologies, validating not just isolated components but also the interactions and cumulative impacts within the entire data ecosystem. This comprehensive approach ensures that the system functions correctly as a whole, not just in individual components.
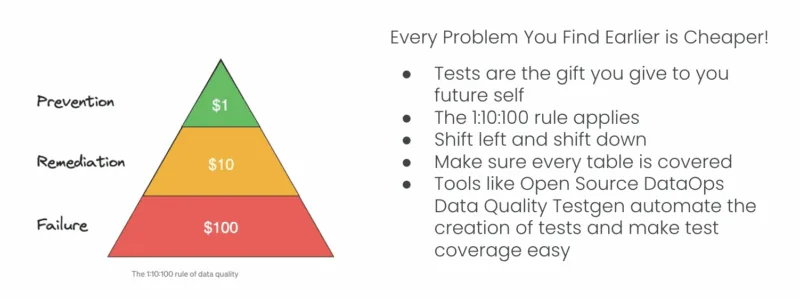
The financial implications of these strategies are significant. Following the established 1:10:100 rule, the cost of preventing poor data quality at the source is approximately $1 per record. In contrast, remediation after creation costs $10 per record, and the cost of failure reaches $100 per record. This exponential cost increase makes early detection and prevention not just a technical best practice but a business imperative.
Defining Test Coverage in Data Systems
Test coverage in data systems refers to the extent to which automated quality checks cover data itself, data pipelines, transformations, and outputs. Higher coverage levels correlate directly with increased confidence in data accuracy, reliability, and trustworthiness. Many organizations mistakenly assume that occasional spot checks or ad-hoc validations provide sufficient coverage, but this approach often leads to incomplete visibility and unexpected data quality issues.
The scope of testing in data systems extends beyond simple data validation to encompass the entire ecosystem of tools, processes, and outputs. This includes checking data inputs for quality issues, validating the correctness of business logic, ensuring output consistency, and monitoring the performance and reliability of every tool in the data pipeline.
Production Testing: “Before the Fact” –Testing is built into the production process to catch issues early. “After the Fact” – Testing occurs periodically. “Avoid the Fact” – No automated testing in production. Failures reach consumers.
Development Testing: “Dynamic Testing” – Executes validations against real and code. “Static Analysis Testing” – Checks code, SQL, etc., without running real data. “Hope-Based Testing” – No formal tests. Reliance on intuition or trial-and-error.
Production Testing Strategies and Implementation
Production testing can be categorized into three distinct approaches, each with specific benefits and limitations. “Before the fact” production testing integrates quality checks directly into the production process, stopping pipeline execution when issues are detected. This approach enables teams to identify problems before customers encounter them, but it requires the instrumentation of pipelines or the use of test-aware orchestration tools.
“After the fact” production testing involves continuous monitoring and polling of databases and data ingestion processes, using static data lineage to detect impacts based on test failures. While this approach does not require pipeline instrumentation, it allows problems to enter production before they are detected, necessitating scrambling to fix issues after they occur.
The third approach, “avoid the fact” production testing, relies on manual inspection and customer feedback to identify issues. This approach offers no proactive benefits and results in customers discovering and reporting problems, making it unsuitable for professional data operations.
Development Testing Methodologies
Development testing encompasses three primary methodologies, each serving different purposes in the testing strategy. Dynamic testing catches real-world data failures at runtime through integration tests that ensure multiple data processing steps interact correctly, and end-to-end tests that simulate complete data pipelines from ingestion through final analytics output.
Static analysis testing provides fast feedback by identifying problems before code commits, without requiring real data execution. This includes SQL linting tools like SQLFluff, unit testing frameworks, and data hygiene testing capabilities. These tools enforce coding standards, detect style issues, and validate code quality before deployment.
The third methodology, hope-based testing, relies on manual inspection and intuition, rather than formal automation. This approach provides no systematic validation and should be avoided in a professional data engineering environment.
 Test Coverage Measurement
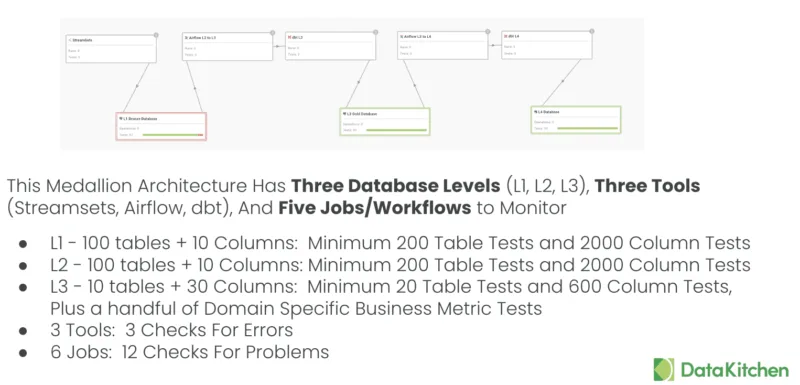
Effective test coverage measurement requires a systematic application across all database levels and zones. Every table should have tests, every column in every table should have tests, and every significant business metric should have tests. Additionally, every tool that processes data should be monitored for errors and timing issues.
- In All Levels/Zones In Your Database/Data Lake
- Every Table Should Have Tests: Minimum 2 Tests Per Table
- Every Column In Every Table Should Have Tests: Minimum 2 Tests Per Column
- Every Significant Business Metric Should Have Tests: Minimum 1 Custom Test Per Metric
- Every Tool That Uses Data Should Be Checked For Errors and Timing
- Logs For Errors: Minimum 1 Check Per Tool
- Optional: Check Metrics
- Task Status and Substatus Results: Minimum 1 Check Per Tool Per Job
- Timing and Duration: Minimum 1 Check Per Tool Per Job
The minimum testing requirements include at least two tests per table, two tests per column, and one custom test per business metric. For tools and workflows, minimum requirements include one error log check per tool, one status check per job, and one timing check per job. These baseline requirements ensure comprehensive coverage while remaining manageable for implementation.
Automated Data Consistency Testing Through Open Source Tools
Modern test coverage strategies leverage automated consistency testing, which utilizes data profiling and semantic data type analysis to generate targeted tests. This approach automatically infers rules and documentation while generating parameterized tests that function like sensors in a comprehensive monitoring system.
The automated approach quickly and easily covers every table and column, automatically catching approximately 80% of errors through numerous small, fast tests that would be too numerous and tedious to code manually. This broad coverage enables monitoring across multiple data levels and provides wide-net detection of inconsistencies, shifts, and drift compared to previous data states.
Open Source DataOps Data Quality TestGen provides quick and easy test coverage.
Coverage: Automated Consistency Testing
Comprehensive test coverage encompasses multiple categories of validation, each addressing specific aspects of data quality. Freshness consistency tests ensure that new data arrives as expected, including recency tests that verify the latest dates fall within acceptable ranges, and date count tests that confirm the number of distinct dates has not dropped unexpectedly.
Volume consistency tests validate that sufficient new data is being received, including row count tests that ensure record counts have not decreased, and row range tests that verify counts fall within expected percentage ranges. These tests can be configured for different periods, from daily to monthly validation cycles.
Schema consistency tests ensure that the data structure remains consistent, including value match tests that verify all values align with the baseline data. These pattern match tests confirm alphanumeric patterns remain consistent, and format validation tests for specific data types, such as email addresses and geographic codes.
Data drift consistency tests identify statistically significant changes in data characteristics, utilizing algorithms such as Cohen’s d for mean value differences, Cohen’s h for ratio shifts, and various outlier detection methods. These tests provide early warning of gradual changes that might indicate upstream issues or evolving data sources.
Coverage: Custom and Domain-Specific Testing
While automated consistency testing provides broad coverage, custom domain-specific testing addresses the remaining 20% of validation requirements that are unique to specific business contexts. These tests encode business rules and industry-specific validations that automated systems cannot infer from data patterns alone.
Examples include verifying that medical practices do not exceed the number of doctors, ensuring that no shipments occur on specific days, or confirming that sales increases fall within expected ranges. These tests can be developed by data engineers, analysts, or data stewards, with templates and reuse patterns driving scalability.
Advanced testing strategies include referential tests, which validate relationships between multiple tables, and aggregate tests, which ensure data consistency across different groupings and time periods. These multi-table validations utilize sophisticated algorithms, such as the Jensen-Shannon divergence, to compare distributions across datasets that may not match exactly but should maintain similar characteristics.
Aggregate balance testing ensures that data totals remain consistent across different aggregation levels and periods, providing validation that transformations and calculations maintain mathematical consistency throughout the pipeline.
Writing Test Manually Does Not Scale
Writing data quality tests manually presents significant workload challenges, as demonstrated by the stark contrast between automated and manual approaches. The example shows that while TestGen can generate 2,500 comprehensive tests across 20 tables and 1,000 columns in just two simple steps (profile and generate tests), achieving the same coverage manually would require a trained Data Engineer to invest 7.2 months of dedicated work time. This translates to over 1,250 hours of continuous effort, working 8 hours per day for 156 days straight without accounting for meetings, breaks, or vacations.
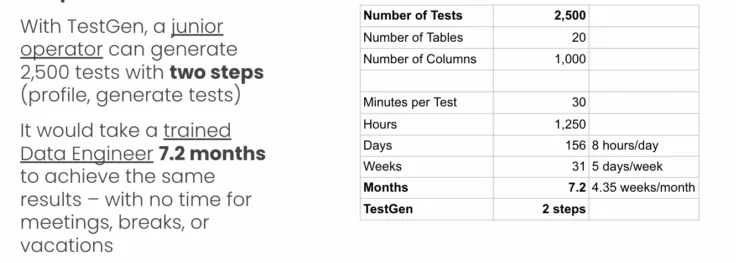
As data systems grow in complexity and scale, this manual approach becomes increasingly unsustainable – the time investment grows linearly with the number of tables and columns. At the same time, automated tools can handle exponentially larger datasets with minimal additional effort. The 30-minute manual effort required per test quickly compounds into months of work, making it impossible for organizations to maintain comprehensive data quality coverage across their entire data ecosystem without automation.
Production Tool Monitoring
Comprehensive test coverage extends beyond data validation to include monitoring of the entire toolchain that processes data. Modern data environments typically include 50 or more tools across various categories, each requiring monitoring for errors, performance issues, and timing problems.

This monitoring creates multiple data journeys that span batch, scheduled, and manual processes throughout the organization. Each journey requires specific validation points and monitoring capabilities to ensure end-to-end data quality and processing reliability. Tools like DataOps Observability support this idea.
Development Environment Integration
Effective test coverage requires seamless integration between development and production environments. Development teams require access to representative test data and accurate replicas of production environments to facilitate meaningful testing and ensure a smooth deployment.
The development testing process should include data hygiene qualification screens for new datasets, regression testing for code changes, and comprehensive validation that all existing functionality remains intact after modifications. This controlled process ensures that only validated changes are deployed to production environments.
Quality Improvement and Reporting On Test Coverage
Sustainable test coverage requires supporting organizational processes, including data quality dashboards that provide visibility into system health, process reports that enable targeted improvements, and quality circles that foster a culture of continuous improvement.
Quality circles represent particularly important cultural elements, emphasizing periodic meetings and retrospectives with a “no shame, no blame” approach that focuses on learning from errors and identifying opportunities for improvement. These practices create organizational commitment to data quality that extends beyond technical implementation.
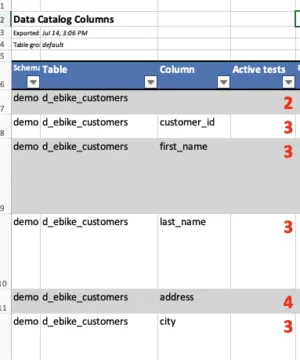
DataOps TestGen Data Test Coverage Export
Measuring and reporting test coverage on data tables requires systematic tracking of test counts per column and table as a fundamental baseline metric. This quantitative approach serves two critical purposes: first, it provides concrete evidence to customers and management about the thoroughness and extent of your data quality efforts, transforming abstract concepts of “data testing” into tangible, measurable results that stakeholders can evaluate and trust. Second, this granular visibility into test distribution helps identify coverage gaps where certain columns or tables may be under-tested, potentially leaving critical data vulnerabilities undetected. By maintaining counts of tests per column and table, data teams can demonstrate due diligence in their quality assurance processes, justify resource allocation for data quality initiatives, and strategically prioritize areas that need additional testing attention. This coverage reporting also enables trend analysis over time, showing whether test coverage is improving or declining as the data ecosystem evolves, ultimately supporting more informed decisions about data reliability and risk management.
Test Coverage Strategy and Design Choices
Organizations face three primary design choices when implementing comprehensive test coverage, each with specific benefits and limitations. Data quality-focused implementations concentrate on testing data sources but may lack visibility into downstream tools and processes, potentially allowing incorrect results to reach customers.
Data ingestion-focused implementations poll databases and alert teams to potential errors, but may still allow data errors into production while generating irrelevant alerts with partial coverage. Comprehensive data engineering implementations integrate tests and monitors into all data production processing steps, stopping errors before they reach production while enabling the same setup for development testing.
|
If you’re a Data Quality Person:
|
 |
|
If you’re a Data Ingestion Engineer, or have no control beyond your database:
|
 |
|
If you’re a Data Engineering Team and you control your tools, go for complete coverage:
|
 |
Lack Of Test Coverage Is Costly
Comprehensive test coverage in data and analytics represents a fundamental requirement for professional data engineering practices. The 1:10:100 cost rule makes early detection and prevention a business imperative, while the complexity and scale of modern data environments make manual testing approaches unsustainable.
Organizations must adopt automated testing tools and frameworks that provide comprehensive coverage while maintaining rigorous validation capabilities. The combination of automated consistency testing for broad coverage and custom domain-specific testing for business rule validation provides a balanced approach that addresses both technical and business requirements.
The future of data engineering depends on treating data quality with the same rigor and systematic approach that software engineering applies to code quality. By implementing comprehensive test coverage strategies, organizations can develop reliable and trustworthy data products that support informed business decision-making and maintain a competitive edge in data-driven markets.
Success requires not only technical implementation but also an organizational commitment to a culture of quality, continuous improvement processes, and systematic approaches to error prevention and detection. The investment in comprehensive test coverage pays dividends through reduced operational costs, improved customer satisfaction, and enhanced business confidence in data-driven insights and decisions.
What Are My Next Steps?
- First, you can install DataOps Data Quality TestGen on your computer. It installs with demo data, and you can complete a 10-minute quick start walkthrough.
- Second, our Data Quality and Observability Certification is available and free of charge. It utilizes Open-Source TestGen and our open-source DataOps Observability.
- Third, our Slack channel is an excellent resource for support.


