As DataOps continues to gain exposure, people are encountering the term for the first time. Below is our list of the most common questions that we hear about DataOps.
What is DataOps?
DataOps is a collection of technical practices, workflows, cultural norms, and architectural patterns that enable:
-
Rapid innovation and experimentation, delivering new insights to customers with increasing velocity
-
Extremely high quality and very low error rates
-
Collaboration across complex arrays of people, technology, and environments
-
Clear measurement, monitoring and transparency of results
The best way to explain DataOps is to review its intellectual heritage, explore the problems it is trying to solve, and describe an example of a DataOps team or organization. Our explanations below start at a very conceptual level, but then quickly proceed into pragmatic and practical terms. We find this is the best way to help data professionals to understand the potential benefits of DataOps.
What is DataOps’ intellectual heritage?
We trace the origins of DataOps to the pioneering work of management consultant W. Edwards Deming, often credited for inspiring the post-World War II Japanese economic miracle. The manufacturing methodologies riding Deming’s coattails are now being widely applied to software development and IT. DataOps further brings these methodologies into the data domain. In a nutshell, DataOps applies Agile development, DevOps and lean manufacturing to data-analytics development and operations. Agile is an application of the Theory of Constraints to software development, i.e., smaller lot sizes decrease work-in-progress and increase overall manufacturing system throughput. DevOps is a natural result of applying lean principles (eliminate waste, continuous improvement, broad focus) to application development and delivery. Lean manufacturing also contributes a relentless focus on quality, using tools such as statistical process control , to data analytics.
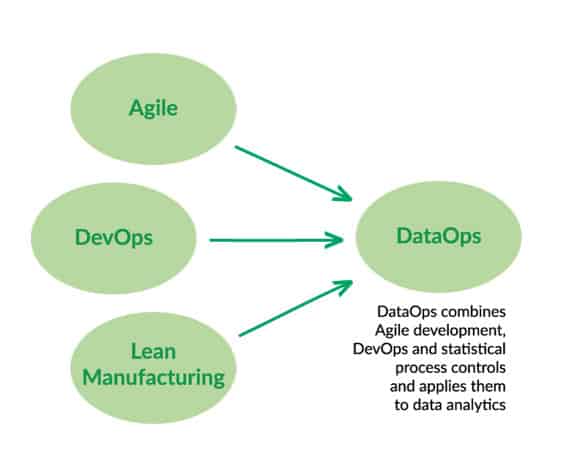
Figure 1: Agile, DevOps and lean manufacturing principles form the foundation of DataOps.
What is Agile Development?
For DataOps to be effective, it must manage collaboration and innovation. To this end, DataOps introduces Agile Development into data analytics so that data teams and users work together more efficiently and effectively. In Agile Development, the data team publishes new or updated analytics in short increments called “sprints.” With innovation occurring in rapid intervals, the team can continuously reassess its priorities and more easily adapt to evolving requirements, based on continuous feedback from users. This type of responsiveness is impossible using a Waterfall project management methodology which locks a team into a long development cycle, isolated from users, with one “big-bang” deliverable at the end.
Studies show that projects complete faster and with fewer defects when Agile Development replaces the traditional Waterfall sequential methodology. The Agile methodology is particularly effective in environments where requirements are quickly evolving — a situation well known to data analytics professionals. In a DataOps setting, Agile methods enable organizations to respond rapidly to customer requirements and accelerate time to value.
What is DevOps?
DevOps is an approach to software development that accelerates the build lifecycle (formerly known as release engineering) using automation. DevOps focuses on continuous deployment of software by leveraging on-demand IT resources (infrastructure as code) and by automating integration, test and deployment of code. This merging of software development (“dev”) and IT operations (“ops”) reduces time to deployment, decreases time to market, minimizes defects, and shortens the time required to resolve issues.
Using DevOps, leading companies have been able to reduce their software release cycle time from months to literally seconds. This breakthrough enabled them to grow and lead in fast-paced, emerging markets. Companies like Google, Amazon and many others now release software many times per day. By improving the quality and cycle time of code releases, DevOps deserves a lot of credit for these companies’ success.
What is lean manufacturing and what does it have to do with data analytics?
Lean manufacturing is a methodology, originating in the Japanese manufacturing industry (e.g., Toyota), that focuses on the minimization of waste within a system without sacrificing productivity. Whereas Agile and DevOps relate to analytics development and deployment, data analytics also manages and orchestrates a data pipeline. Data continuously enters on one side of the pipeline, progresses through a series of steps and exits in the form of reports, models and views. The data pipeline is the “operations” side of data analytics. It is helpful to conceptualize the data pipeline as a manufacturing line with an active focus on quality, efficiency, constraints and uptime. To fully embrace this manufacturing mindset, we call this pipeline the ” data factory. ”
In DataOps, the flow of data through operations is an important area of focus. DataOps orchestrates, monitors and manages the data factory. One particularly powerful lean-manufacturing tool is statistical process control (SPC). SPC measures and monitors data and operational characteristics of the data pipeline, ensuring that statistical variance remains within acceptable ranges. SPC leads to remarkable improvements in efficiency, quality and transparency when applied to data analytics. With SPC in place, the data flowing through the operational system is verified at each step in the data-analytics pipeline. If an anomaly occurs, the data analytics team will be the first to know, through an automated alert.
While the name “DataOps” implies that it borrows most heavily from DevOps, it is all of the methodologies described above — Agile, DevOps, “lean” and statistical process control — that comprise the intellectual heritage of DataOps. Agile governs analytics development, DevOps optimizes code verification, builds and delivery of new analytics and SPC orchestrates, monitors and validates the data factory. Figure 1 illustrates how Agile, DevOps and statistical process control for the foundation of DataOps.
Isn’t DataOps just DevOps for Data?
Nearly everyone makes this assumption when they first hear the term DataOps. While a little semantically misleading, the term “DataOps” does communicate that data analytics can achieve what software development attained with DevOps. That is to say, DataOps can yield an order of magnitude improvement in quality and cycle time when data teams utilize new tools and methodologies. DevOps optimizes the software development pipeline. It is what allows companies like Amazon, Netflix and Google to execute millions of code releases per year. DataOps also accelerates software (new analytics) development but has to simultaneously manage a dynamic manufacturing operation (i.e., data operations). DataOps includes DevOps and other methodologies which apply to the unique challenges of managing an enterprise-critical data operations pipeline. To learn more about the differences between DevOps and DataOps read the white paper, DataOps is NOT Just DevOps for Data.
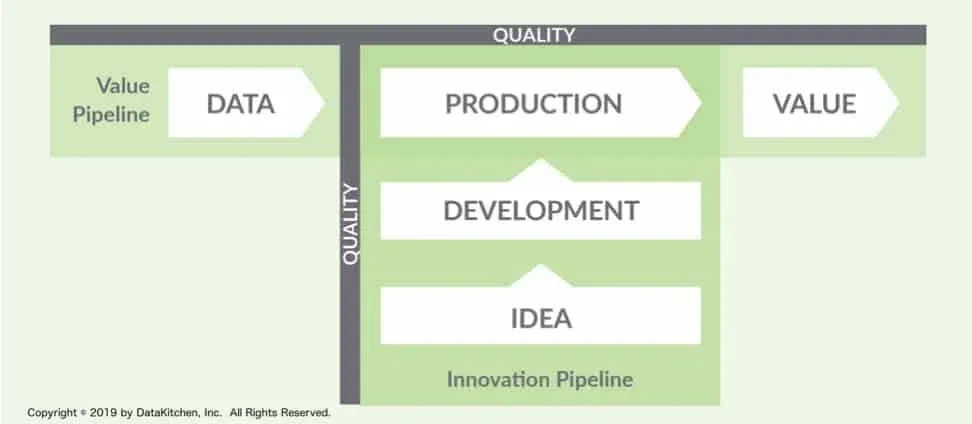
Figure 2: DataOps supports both the value (operations) and innovation (development) pipelines.
What problem is DataOps trying to solve?
DataOps exerts control over your workflow and processes, eliminating the numerous obstacles that prevent your data organization from achieving high levels of productivity and quality. We call the elapsed time between the proposal of a new idea and the deployment of finished analytics “cycle time.” Many organizations require months of cycle time to deploy 20 lines of SQL. Lengthy cycle times discourage and disappoint users and hinder creativity.
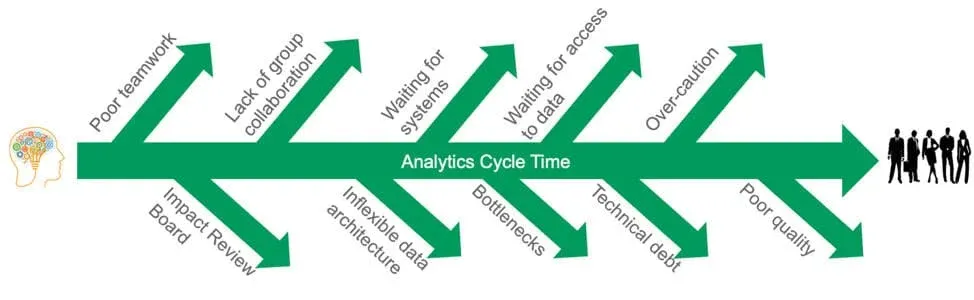
Figure 3: Obstacles that delay analytics cycle time.
Ideally, data teams work hand-in-hand with their users like a well-oiled machine, fielding new idea proposals, implementing them rapidly and quickly iterating toward higher-quality models and analytics. Unfortunately, our experience is the opposite. Data teams are constantly interrupted by data and analytics errors. Data scientists spend 75% of their time massaging data and executing manual steps. Slow and error-prone development disappoints and frustrates data team members and stakeholders. Lengthy analytics cycle time occurs for a variety of reasons (Figure 3):
-
Poor teamwork within the data team
-
Lack of collaboration between groups within the data organization
-
Waiting for IT to disposition or configure system resources
-
Waiting for access to data
-
Moving slowly and cautiously to avoid poor quality
-
Requiring approvals, such as from an Impact Review Board
-
Inflexible data architectures
-
Technical debt from previous deployments
-
Poor quality creating unplanned work
As daunting as some of these challenges are, some data organizations have achieved rapid cycle time and impeccable quality using DataOps. For example, pharmaceutical giant Celgene has improved cycle time by an order of magnitude and can support 12X the number of schema changes and 24X the number of data analysts per data engineer. While the median number of data errors within the industry is 3–10 per month, Celgene encounters very, very few errors or missed SLAs.
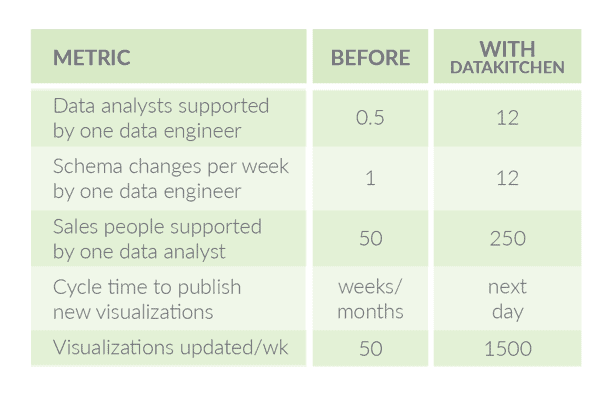
Figure 4: Celgene, before and after DataOps
What does a DataOps organization look like?
As we explained above DataOps is not necessarily one thing. To give you an idea of how DataOps works, we’ll describe organizations that use DataKitchen.
Tens or hundreds of data sources are consolidated into a data lake, pass through a complex series of transformations and are pushed to users in the form of analytics charts and graphs — all under automated orchestration. Automated tests (statistical process controls) validate the data entering the system, as well as the inputs, outputs and business logic at each step of transformation. Status, warning, and failure alerts from all of these process controls advance to the data team in real-time. Tests also implement a virtual Andon cord to stop a data source in the case of fatal errors. Data errors virtually never enter the data-analytics pipeline and processing errors are caught mid-pipeline before corrupting analytics. Quality and uptime KPPs (key performance parameters) for the data pipeline rise sharply, well above targets. Unplanned work due to errors is reduced by over 99%. All of the inefficient manual effort previously devoted to operating, verifying and fixing the data pipeline is redeployed to higher value-add activities. The data organization stops relying on hope and heroism.
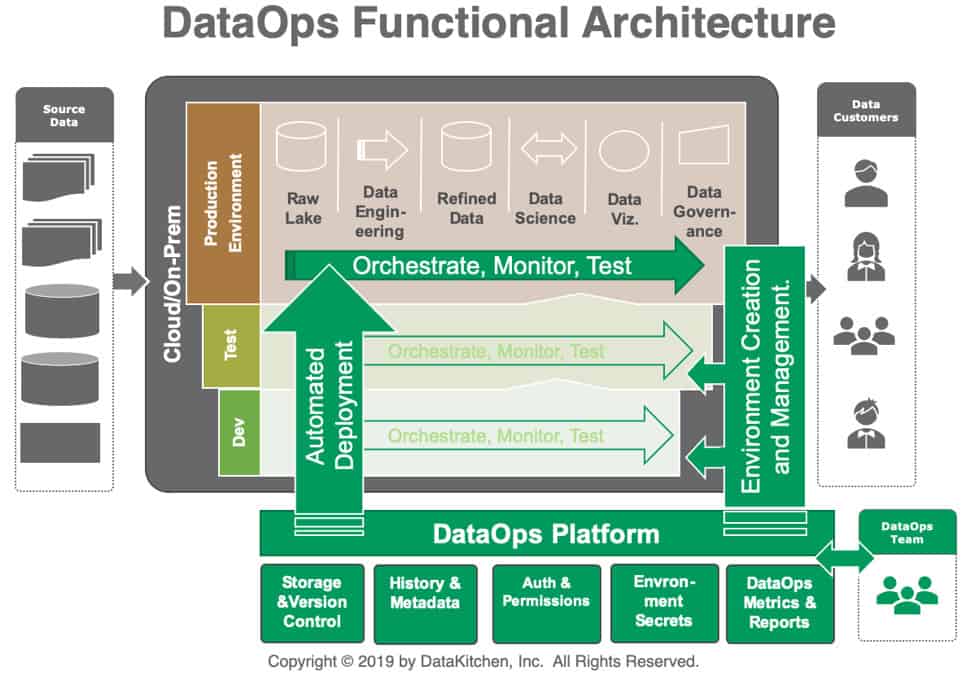
Figure 5: DataOps Functional Architecture
The process and workflow for developing new analytics has been streamlined and now operates seamlessly. The target operations environment is abstracted and replicated in virtual workspaces, improving test accuracy, repeatability and analytics portability.
The virtual workspaces provide developers with their own data and tools environments so they can work independently without impacting operations or each other. Workspaces also contain libraries of services and other components encouraging reuse. Workspaces feature automated, orchestrated pipelines which can be context sensitive and run by a scheduler. Creation of new analytics often involves developing incremental derivatives of existing components and pipelines instead of ” writing from scratch.” The workspaces are also tightly coupled with version control, so all source files and artifacts required for operations are inherently centralized, versioned and secured. Data scientists can share work with each other or forward analytics for production deployment with minimal rekeying and manual steps. Cycle time shrinks from months to days or hours.
DataOps utilizes process and workflow automation to improve and facilitate communication and coordination within a team and between the groups in the data organization. DataOps restructures data analytics pipelines as services (or microservices) that create a robust, transparent, efficient, repeatable analytics process that unifies all development and operations workflows. It enables teams to work independently, according to the iteration cadence appropriate to their toolchain, and then, with minimal manual steps, brings their work together into a unified whole for delivery to customers.
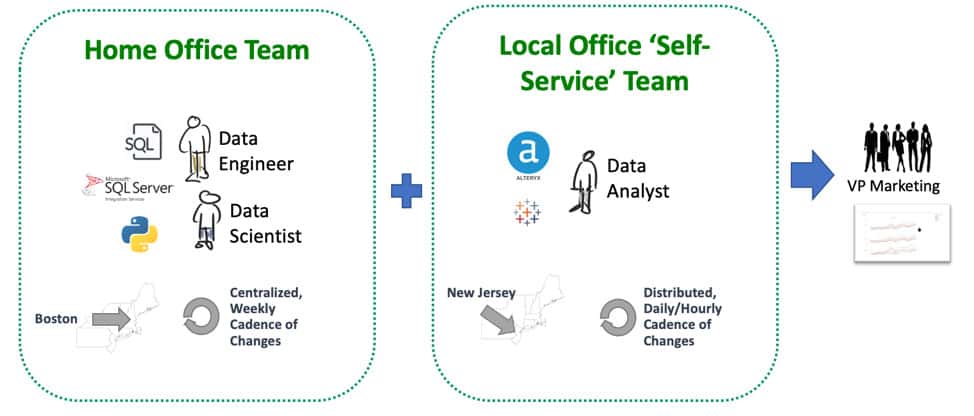
Figure 6: With DataOps, different teams can work independently but still collaborate.
What is a DataOps Engineer?
DataOps Engineers create and implement the processes that enable successful teamwork within the data organization. They design the orchestrations that enable work to flow seamlessly from development to production. They make sure that environments are aligned and that hardware, software, data, and other resources are available on demand. DataOps Engineers also manage tools that promote reuse — a big multiplier of productivity.
The rise of the DataOps Engineer will completely change what people think of as possible in data analytics. Through tools automation, the DataOps Engineer eliminates data lifecycle bottlenecks, which sap data team productivity. A DataOps Engineer who understands how to automate and streamline data workflows can increase the data team’s productivity by orders of magnitude. A person like that is worth their weight in gold. The role of DataOps Engineer goes by several different names. The skillset includes hybrid and cloud platforms, orchestration, data architecture, data integration, data transformation, CI/CD, real-time messaging and containers.
How do you prove that DataOps is really adding value?
DataOps will deliver an unprecedented level of transparency into your operations and analytics development. DataOps automated orchestration provides an opportunity to collect and display metrics on all of the activities related to analytics. Figure 6 shows a typical DataOps dashboard with metrics related to team collaboration, error rates, productivity, deployments, tests, and delivery time. We call this the CDO dashboard.The dashboard in Figure 7 contains some common metrics. DataOps easily customizes these metrics to meet an organization’s specific needs.
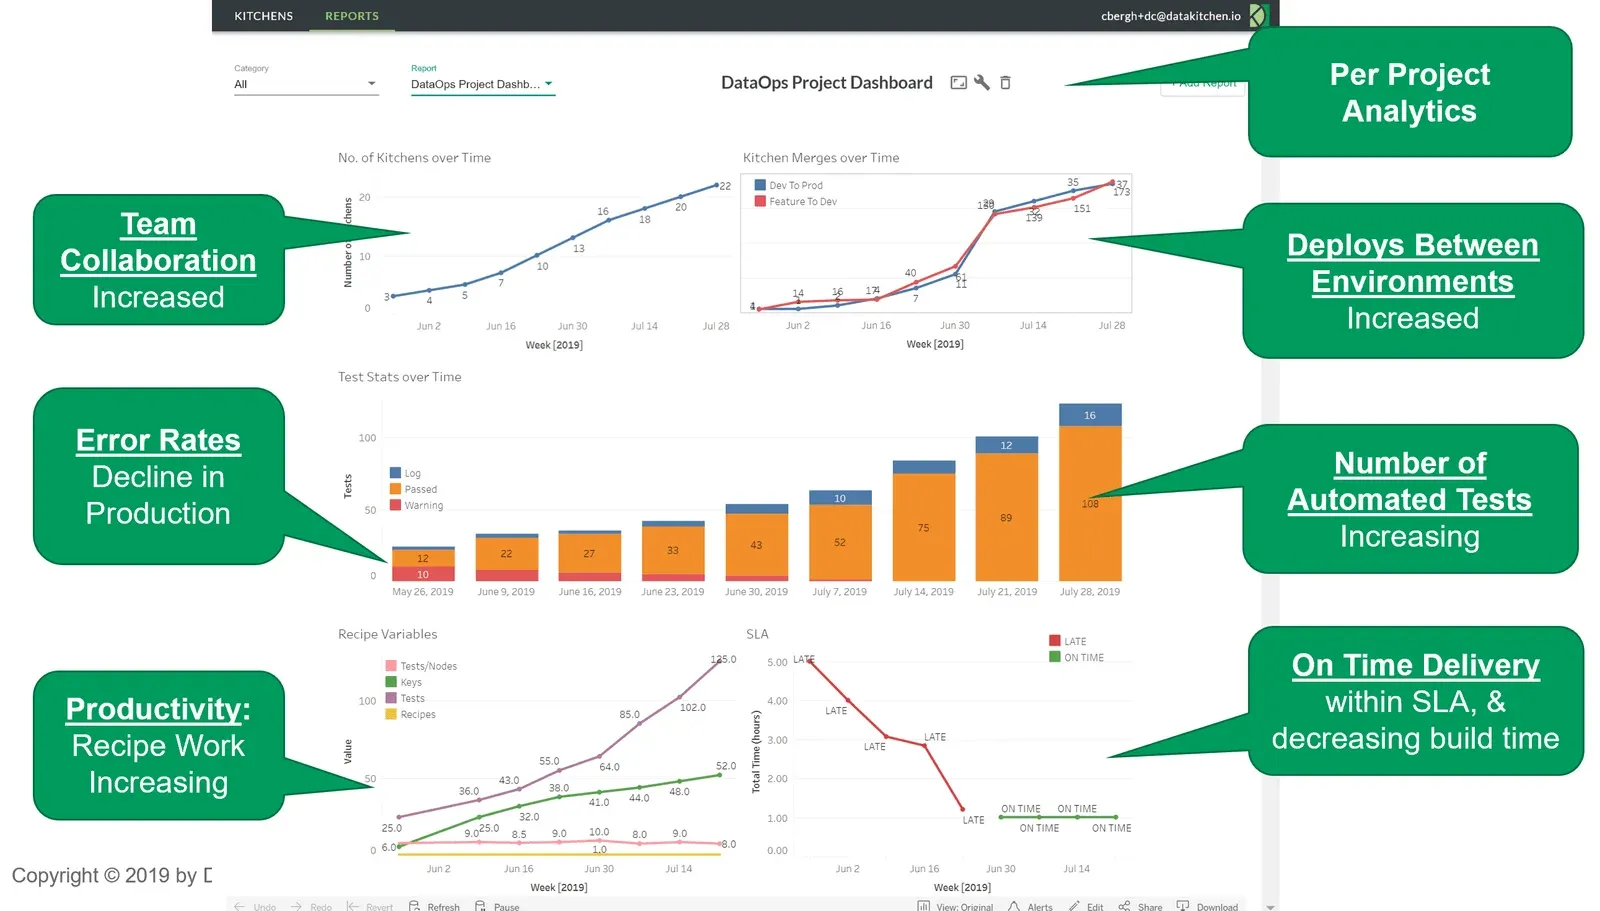
Figure 7: DataOps metrics report
Here’s a short explanation of the CDO Dashboard:
-
Team Collaboration — Teamwork is measured by the creation of virtual workspaces, also known as “Kitchens.” Each Kitchen creation corresponds to a new project or sub-project in a team context.
-
Error rates — The graph shows production warnings at a rate of 10 per week falling to virtually zero. This is the positive result of the 100+ tests that are now operating 24×7 checking data, ETL, processing results and business logic. As the number of tests increases, the data pipeline falls under increasingly robust quality controls.
-
Productivity — Team productivity can be measured by the number of tests and analytics created. The rise in “keys” (steps in data pipelines) coupled with the rise in test coverage shows a thriving development team. Also, the number of Kitchen merges at the top right shows the completion of projects or sub-projects. The “Feature to Dev” metric shows new analytics ready for release. “Dev to Prod” merges represent deployments to production (data operations).
-
On-time Delivery — Mean deployment cycle time falls sharply, meeting the target service level agreement (SLA).
How do I implement DataOps?
DataOps addresses a broad set of workflow processes, including analytics creation and your end-to-end data operations pipeline. It isn’t a single tool you can purchase and forget. We’ve written extensively about how to implement DataOps yourself. See our white paper, “Seven Steps to Implement DataOps.” DataKitchen offers a platform that can serve as a foundation for your DataOps initiative. It seamlessly orchestrates and manages end-to-end workflows related to both data operations and new analytics development. The DataKitchen Platform coordinates your multi-language, multi-tool, multi-platform toolchain into a coherent series of automated workflow pipelines.
In addition to DataKitchen, there is a robust and growing ecosystem around DataOps that includes tools for data pipeline orchestration, automated testing, production and quality alerts, deployment automation, development sandbox creation, data science model deployment and much more. These tools also interoperate with the DataKitchen Platform.
What is a DataOps Platform?
Applying DataOps requires a combination of new methods and automation that augment an enterprise’s existing toolchain. Some organizations build DataOps capabilities from scratch, but the fastest way to realize the benefits of DataOps is to adopt an off-the-shelf DataOps Platform. The DataKitchen DataOps Platform unifies the end-to-end workflow and processes related to data-analytics planning, development and operations into a single, common framework, improving overall collaboration. It incorporates your existing tools into automated orchestrations that drive analytics creation and the transformation of raw data to insights. The DataOps Platform accomplishes this goal by managing the creation, deployment and production execution of analytics. The DataKitchen DataOps Platform offers four fundamental capabilities:
- Spins up safe and synchronized workspaces – Using virtualization, DataOps separates and harmonizes your production and development environments. Aligning the two technical environments avoids unexpected errors during deployment. Access control secures each workspace and domain. When it’s time to start a new project, data scientists spin up self-serve development sandboxes in minutes – this includes test data, validation tests, tools, a password vault, – in short, everything they need. No more waiting months for IT.
- Automates deployment – New analytics pass extensive validation tests and seamlessly move from development to production engineering and then operations, with a few clicks. Verification tests replace your impact review board, minimizing the time and effort required to deploy.
- Orchestrates, tests, and monitors the data pipeline – Data flows in from hundreds or thousands of sources and is integrated, cleaned, processed and published in analytics. As millions of data points flow through the pipeline, tests distributed throughout the data pipeline monitor work in progress and check data for anomalies. Virtually zero errors reach user analytics. When errors are found, DataOps takes appropriate action based on severity: warnings, alerts, or even suspension of a data source. Dashboards that summarize test results and activity provide unprecedented visibility into operations and development. The DataOps Platform provides quality and productivity metrics, showing the progress of your DataOps initiative.
- Fosters Collaboration – DataOps automates workflows to coordinate tasks and improve teamwork. Workspace environments provide the structure to move analytics through the development workflow, from person to person, eventually reaching production. Sandboxes feature reusable analytics components saving time and enforcing standardization. Coupled with source control, workspaces branch and merge, providing centralized control of artifacts. With a DataOps Platform, everyone has a common view of the development and operations pipelines.
With an orchestrated data operations pipeline, quality controls and an automated development workflow, the DataOps Platform minimizes unplanned work. Task coordination between team members and groups leads to a more transparent and robust workflow. DataOps tests virtually eliminate data errors. The DataKitchen DataOps Platform enables data professionals to develop and deploy new analytics at lightning speed, delighting users and delivering insights that meaningfully impact the enterprise’s goals and initiatives.
Every tool vendor claims to do DataOps. Has the term lost its meaning?
Since DataOps awareness spiked in 2018, marketers have started to hijack the term and bend it toward whatever technology they are selling. Many of these tools can contribute to DataOps. No tool delivers DataOps by itself. An excellent place to get a synthesized, publicly vetted view of DataOps is Wikipedia. You can also read and sign the DataOps Manifesto. The Eckerson Group has published several excellent reports about DataOps and our recent blog post, A Guide to Understanding DataOps Solutions, helps cut through all the marketing spin.
It’s important to remember that DataOps is a combination of methodologies and tools. Stay focused on the goals: improving data and analytics quality, reducing the cycle time of creating new analytics, and increasing the productivity of the data organization by orders of magnitude. You can’t go wrong serving these aims.
Should I be skeptical of the hype around DataOps?
Probably, but DataOps is based upon a solid foundation that includes Agile development, DevOps, lean manufacturing and statistical process controls. These mature methodologies have added value in enterprises and businesses for decades.
- Introducing BuzzOps: A Tool to Translate Vendor BS. You’re Welcome.
- TestGen Now Supports Oracle and SAP HANA, with a New Setup Wizard to Get You Running Fast
- DataKitchen Enhances Its Support for Data Stewards to Manage Data Quality Tests in TestGen
- $1 Billion in Data Observability VC Investment: This Is Not Going to End Well