Data errors impact decision-making. When analytics and dashboards are inaccurate, business leaders may not be able to solve problems and pursue opportunities. Data errors infringe on work-life balance. They cause people to work long hours at the expense of personal and family time. Data errors also affect careers. If you have been in the data profession for any length of time, you probably know what it means to face a mob of stakeholders who are angry about inaccurate or late analytics. In a medium to large enterprise, thousands of things have to happen correctly in order to deliver perfect analytic insights. Data sources must deliver error-free data on time. Schema changes must work perfectly. Servers and toolchains must perform flawlessly. If any one of thousands of things goes off the rails, the analytics are impacted and the analytics team and their leaders are on the hook.
And the worst part – data errors take the fun out of data science. Remember your first data science courses? Or the excitement of your first encounter with your favorite tools? You probably imagined your career would be about helping drive insights with data instead of having to sit in endless meetings discussing analytics errors and painstaking corrective actions.
Data Observability Component of DataOps
DataKitchen has developed a methodology implemented around our DataOps Platform to reduce data errors to virtually zero. This has a tremendous impact on data organizations in terms of restoring credibility, improving productivity and agility by eliminating unplanned work, and perhaps equally important, putting the fun back into data science and engineering. Some of the DataOps best practices and industry discussion around errors have coalesced around the term “data observability.” Generically, observability is the ease with which you can ascertain the state of a system by observing its external outputs. In modern IT and software dev, people use the term observability to include the ability to find the root cause of a problem. Observability is a characteristic of your system. A more observable system enables you to more easily pinpoint the source of an issue.
Some will argue that observability is nothing more than testing and monitoring applications using tests, metrics, logs, and other artifacts. That’s a fair point, and it places emphasis on what is most important – what best practices should data teams employ to apply observability to data analytics. We see data observability as a component of DataOps. In our definition of data observability, we put the focus on the important goal of eliminating data errors.
IMPORTANT
Data Observability – The set of technical practices, cultural norms, and architecture that enable low error rates.
One important note is that shiny new observability tools are not required in order to achieve high levels of data observability. Some of these tools are awesome. We are not against them, but they are not silver bullets that vanquish all observability challenges. The little secret behind observability is that it is attainable using tools and methods that you should already use and understand. Another aspect of observability is creating the conditions that enable data teams to identify and resolve errors as quickly as possible.
Below we will illustrate the practices and technologies that enable data observability using the DataKitchen DataOps Platform which is specifically built to ease and accelerate the implementation of DataOps data observability. Since 2008, teams working for our founding team and our customers have delivered 100s of millions of data sets, dashboards, and models with almost no errors. You and your data team can accomplish the same thing at your organization. Below we will explain how to virtually eliminate data errors using DataOps automation and the simple building blocks of data and analytics testing and monitoring.
Applying DataOps Principles to Data Observability
Our approach to data observability is grounded in a methodology called DataOps that we explain in our book, “The DataOps Cookbook.” Before we talk about winning the war against data and analytics errors, let’s review some fundamental DataOps principles:
Avoid manual tests
Manual testing is performed step-by-step, by a person. Manual testing creates bottlenecks in your process flow. This tends to be expensive as it requires someone to create an environment and run tests one at a time. It can also be prone to human error. Automated testing is a major pillar in DataOps.
Data operations is manufacturing
You run a factory and that factory produces insight in the form of data sets, dashboards, and other tools. The data factory transforms raw materials (source data) into finished goods (analytics) using a series of processing steps (Figure 1). As such, applying manufacturing methods, such as lean manufacturing, to data analytics produces tremendous quality and efficiency improvements.
Any good manufacturing manager will tell you that tests are a critical part of your process. The earlier in your manufacturing flow that you find an error, the less rework you have to do. A robust process checks source data and work-in-progress at each processing step along the way to polished visualizations, charts, and graphs. Best practices include continuous monitoring of machine learning models for degradations in accuracy.
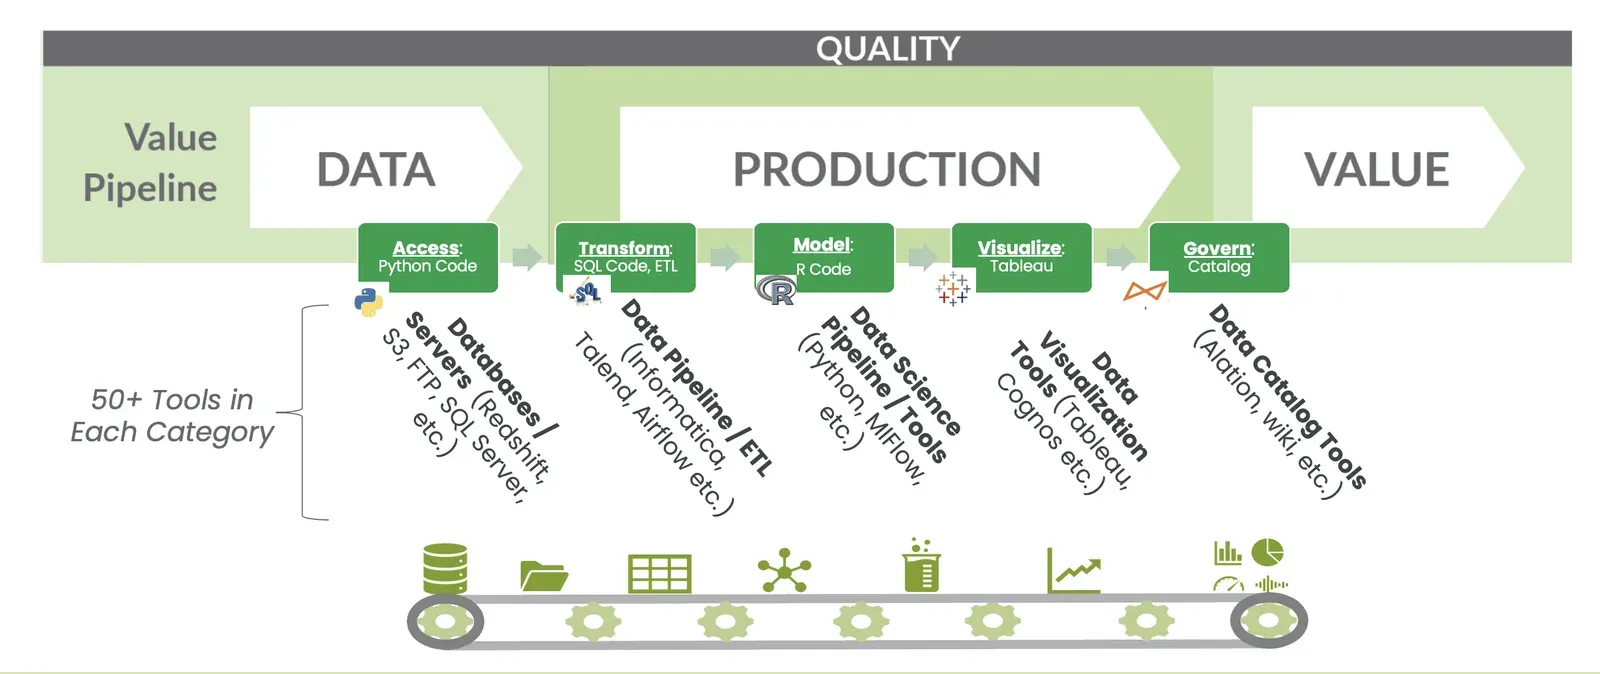
Figure 1: The process of transforming raw data into actionable business intelligence is a manufacturing process.
Tie tests to alerts
When something goes wrong, you need to know about it as it’s happening to ensure that errors don’t reach customers or business partners. Tie your testing and monitoring mechanisms to real-time alerts. An automated process that catches errors early in the process gives the data team the maximum available time to resolve the problem – patch the data, contact data suppliers, and rerun processing steps.
The measurement and monitoring of your end-to-end process can serve as an important tool in the battle to eliminate errors. We liken this methodology to the statistical process controls advocated by management guru Dr. Edward Deming. The variety of potential process controls is endless and must be matched to a particular manufacturing flow. One example that we have found incredibly useful is the Shewhart chart. The Shewhart chart identifies process inconsistencies. For example, imagine a table with a million rows. Week after week, it is measured with a million rows. Then, perhaps suddenly out of the blue, it has 50 rows. The Shewhart chart detects this trend break and sends a DataOps alert. Is a trend break like this always an error? No, it could be the effect of an intentional change upstream, but the test gives the data team a chance to investigate and inform users if a change impacts analytics. Tests and alerts enable proactive communication with users that builds data team credibility. DataOps alerts are not general in nature. Alerts report detailed information so the production support team has a specific issue with a complete fact pattern to aid investigation.
In addition to statistical process controls, we recommend location and historical balance tests. See our white paper, “A Guide to DataOps Tests,” for more information.
Focus on the process
According to Deming, 94% of problems are “common cause variation,” and to decrease this variation you must focus on the system or process, not look for a person to blame. A relentless process focus has led to dramatic improvements in the auto industry, where lean manufacturing principles have led to dramatically higher levels of productivity and quality. Or more recently, the principles of DevOps (lean applied to software development) have enabled companies to perform millions of software releases each year.
Errors are a huge team productivity drain
Reducing errors eliminates unplanned work that pulls members of the data team from their high-priority analytics development tasks. An enterprise cannot derive value from its data unless data scientists can stay focused on innovation.
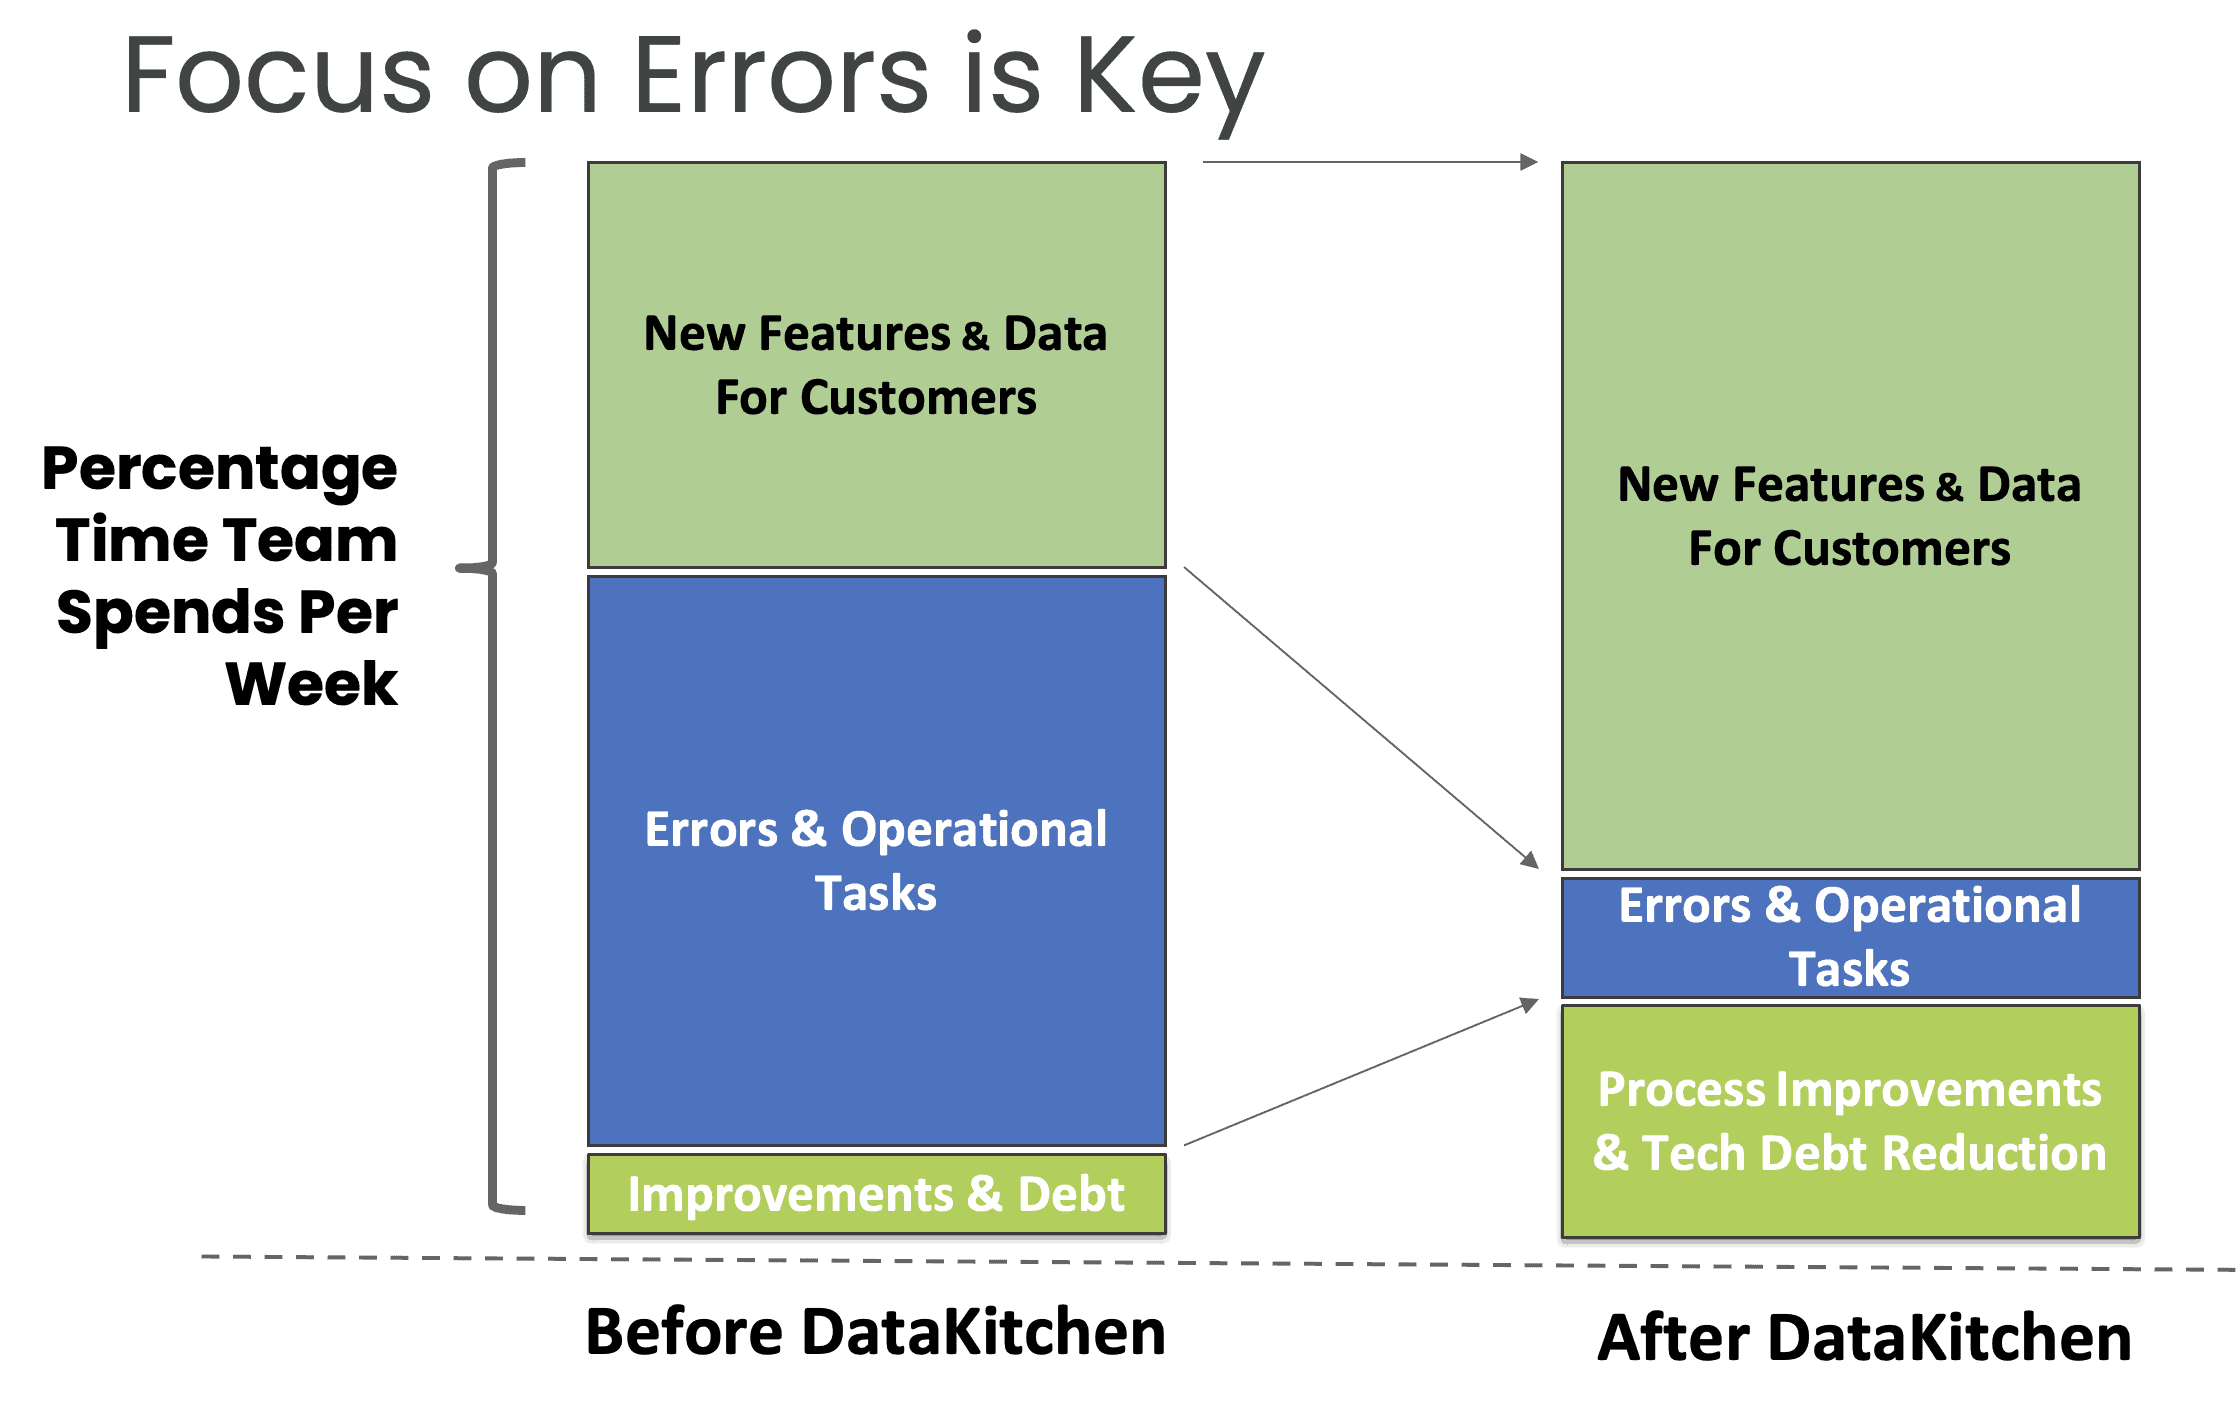
Figure 2: Eliminate the dependence on heroism.
Heroism is a brute-force tactic that throws people at problems. Don’t wear the ‘hairshirt’ of hard work, overtime, and suffering like a badge of honor. Heroism accepts unplanned work as a way of life. Heroism is a process bottleneck. Heroes will eventually burn out and leave the company. It’s no fun to work the long and unpredictable hours of a hero. DataOps has helped many managers understand how modern workflow methods and automation eliminate the need for heroes (Figure 2).
Find errors before your customers do
Many enterprises have few process controls on data flowing through their data factory. “Hoping for the best” is not an effective manufacturing strategy. You want to catch errors as early in your process as possible. Relying upon customers or business users to catch errors will gradually erode trust in analytics and in the data team. Make sure the data and the artifacts that you create from data are correct before your customer sees them.
It’s not about data quality
In governance, people sometimes perform manual data quality assessments. These labor-intensive evaluations of data quality can only be performed periodically, so at best they provide a snapshot of quality at a particular time. DataOps automation that focuses on lowering the rate of errors ensures continuous testing and improvement in data integrity. DataOps automated testing works 24×7 to validate the correctness of your data and analytics (Figure 3).
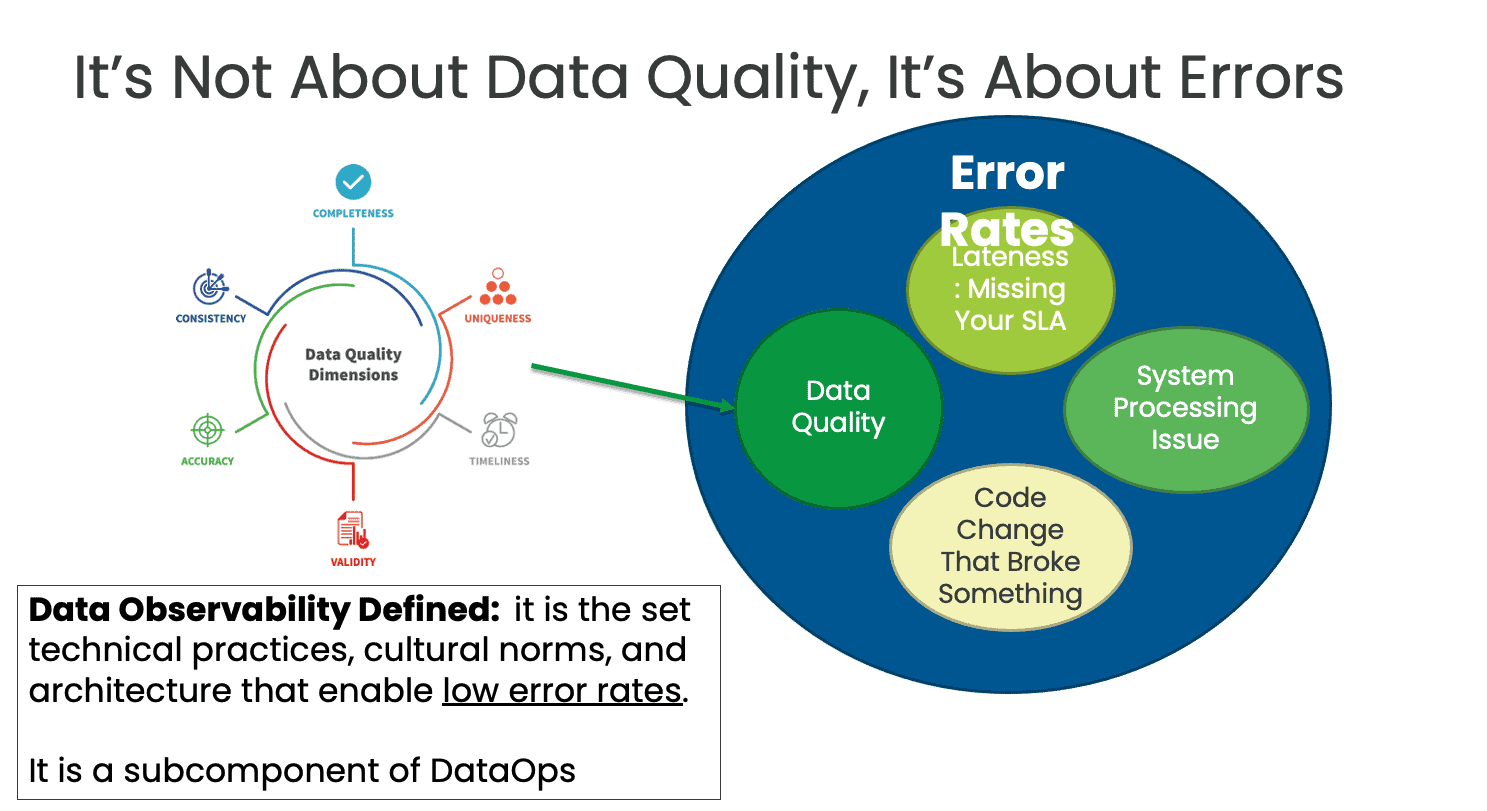
Figure 3: Observability focuses on error rates instead of only measuring data quality at a single point in time.
It’s not only about the data
It’s important to check data, but errors can also stem from problems in your workflows, end-to-end toolchain, or the configuration/code acting upon data. For example, correct data that is delivered late (a missed SLA) can also be a big problem. The DataOps approach takes a birds-eye-view of your data factory and attacks errors on all fronts.
Testing/Monitoring is not a bag on the side
Tacking testing and monitoring on as an afterthought is not an optimal way to reduce errors. DataOps prefers that the system includes automated testing as a major capability. You can enhance an existing system to seamlessly incorporate testing and monitoring using a DataOps process hub (Figure 4).
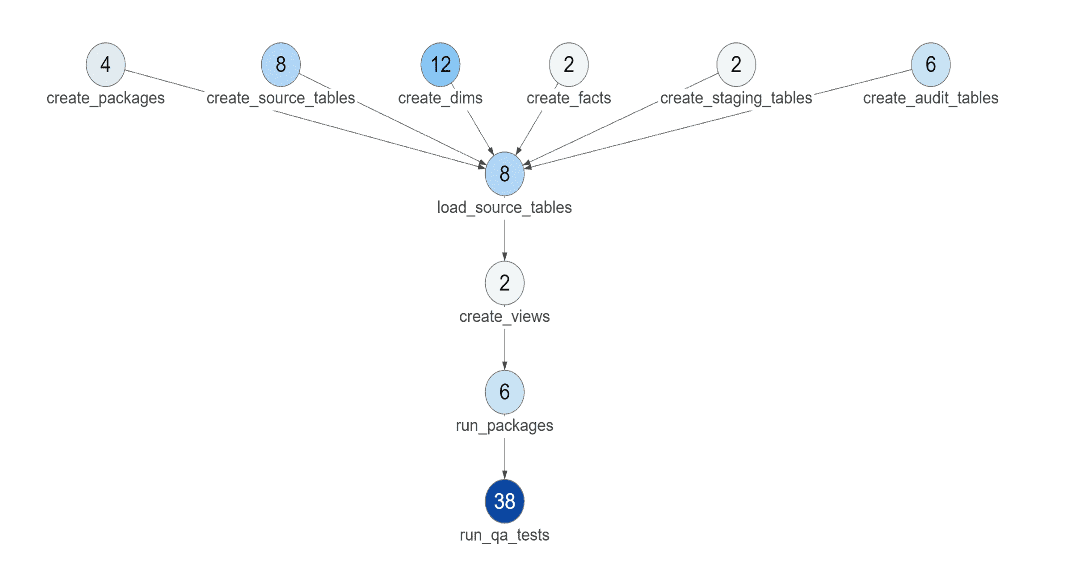
Figure 4: The DataKitchen DataOps Platform enables you to see how many tests execute at each stage of the data pipeline.
Run tests in both development and production
In DataOps, automated testing is built into the release and deployment workflow. Testing proves that analytics code is ready to be promoted to production. Most of the tests that are written to validate code during the analytics development phase are promoted into production with the analytics to verify and validate the operation of the data pipeline.
Writing Tests in Your Tool of Choice
The water cooler arguments over tool superiority are always entertaining, but will never be settled. Some people prefer R over Python. Some argue that visual UI’s are better than SQL. Everybody has their favorite tools and in principle, data scientists and data engineers should be free to write tests in the tool of their choice. On the other hand, very few people are familiar with all the tools so a typical data pipeline can’t be easily enhanced with tests. The skillset problem is a major bottleneck in test development.
A DataOps Platform that encompasses all of the data organization’s stacks and toolchains makes it much easier to augment a toolchain with DataOps methods. A DataOps Platform connects with each of the tools within the stacks and provides a common domain for orchestration, testing, monitoring, management, and other DataOps functions. For example, you can write tests that monitor real-time data operations within the common domain of the DataOps process hub. You can learn one tool and test inputs, outputs, and business logic at any step in the data pipeline (Figure 5).
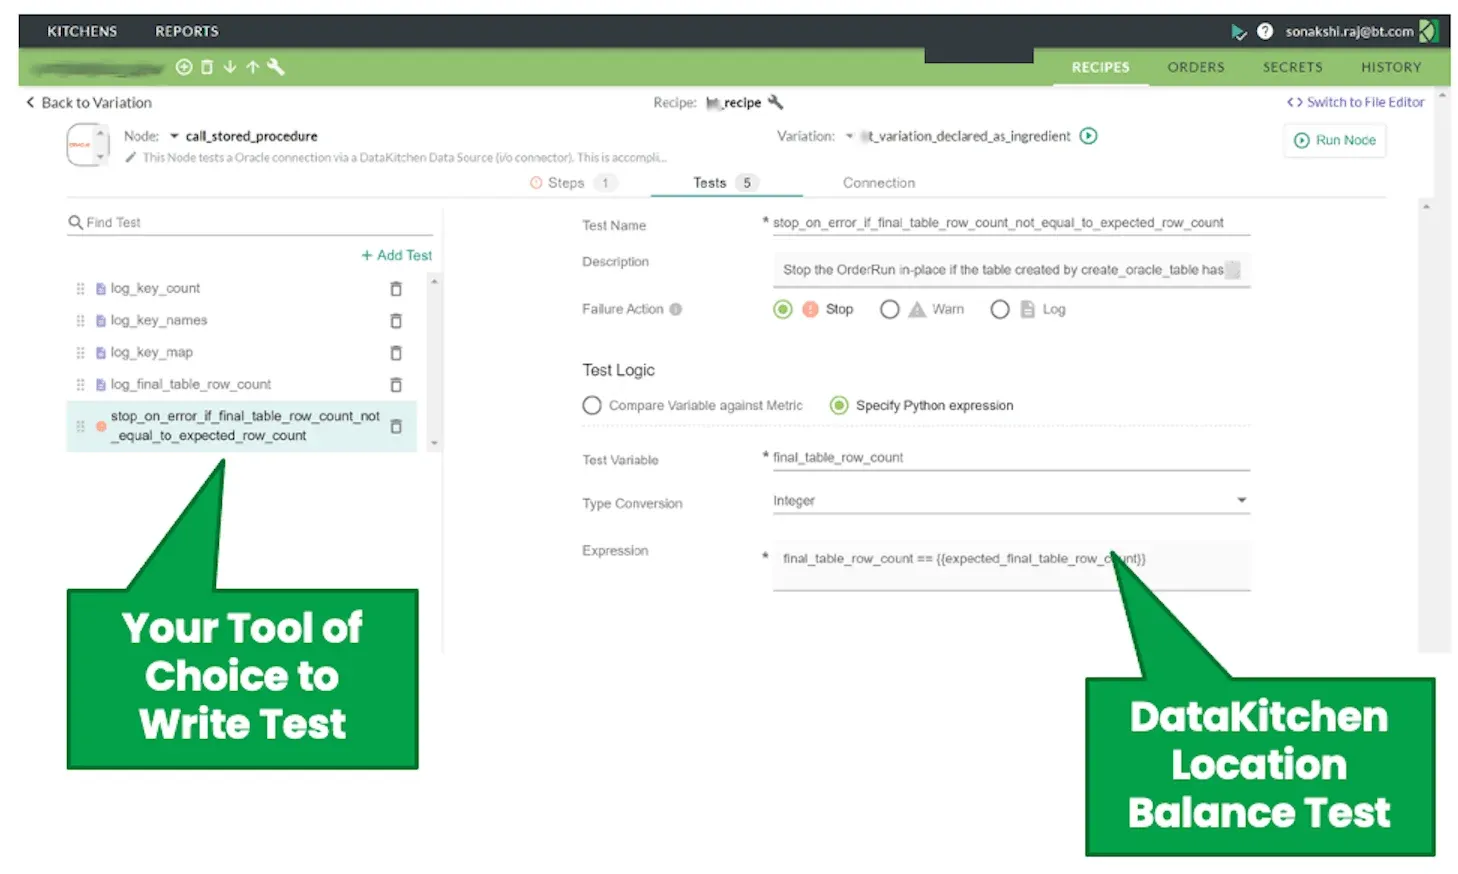
Figure 5: The DataKitchen UI enables data professionals to easily test inputs, outputs, and business logic at each stage of the data pipeline without having to learn each and every tool that operates on data.
DataKitchen is an example of a DataOps Platform. It complements your existing tools and unifies your end-to-end toolchains. It operates as the control center for your DataOps program and enables your team to implement DataOps without learning multiple new technologies or programming languages. Instead, team members can continue to use the tools they know and love. Once their preferred technologies connect to the DataOps Platform, it guides the users and teams to develop, deploy, and enhance complex data analytic systems according to DataOps methods.
Production Analytics
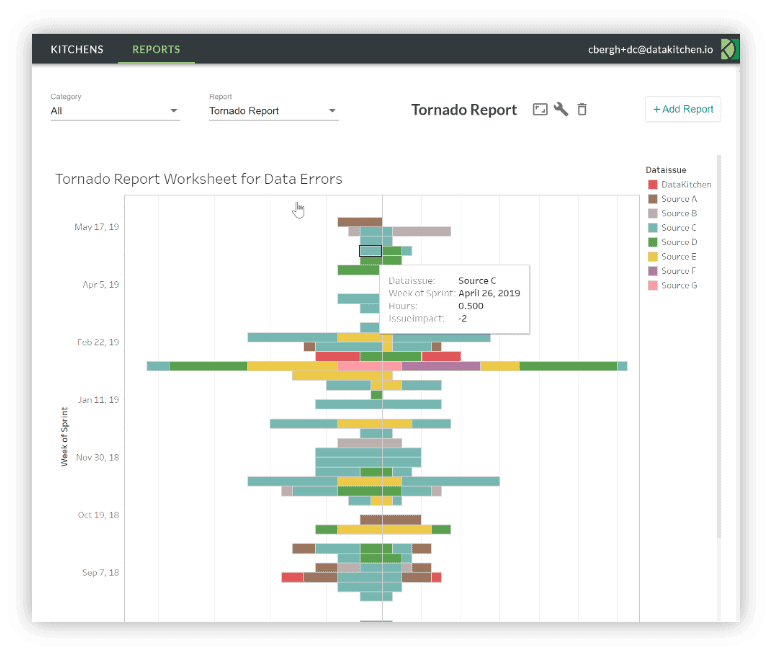
Figure 6: The DataKitchen Platform provides process observability reports like the Tornado Report which tracks errors and resolution time per data source.
As we have stated, your production pipeline or data operations is a factory and like any modern manufacturing facility needs to be tracked and managed using analytics. The DataKitchen Platform provides a series of historical or longitudinal reports on the production or data operations pipeline. These reports shed light on production error rates, data error rates, service level agreements (SLA), and test/monitoring coverage. As one example of many, the Tornado Report below tracks the number of errors from each data source and the time required to address each error (Figure 6). You may have dozens of data providers with one or two being especially problematic. Data sources could be anything from your internal ERP system to a third-party API. You need to be able to track errors from each supplier and apply pressure on them to improve. “Hey, this problem in your data source caused me three days of rework.” You’ll get further addressing issues with third parties armed with facts to back up your assertions.
Tests That Enable Data Observability
A data team can make significant progress in reducing errors by working on data observability. There are many types of tests that focus on testing and monitoring data. Here are some tests that can be extremely effective in improving data observability.
Data Quality
A traditional data quality assessment is a governance tool that evaluates the condition and content of a data set with the aim of deciding whether it is fit for purpose. When these assessments are performed manually, they can only be executed periodically, so at best, a data quality assessment provides a snapshot of data quality at a particular time. DataOps automates data quality assessment so it is run continuously as part of the data analytics pipeline.
Location Balance Tests
Location Balance tests ensure that data properties match business logic at each stage of processing. For example, an application may expect 1 million rows of data to arrive via FTP. The Location Balance test could verify that the correct quantity of data arrived initially and that the same quantity is present in the database, in other stages of the pipeline, and finally, in reports (Figure 7).
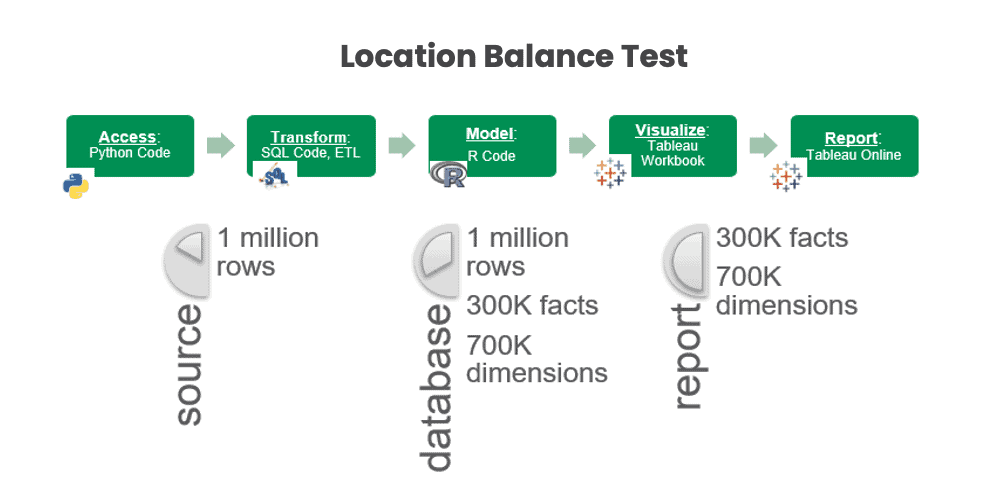
Figure 7: Location Balance Tests verify 1M rows in raw source data, and the corresponding 1M rows / 300K facts / 700K dimension members in the database schema, and 300K facts / 700K dimension members in a Tableau report.
Historical Balance
Historical Balance tests compare current data to previous or expected values. These tests rely upon historical values as a reference to determine whether data values are reasonable (or within the range of reasonable). For example, a test can check the top fifty customers or suppliers. Did their values unexpectedly or unreasonably go up or down relative to historical values?
It’s not enough for analytics to be correct. Accurate analytics that “look wrong” to users raise credibility questions. Figure 8 shows how a change in SKU allocations, moving from pre-production to production, affects the sales volumes for product groups G1 and G2. You can bet that the VP of sales will notice this change immediately and report back that the analytics look wrong. Missing expectations is a common issue for analytics – the report is correct, but it reflects poorly on the data team because it seems wrong to users. What has changed? When confronted, the data-analytics team has no ready explanation. Guess who is in the hot seat.
Historical Balance tests could have alerted the data team ahead of time that product group sales volumes had shifted unexpectedly. This warning would have given the data-analytics team a chance to investigate and communicate the change to users in advance. Instead of hurting credibility, this episode could help build it by showing users that the reporting is under control and that the data team is on top of changes that affect analytics. “Dear sales department, you may notice a change in the sales volumes for G1 and G2. This difference reflects a reassignment of SKUs within the product groups.”
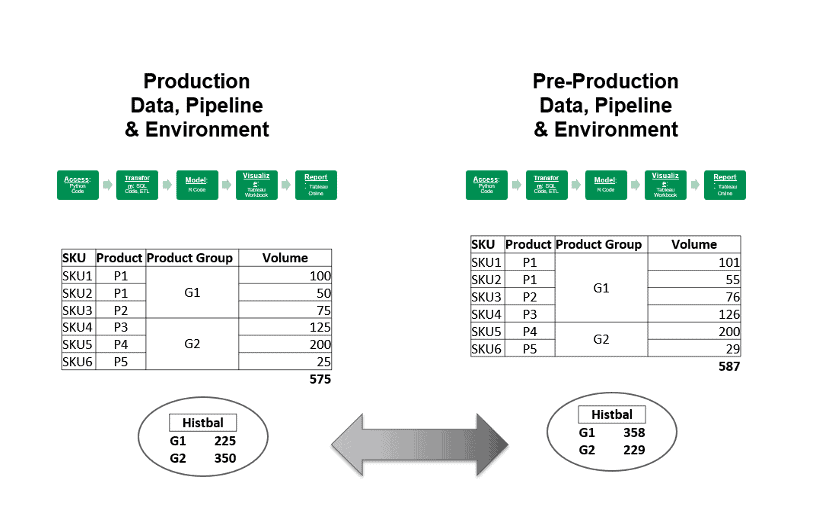
Figure 8: It’s not enough for analytics to be correct. Accurate analytics that “look wrong” to users raise credibility questions.
Statistical Process Control
Lean manufacturing operations measure and monitor every aspect of their process in order to detect issues as early as possible. These are called Time Balance tests or, more commonly, statistical process control (SPC). SPC tests repeatedly measure an aspect of the data pipeline screening for error or warning patterns (Figure 9). SPC offers a critical tool for the data team to catch failures before users see them in reports.
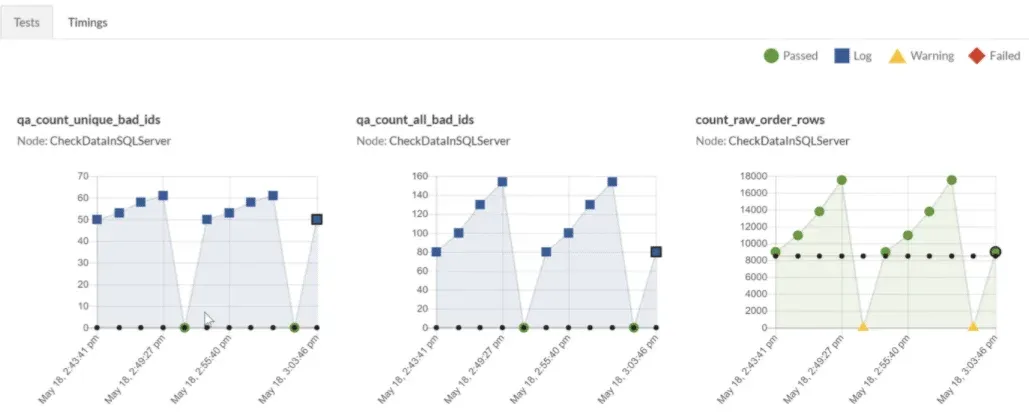
Figure 9: Statistical Process Control tests apply numerical criteria to data-analytics pipeline measurements.
Business Logic Tests
Business logic tests validate data against tried and true assumptions about the business. For example, a business logic test could check that customers are present in a customer dimension table and that they are assigned to a member of the correct regional sales team. Business-based tests ensure that the data makes sense in the context of the organization’s workflow processes.
The Duality of Tests: Production Tests are Needed for Development Speed
Tests have a dual purpose. The tests that are used in development to verify code can be used later in production to verify data. Development and production are different in certain respects. In development, code is changing and data is usually fixed. In production data changes and code is fixed. One might think that you have to address these separately.
The software industry has decades of experience ensuring that code behaves as expected. Each type of test has a specific goal. If you spend any time discussing testing with your peers, these terms are sure to come up:
- Unit Tests – testing aimed at each software component as a stand-alone entity
- Integration Tests – focus on the interaction between components to ensure that they are interoperating correctly
- Functional Tests – verification against functional specification or user stories.
- Regression Tests – rerun every time a change is made to prove that an application is still functioning
- Performance Tests – verify a system’s responsiveness, stability, and availability under a given workload
- Smoke Tests – quick, preliminary validation that the major system functions are operational
Eighty percent of tests created for the purposes of verifying code in development are useful in checking production data. Parameterization of tests and technical environments so that tests move seamlessly between development and production is a key feature of DataOps and the DataKitchen platform. The ability to clone a production pipeline with data and tests enables rapid problem diagnosis and resolution.
The cloning of a production environment will require data and other artifacts. If these can’t be pulled directly from production, then the production architecture should include exports or “saves” of critical input data, test history, logs, output data, and other artifacts. These are used to create development environments that closely align with production environments. For example, in order to run historical balance tests in a development environment, the dev environment needs the necessary historical balance data from previous runs (Figure 10).
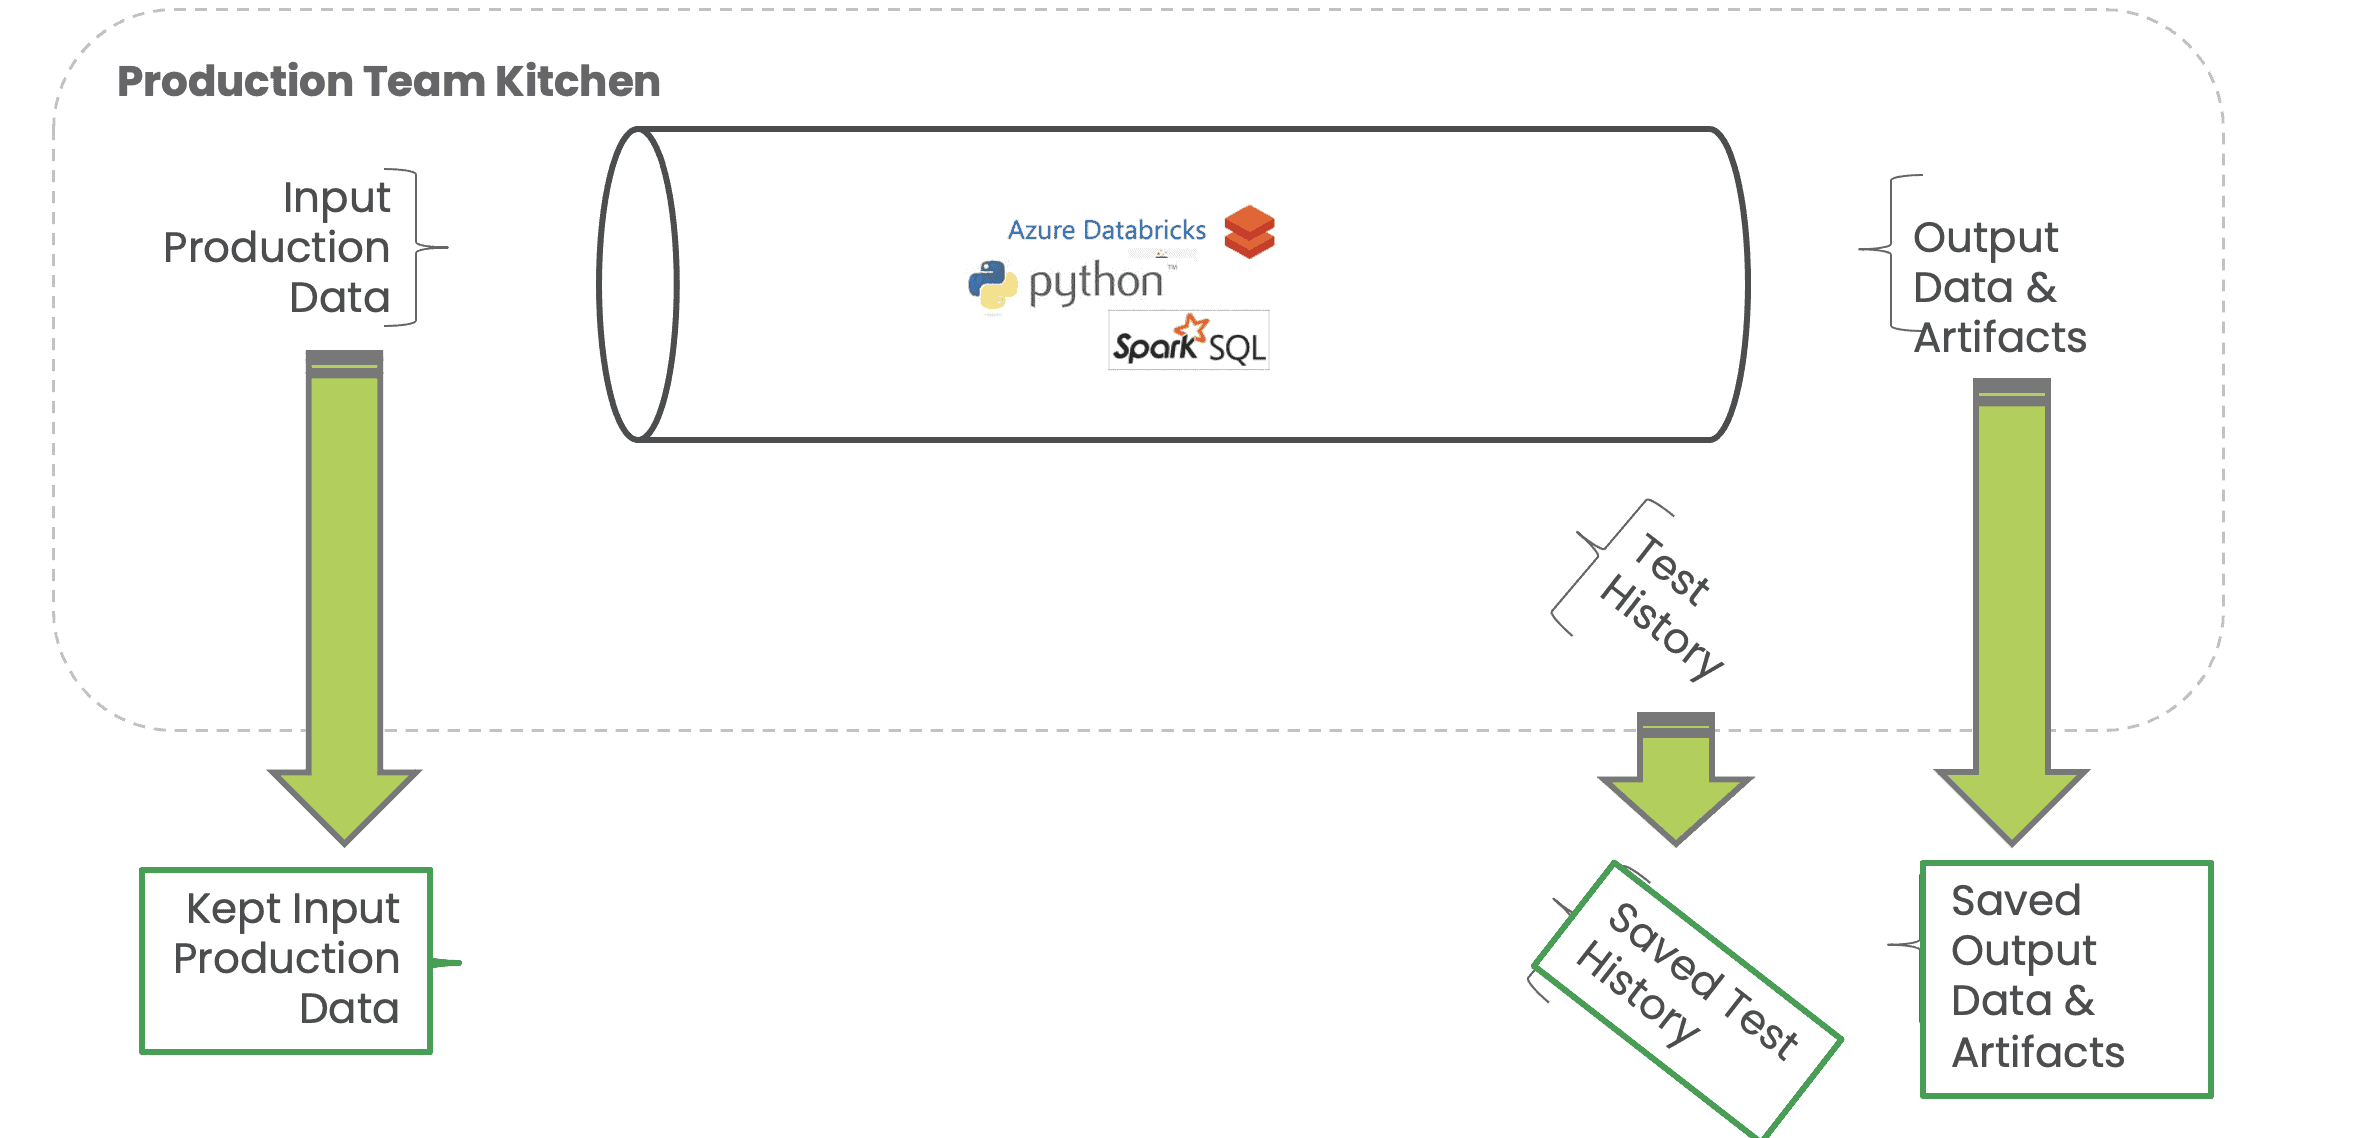
Figure 10: A clone of the production environment for development purposes must include the input data, test history, logs, output data and other artifacts available in production.
Some, but not all, test generation can be automated. Data professionals should invest twenty percent of their time developing tests. We specifically use the term “invest” because tests generally more than pay for themselves in terms of reducing unplanned work. In a sense, tests are a gift that you give to your future self.
Adding Observability to an Existing System
Some people advocate that observability must be architected from the outset. In most cases, data organizations don’t have the luxury of creating a system from scratch. They seek to add data observability to an existing data factory. A DataOps process hub like the DataKitchen Platform connects to your existing toolchains and extends your existing data pipelines with observable meta-orchestration. In other words, it can orchestrate your hierarchy of data, development, and environment creation pipelines and seamlessly integrates testing and monitoring into your end-to-end system. It enables data professionals to write tests in their tools of choice or using the simple DataKitchen UI. In addition to what we’ve discussed above, the DataKitchen Platform provides these additional capabilities which support observability:
- Bootstrap – The DataKitchen Platform automatically generates tests based on historical profiling data so you aren’t starting from scratch.
- Alerts – Route informative alerts to the correct party for follow up and resolution
- Process Lineage – The DataKitchen Platform tracks the processes that act upon data. It keeps a database of code, test history, timing steps, process steps, etc.
- Time Durations – Testing should not be limited to data. If your pipeline execution takes too long and you miss an SLA, that’s an error. Execution times are tracked so you can check to see if your process goes too long
- Coverage – Software development has a concept called test coverage which looks at how well tests cover an application or process. This methodology is new to data analytics. The DataKitchen Platform includes intrinsic reports that display test/monitoring coverage across an end-to-end data analytics pipeline.
- Multi-Cloud – Most organizations support data pipelines that span multiple tools environments, such as on-prem and cloud. The DataKitchen Platform provides the important capability to test and deploy in multiple locations.
- Unify – With its holistic approach to the analytics lifecycle, the DataKitchen Platform keeps analytics code, data pipelines, and test code together as a unified whole. Updates made to one are performed in relation to and in synchronicity with the others.
With fine-grained instrumentation of your data pipelines and real-time alerts, the data team will be the first to know about a problem in analytics. With process lineage and all of the other artifacts that enhance observability, data engineers and scientists can quickly troubleshoot data issues and much more easily localize, diagnose and reproduce problems. Rapid response and resolution of data and analytics errors can also be an important element in building trust with business partners.
Conclusion
Adding data observability to your data factory can help reduce errors, eliminate unplanned work and minimize the cycle time of error resolution. A DataOps process hub, such as the DataKitchen Platform, provides a way to add observability to an existing data-analytics operation without forcing a migration to new toolchains. The DataKitchen Platform embraces your existing technical environments so that you can add fine-grained observability to your end-to-end data lifecycle. With fewer errors and much less unplanned work, the data team can focus on creating analytic insights. If you’ve been struggling with errors, DataOps observability offers the ability to upgrade your data pipelines so they execute as robust and efficient data factories.

