Part 2: Introducing Data Journeys
This is the second post in DataKitchen’s four-part series on DataOps Observability. Observability is a methodology for providing visibility of every journey that data takes from source to customer value across every tool, environment, data store, team, and customer so that problems are detected and addressed immediately. DataKitchen has released a version of its Observability product, which implements the concepts described in this series. (Part 1)
DataOps Observability to the Rescue
Jason knows he needs to implement changes, but what and where? The more he reads about DataOps, the more he knows his company needs to make the transition. He thinks he can sell his boss and the CEO on this idea, but his pitch won’t go over well when they still have more than six major data errors every month. He wonders what it would take to create a dashboard that could monitor his pipelines and alert him to potential problems or track negative trends before he gets the next dreaded call.
When considering how organizations handle serious risk, you could look to NASA. The space agency created and still uses “mission control” where many screens share detailed data about all aspects of a space flight. That shared information is the basis for monitoring mission status, making decisions and changes, and then communicating to all people involved. It is the context for people to understand what’s going on in the moment and to review later for improvements and root cause analysis.
Any data operation, regardless of size, complexity, or degree of risk, can benefit from DataOps Observability. Its goal is to provide visibility of every journey that data takes from source to customer value across every tool, environment, data store, data and analytic team, and customer so that problems are detected, localized and raised immediately.
The goal of DataOps Observability is to provide visibility of every journey that data takes from source to customer value across every tool, environment, data store, data and analytic team, and customer so that problems are detected, localized and raised immediately.
DataOps Observability does this by monitoring and testing every step of every data and analytic pipeline in an organization, in development and production, so that teams can deliver insight to their customers with no errors and a high rate of innovation. It relies on a hierarchy of data journeys, or representations of actual pipelines, that observe and track the processes within the end-to-end value chain of the data.
Data journey observability is the first step in implementing DataOps. It tackles the immediate challenges in your data operations by providing detailed information about what’s going on right now.
DataOps Observability Starts with Data Journeys
Jason considers his dashboard idea but quickly realizes the complexity of building such a system. It’s not just a fear of change. It’s because it’s a hard thing to accomplish when there are so many teams, locales, data sources, pipelines, dependencies, data transformations, models, visualizations, tests, internal customers, and external customers. “Too many moving parts,” he thinks, “but there has to be some way to prove things work before my customers see them!”
DataOps Observability works because it visualizes data journeys that span all of these moving parts, beginning with the people. Take four main constituents in your operations: production engineers, data developers, data team managers, and customers. They all have different roles and different relationships with the data. Data journeys give them all a shared context about data operations⸺what pipelines are running or will run, the status and quality of those pipelines, what development is in progress, and where it will be deployed.
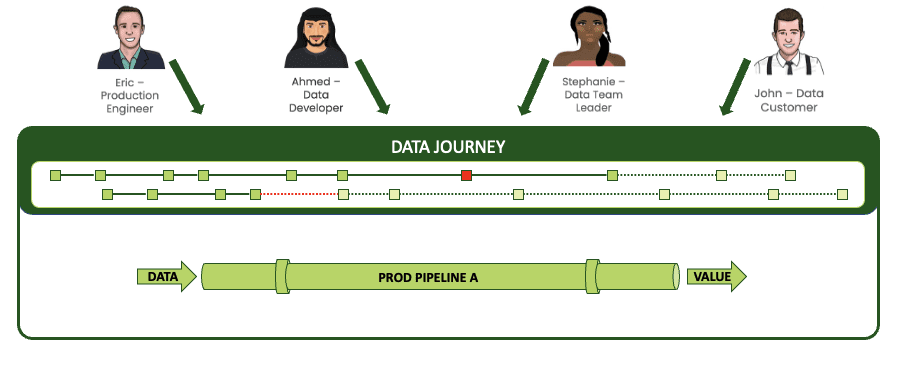
All constituents have a shared view of your data operation.
And when these stakeholders can see a shared view of a single pipeline, they know everything that’s happening during a run of that pipeline. The journey reveals all of the complex steps, toolchains, and actions within the data workflow⸺most importantly, where things go wrong.
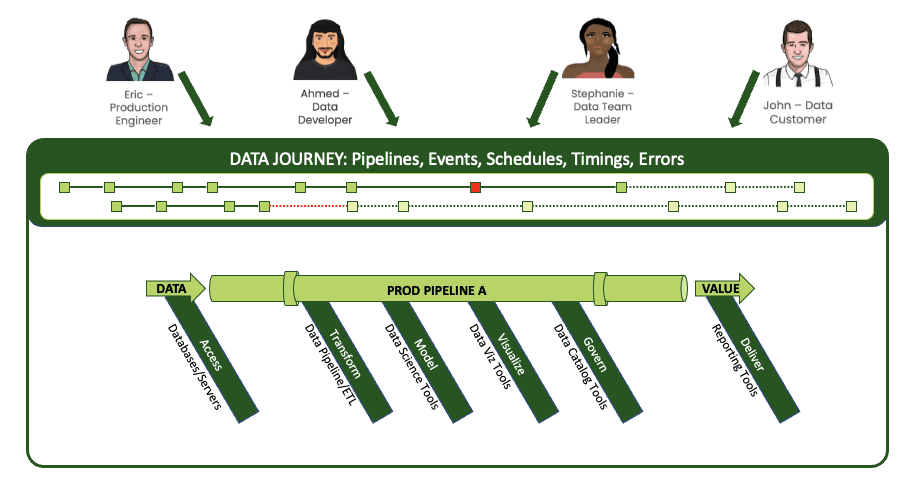
A journey spans complex steps and toolchains in every pipeline and signals failures.
For example, in a single data pipeline, you might have some FTP file sources that you ingest into S3 buckets. That data then fills several database tables. A Python model runs, and you deliver some Tableau extracts that publish to Tableau reports. Your “simple” pipeline involves a toolchain that features Fivetran, DBT, SQL, a Jupyter notebook, and Tableau. And to run everything, you use a wrapper like Airflow or a cron job, or a manual procedure. With DataOps Observability, you can integrate the full context of these elements into a data journey that monitors the stack.
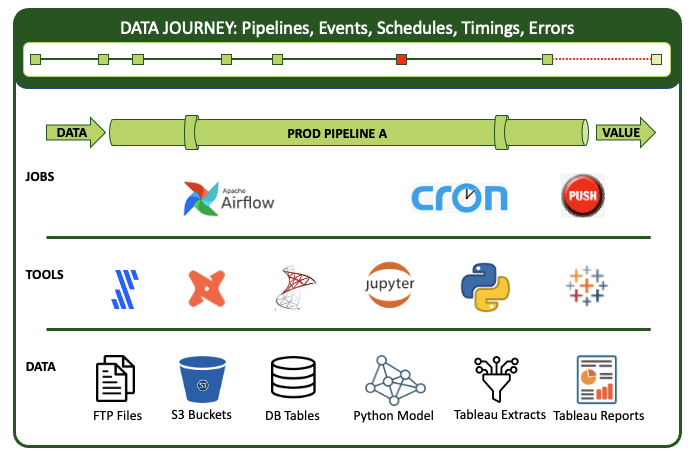
Journeys provide a context for the many complex elements of a pipeline.
The journey tracks all levels of the stack from data to tools to code to tests across all critical dimensions. It supplies real-time statuses and alerts on start times, processing durations, test results, and infrastructure events, among other metrics. And if you’re armed with this information, you can know if everything ran on time and without errors and immediately identify the specific parts that didn’t.
As valuable as this visibility is to this single pipeline and its users, most organizations have large numbers of pipelines that need this level of observation.
A Journey Maps and Observes Everything
Jason realizes that he’s developed something similar before. In his role in Marketing as a Customer Experience Manager, he built customer journey maps to track customer touchpoints with their brand and products. That effort guided improvements in their sales and marketing programs and produced a huge increase in customer engagement. So why can’t he do the same thing for the many journeys that his data takes from source to customer value?
DataOps Observability journeys are current and future representations of data stores, processes, pipelines, or groups of pipelines and their upstream and downstream dependencies.
Every data operation is a kind of factory, some with hundreds of pipelines, each made up of a combination of tools, technologies, and data stores. As a result, there are thousands of tools, and each tool has code that acts on the data in some way.
Even more challenging is the fact that these pipelines are anything but uniform. Some are batched, some are streaming, some are scheduled or triggered from a dependency, while some are entirely manual. And they all may have different deployment methods and environments. Further, the pipelines are owned and operated by very different teams in different departments within your company.
The good news is that a single data journey can span multiple related pipelines to track all of the data and analytic infrastructure within them.
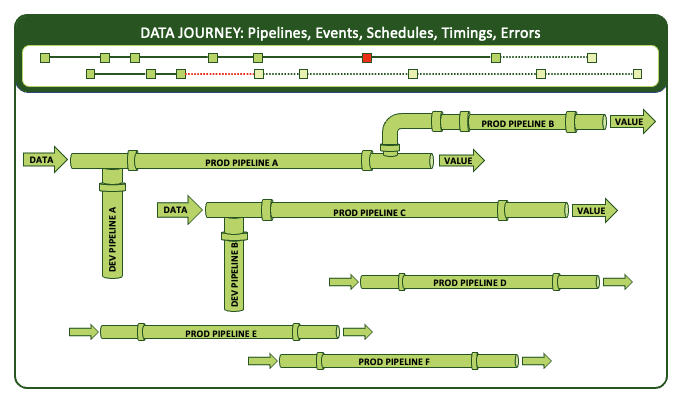
A data journey spans and tracks multiple pipelines.
A data journey can “see” all of this because it is a meta-structure that goes beyond typical test automation, application performance monitoring, and IT infrastructure monitoring software. While quite valuable, these solutions all produce lagging indicators. With these tools, you may know that you are approaching limits on disk space, but you can’t know if the data on that disk is correct. You may know that a particular process has been completed, but you can’t know if it was completed on time or with the correct output. You can’t quality-control your data integrations or reports with only some details.
Since data errors happen more frequently than resource failures, data journeys provide crucial additional context for pipeline jobs and tools and the products they produce. They observe and collect information, then synthesize it into coherent views, alerts, and analytics for people to predict, prevent, and react to problems.
No Journey Exists in a Vacuum
Jason takes a well-deserved break and meets up with his colleague Maria, Manager of Data Science, at the local coffee shop. He decides to run his data journey map idea by his friend. Maria listens carefully, nodding in agreement, then asks a question. “Will this help me know when my scientists are going to get new feeds of sales data from your engineers?” Jason frowns. What data feed? How did he not know about this downstream use?
This lack of visibility is why data journeys track and collect information across all levels of your organization. Starting small, they simplify the complex steps within pipelines. You can define journeys to represent the process “chunks” you truly care about, ignoring the noise of more granular details. Then expanding their scope, journeys also represent and track complex relationships among all your pipelines where no connections are currently coded. To accomplish this, you can set up relationships among the journeys themselves.
Imagine pulling together contexts from across the organization where data is shared, or processes are dependent on inputs and transformations.
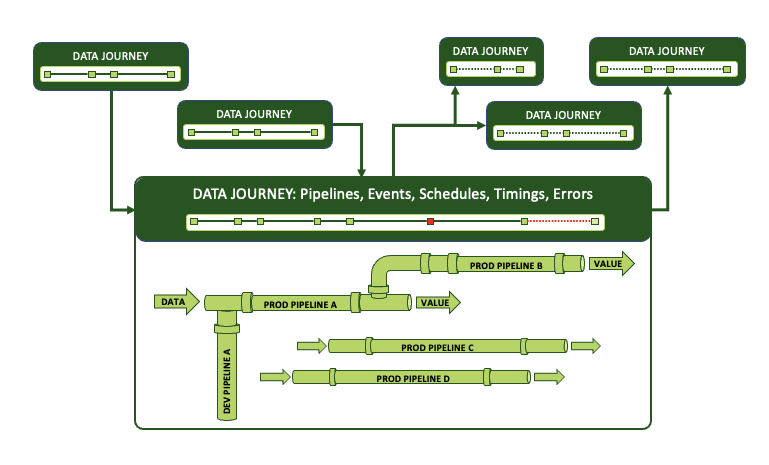
inks defined among journeys can organize and observe typically undocumented relationships.
So often, these relationships among data pipelines are tribal knowledge rather than concrete and actionable connections. But when there’s a problem, you need to know how these relationships could amplify it.
By identifying how pipelines connect via data dependencies and relate through shared data use across your data estate, you can build relationships among the representational journeys to reflect them.
- Build in causal connections, where one pipeline starts after another completes.
- Build in temporal connections, where two pipelines are scheduled to run separately but have dependencies. If the first is late finishing, there are problems.
- Build event-driven connections where streaming pipelines get data and run based on specific events.
- Build a fan-in relationship where those same event-driven pipelines finish at the end of the day, fill up S3 buckets, and build tables in Snowflake. Then another process takes those tables and builds a star schema, producing some reports.
- Build a sub-component relationship where you have a pipeline containing reusable sub-pipelines.
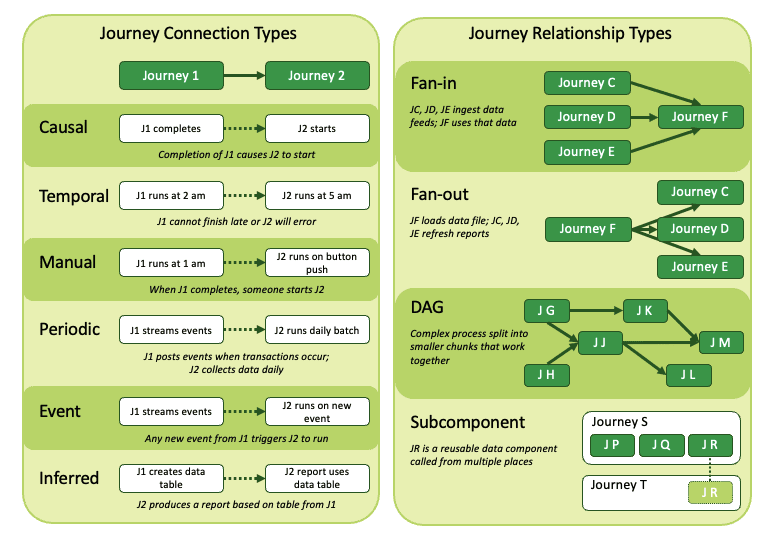
Journeys can map links among your pipelines that are not recorded elsewhere.
You have learned about the problems that DataOps Observability addresses in part one of this series. You have also understood how data journeys can help everyone visualize operations across an entire data estate in part two. Next, you can learn about the components of data journeys and what makes them effective in part three of our series, Considering the Elements of Data Journeys. (Part 1)

