Part 3: Considering the Elements of Data Journeys
This is the third post in DataKitchen’s four-part series on DataOps Observability. Observability is a methodology for providing visibility of every journey that data takes from source to customer value across every tool, environment, data store, team, and customer so that problems are detected and addressed immediately. DataKitchen has released a version of its Observability product, which implements the concepts described in this series. (Part 1) (Part 2)
Constructing Effective Journeys
As he thinks through the various journeys that data take in his company, Jason sees that his dashboard idea would require extracting or testing for events along the way. So, the only way for a data journey to truly observe what’s happening is to get his tools and pipelines to auto-report events.
An effective DataOps observability solution requires supporting infrastructure for the journeys to observe and report what’s happening across your data estate. Observability includes the following components.
- Functionality to set pipeline expectations
- Logs and storage for problem diagnosis and visualization of historical trends
- An event or rules engine
- Alerting paths
- Methods for technology/tool integrations
- Data and tool tests
- An interface for both business and technical users
Setting Expectations
In addition to the tracking of relationships and quality metrics, DataOps Observability journeys allow users to establish baselines⸺concrete expectations for run schedules, run durations, data quality, and upstream and downstream dependencies. Observability users are then able to see and measure the variance between expectations and reality during and after each run. This aspect of data journeys gives users real-time information about what is happening now or later today, and if data delivery will be on time or late. It can feed a report or dashboard that lists all datasets and when they arrived, as well as the workflows and builds that are running.
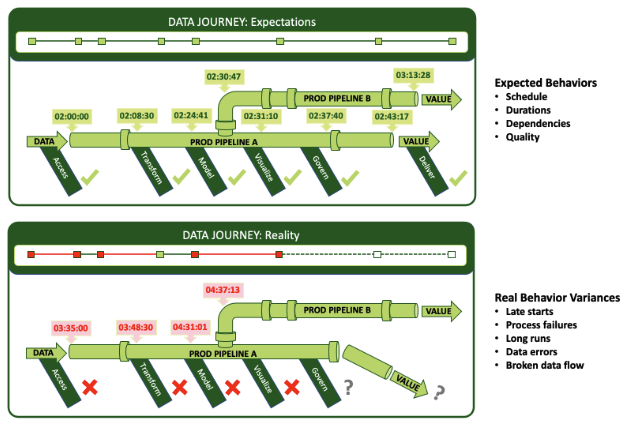
By setting process expectations, journeys can identify variances in each pipeline run.
With this information in a shared context, your analyst working on a data lake will know if the 15 datasets she is viewing are accurate, the most recent, or of the same date range. And she’ll know when newer data will arrive. She can work more efficiently knowing when to conduct her analyses and what delivery date to communicate to her customers.
Storing Run Data for Analysis
Real-time details are not the only purpose for setting and measuring against expectations. DataOps Observability must also store run data over time for root cause diagnosis and statistical process control analysis. It’s not just about what happens during the operation; it’s also about what happens after the operation. By storing run data over time, Observability allows your analysts to look at variances from a historical perspective and make adjustments. Finding trends and patterns can help your team optimize your data pipelines and predict and prevent future problems.
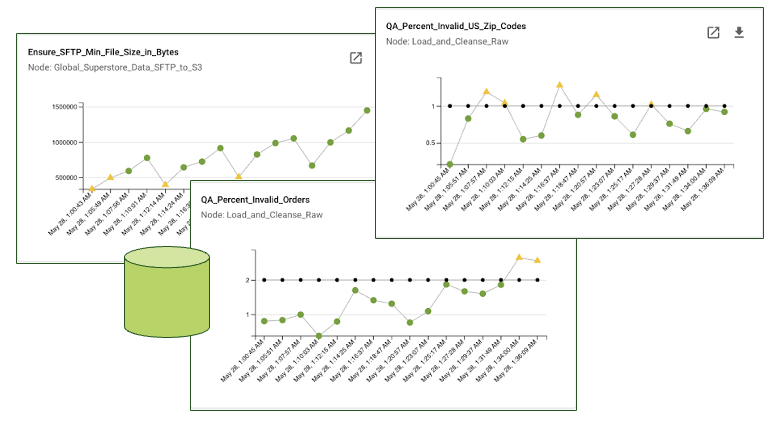
Storing data about your journeys allows you to analyze, learn, and predict.
Identifying Events and Actions
So DataOps Observability captures all this information and stores it in a database, but that is a lot of data that someone has to monitor and sift through. Fortunately, Observability includes an event engine that can react to what’s happening in the journeys and cut down the signal-to-noise ratio. Given a set of rules, the event engine can trigger notifications through email or to Slack and other services, send alerts to your operations people, issue commands to start or end pipeline runs, and prompt other actions when the difference between expected results and actual runs exceeds your thresholds of tolerance.
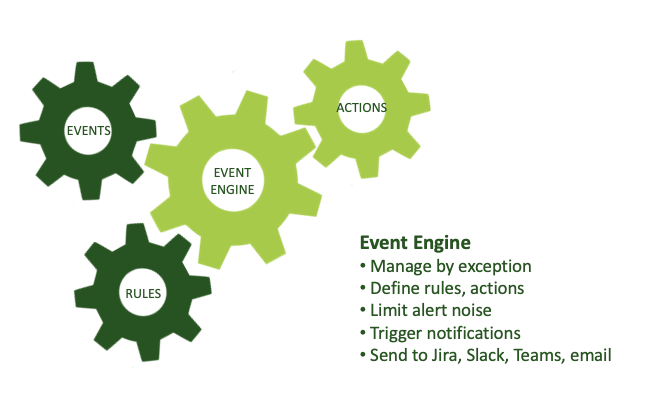
An engine drives events to various destinations from expectations in your Data Journey.
With this actionable data combined with an understanding of the bigger context of your data estate, you can empower your employees to stop production pipelines before problems escalate.
Alerting on all critical dimensions
While alerts on run schedules, durations, dependencies, and data tests are valuable, these metrics alone do not tell the whole story of every data journey. After all, pipelines execute on infrastructure, and that infrastructure has to be managed. To that end, DataOps Observability must also accept logs and events from IT monitoring solutions like DataDog, Splunk, Azure Monitor, and others. Observability can consolidate the information into critical alerts on the health of data pipelines, providing clear visibility into the state of your operations.
Integrating Your Tools
DataOps Observability has to support any number and combination of tools because your toolchain is potentially monumental and complex. With an OpenAPI specification, DataOps Observability can offer easy connections. Even better, pre-built integrations with your favorite tools make it simple to start transmitting events to and receiving commands from Observability right away.
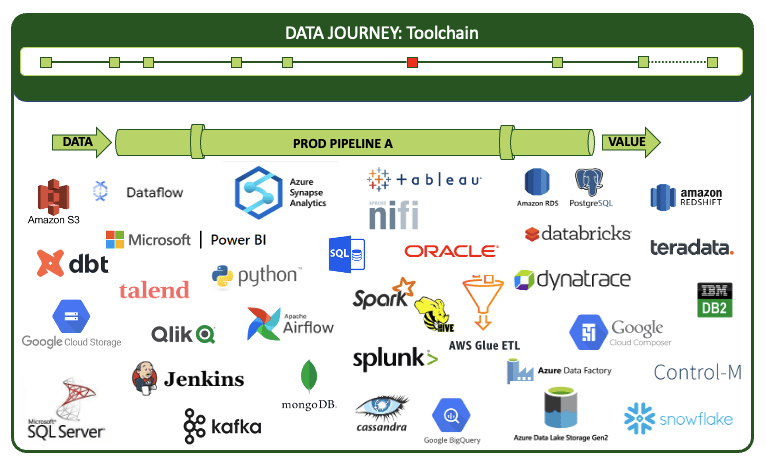
DataOps Observability integrates with all technologies in your entire toolchain.
Testing at Every Step
You want to track more than the schedule and duration of your runs. You want to check that the contents of your pipelines⸺the data, the models, the integrations, the reports, and the outputs that your customers see⸺are as accurate, complete, and up to date as expected. You want to find errors early. To do that, your journeys need to include automated tests.
Tests that evaluate your data and its artifacts work by checking things like data inputs, transformation results, model predictions, and report consistency. They run the gamut from typical software development tests (unit, functional, regression tests, etc.) to custom data tests (location balance, historical balance, data conformity, data consistency, business logic tests, and statistical process control). Read more about DataOps testing in A Guide to DataOps Tests or Add DataOps Tests for Error-Free Analytics.
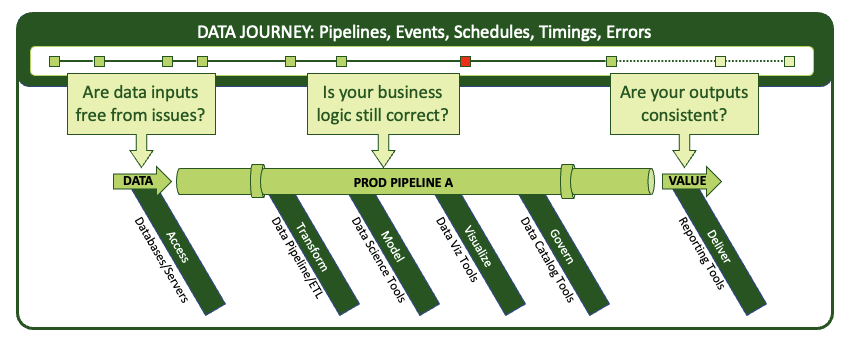
Add automated tests at every step in a pipeline and transmit results to the event engine in the Data Journey.
Your organization already has many sources of tests, which can transmit vital information to data journeys with rules for taking action. You may have a database with its own test framework, your data engineers may have written some SQL tests, your data scientists may have written Python tests, you may have test engineers writing Selenium test suites, you may be using DataKitchen DataOps Automation for testing. All usable information.
Packaging it in a Friendly, Flexible UI
Finally, DataOps Observability must make it easy for multiple types of constituents to monitor what affects their jobs. Your production engineer needs to check on operations. Your data developers need to verify that the changes they make are working. Your data team manager needs to measure her team’s progress. Your business customer needs to know when the analytics will be available for his projects. They all require different views of the same data.
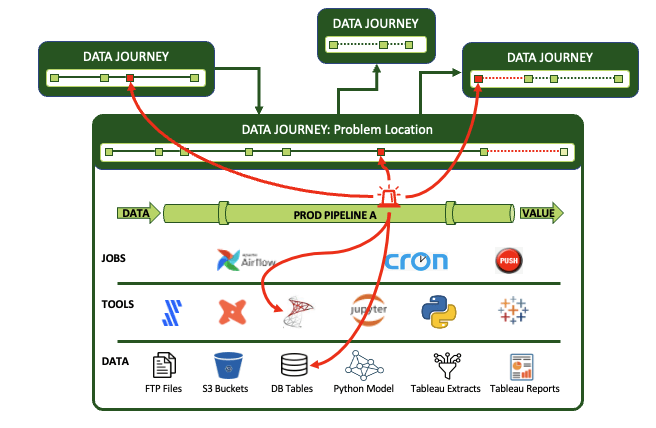
DataOps Observability has to provide interface views based on differing roles. The greatest benefit of the Observability UI is that it can reveal the breadth of a data estate with the elements and relationships vital to any given stakeholder. And at the same time, it offers a way to plumb the depths of the complex layers of any pipeline to locate problems. It serves as a springboard for investigating and fixing issues with insight into where those issues may reverberate across the enterprise.
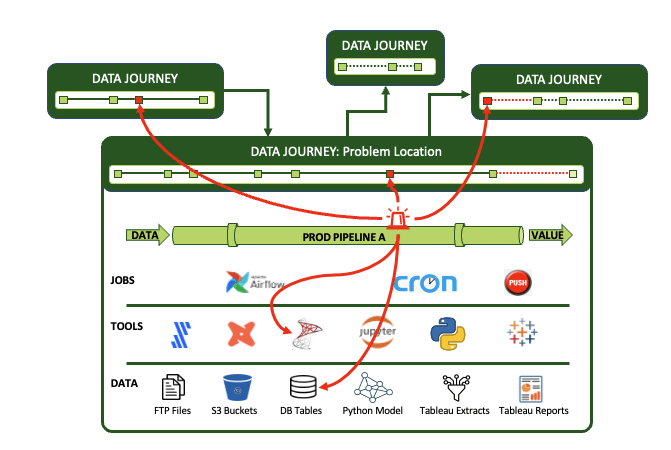
DataOps Observability reveals the breadth and depth of a pipeline problem.
Together, the journeys, the expectations, the data store, the event engine, the rules and alerts, the integrated tools, the tests, and a robust interface all enable complete observability. All of these elements come together to inform you of where the problems are, minimize the risk to customer value, provide a shared context for all constituents to know what’s happening and what’s going to happen, and alert the right people when something goes wrong.
You have learned about the problems that DataOps Observability addresses in part one of this series. You have also understood how data journeys can help everyone visualize operations across an entire data estate in part two. In part three, you examined the components of effective data journeys. In the final part of this series, you can take away a summary of what DataOps Observability can offer your organization in Reviewing the Benefits. (Part 1) (Part 2)
