Introduction. How to measure your data analytics team?
So it’s Monday, and you lead a data analytics team of perhaps 30 people. You’ve got a new boss. And she is numbers driven – great! But wait, she asks you for your team metrics. Like most leaders of data analytic teams, you have been doing very little to quantify your team’s success. All you had to do was write a few bullet points every week for your last boss. It’s your first leadership meeting, and she gives you this look – where are my numbers?
At DataKitchen, we have talked with many CDOs, data leaders, and other data team managers, and they have, ironically, been very un-analytic about how they run their teams. Bullet points and bravado seem to be the norm. You spend all day helping your customers leverage analytics for improved business performance, so why are you so un-analytic about how you run your data analytics teams? Where is your metrics report?
What should be in that report about your data team? What should I track? What are the metrics that matter?
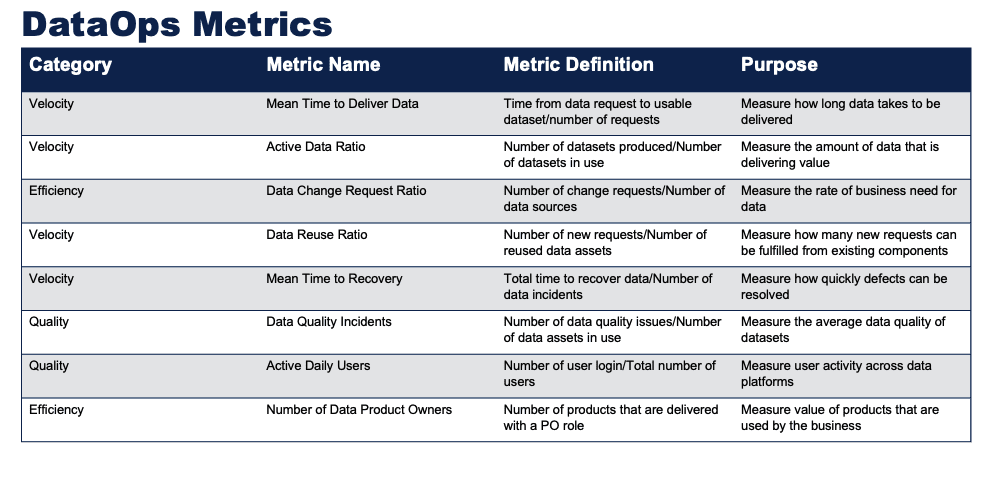
Gartner attempted to list every metric under the sun in their recent report, “Toolkit: Delivery Metrics for DataOps, Self-Service Analytics, ModelOps, and MLOps,” published February 7, 2023. It lists dozens of metrics to track across their operational categories: DataOps, Self-Service, ModelOps, and MLOps. Forty-five metrics! For example, Gartner’s DataOps metrics can be categorized into Velocity, Efficiency, and Quality. Under Velocity, the Mean Time to Deliver Data metric measures the time it takes to deliver data. The Active Data Ratio metric determines the percentage of datasets that deliver value. The Data Change Request Ratio metric measures the rate of business demand for data. The Data Reuse Ratio metric calculates how many new requests can be fulfilled from existing components. The Mean Time to Recovery metric measures how quickly defects can be resolved. Under Efficiency, the Number of Data Product Owners metric measures the value of the business’s data products. Under Quality, the Data Quality Incidents metric measures the average data quality of datasets, while the Active Daily Users metric measures user activity across data platforms.
Other data leaders have tried to adapt the IT/software incident metrics world to the data world. IT incident metrics are used to evaluate the reliability and efficiency of a system or process. MTBF (Mean Time Between Failures) is the average time between system or process failures. MTTR (Mean Time to Repair) is the average time to repair a failed system or process. MTTA (Mean Time to Acknowledge) is the average time it takes for a team to acknowledge an incident once it has occurred. MTTF (Mean Time to Failure) is the average time until a failure occurs, assuming that the failure is non-repairable. These metrics help organizations identify areas for improvement in their software systems and processes and can be used to set goals for reducing downtime and increasing system availability. The challenge with these metrics is that software failure is often more discrete – your application or website is up or down. But what about a Data Journey constructed from multiple data engineering tools, servers, data sets, and dashboards? And is a small data error affecting one data sales region a failure? To that specific user, it is. Just because the infrastructure appears to be working in data systems does not mean users will not see problems.
Data systems require trust. And trust comes from having low errors. And your team getting things done.
Just Track Four Things.
Here are a set of simple, general key performance indicators (KPIs) that can be used to evaluate the performance of a data analytics team. Organizations can concentrate on two critical “down” metrics (errors and cycle time) and two “up” metrics (productivity and customer satisfaction) to effectively measure the performance of their data analytics teams.
Metric Number One: Errors
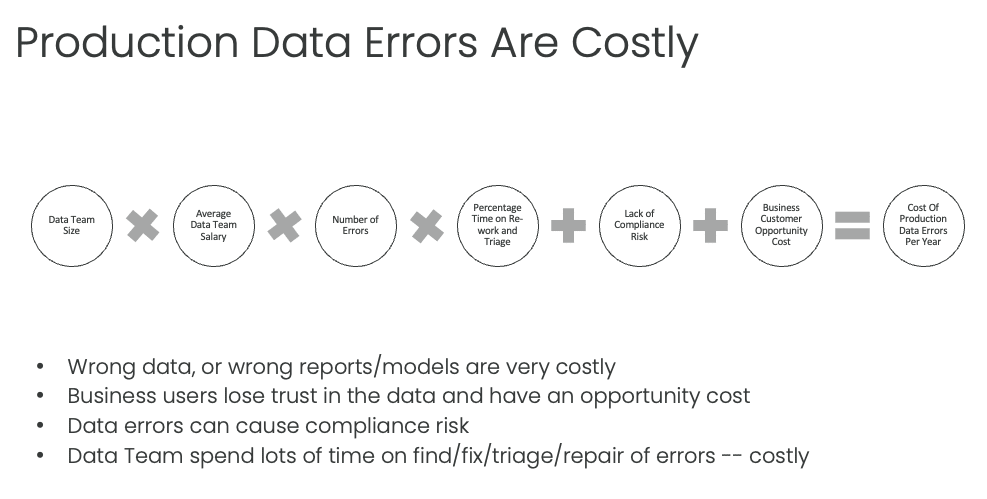
Reducing errors in data analytics is crucial for ensuring the accuracy and reliability of the insights generated by the team. Errors can originate from various sources, including data collection, integration, models, visualization, governance, and security. Organizations will make better-informed, data-driven decisions by minimizing errors and avoiding the negative consequences of relying on inaccurate information. Automated techniques can track errors. Automated data test tools can help identify data entry errors or processing errors.
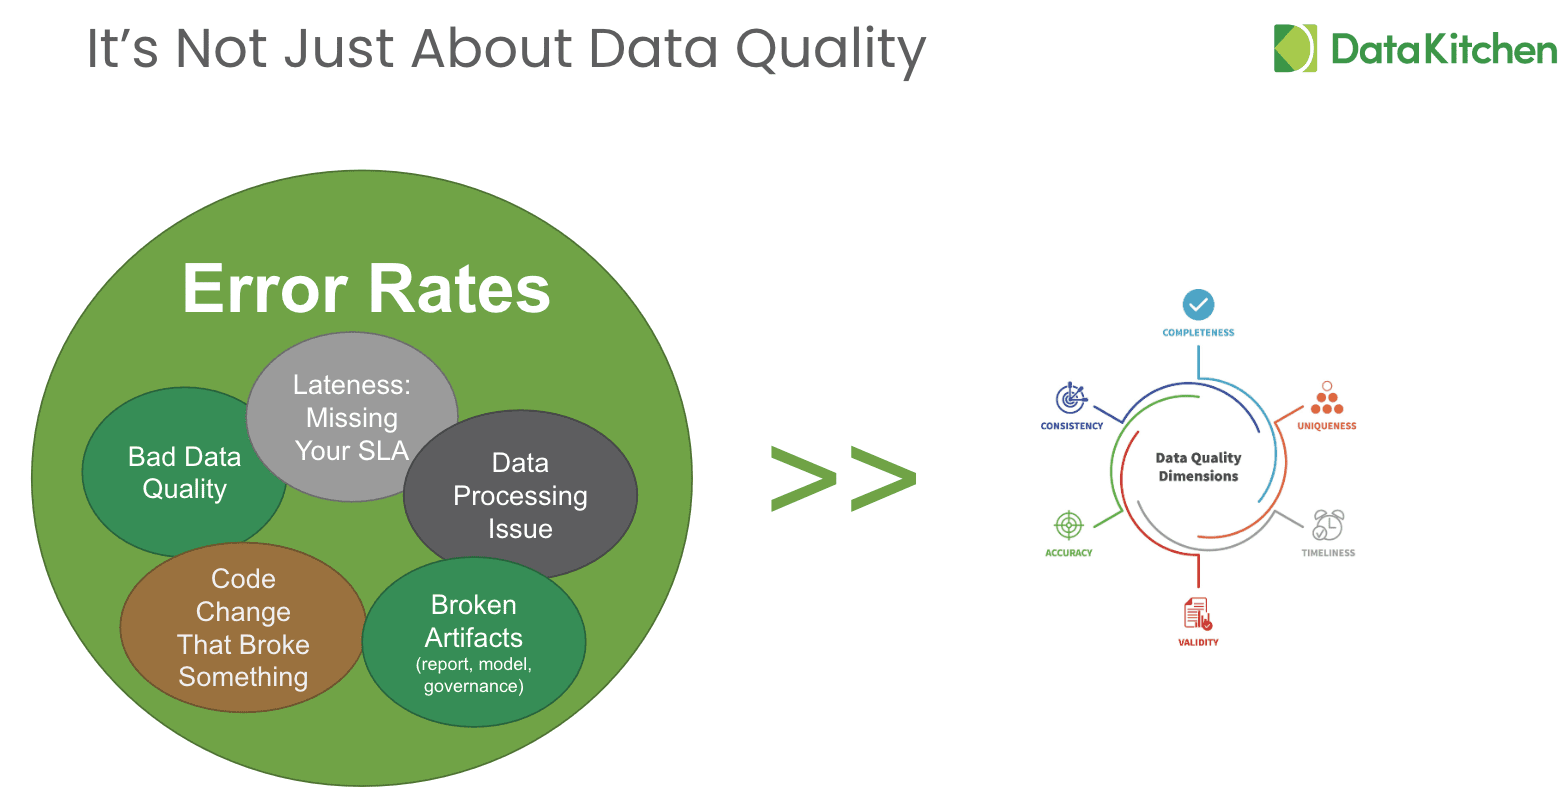
But what are errors? Look at the world from your customer perspective – the dashboard is wrong, the data is late, or the numbers ‘look funny.’ All of these items are errors in their eyes. Those errors can come from many sources
- Bad raw data in the analytic process
- Some processing errors during the data production process
- Some new code/config acting upon data produces a problem
- Being late and missing an SLA (or performance/speed)
- Broken Artifacts – the data is right, but the tools acting upon the data (such as the model or report) show incorrect amounts.
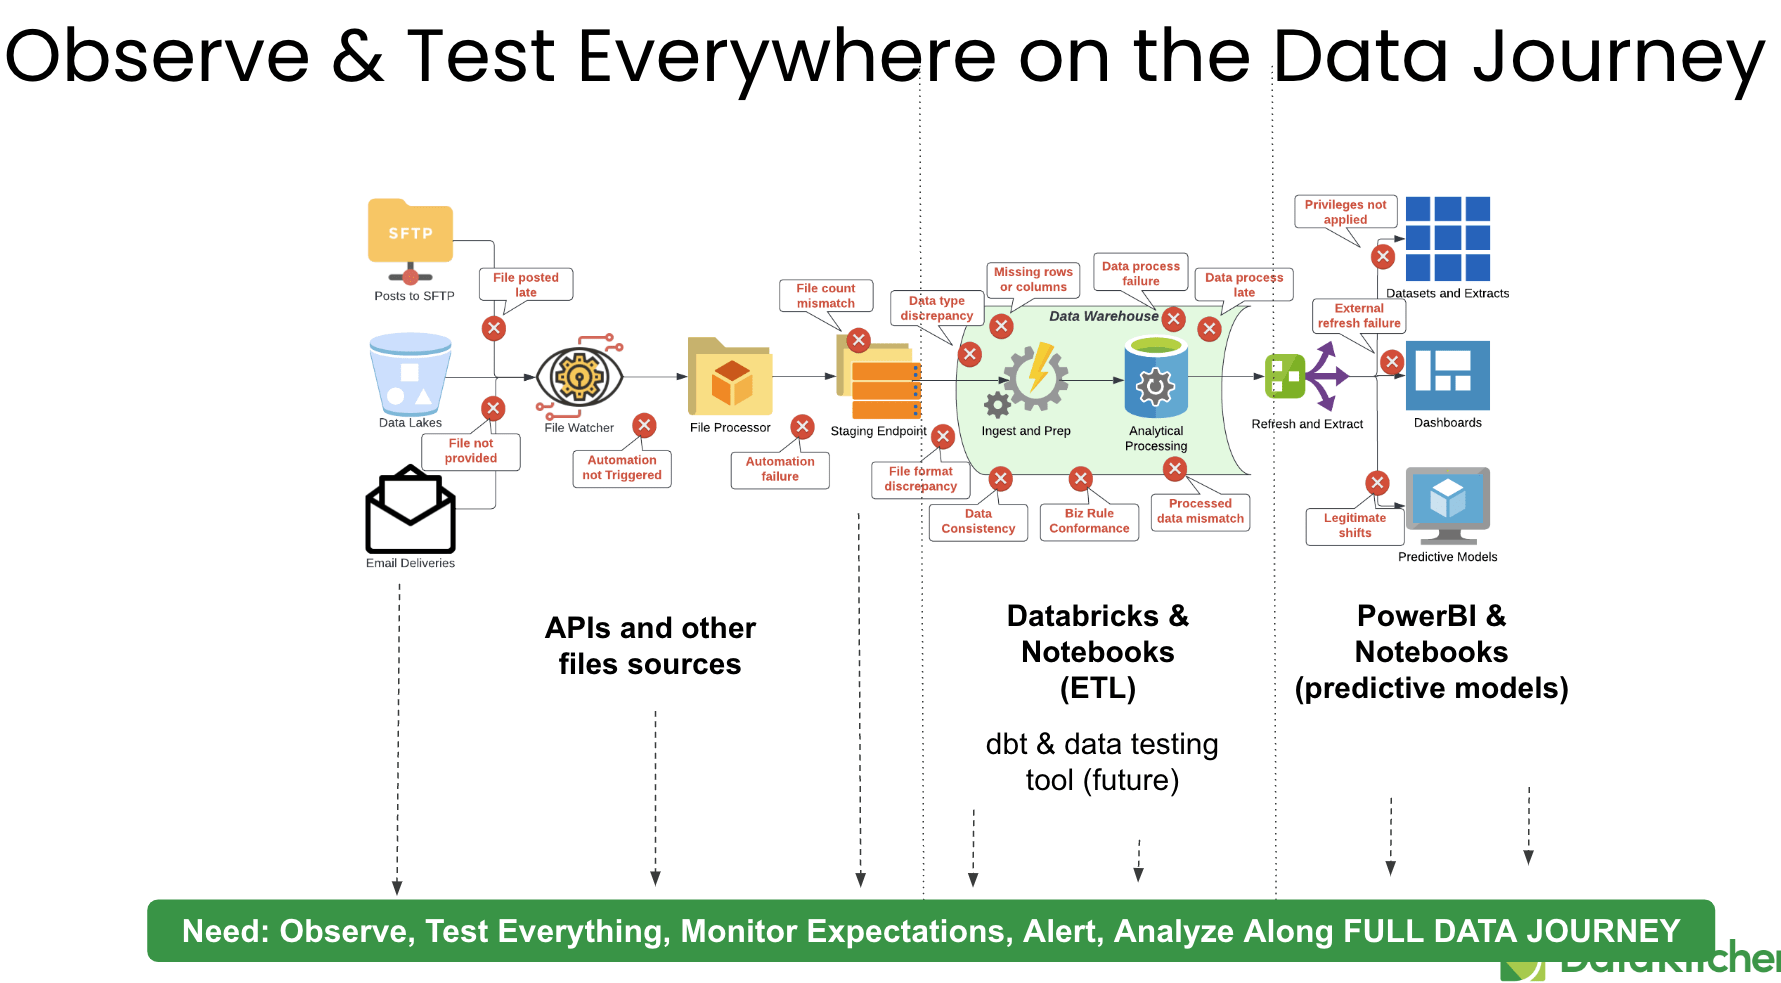
Where do you find errors? Look for errors everywhere in your Data Journey. Find the problems fast, notify the right person, and drive the person responsible for fixing the problem to the source of the error quickly. Use tools like DataKithchen DataOps Observability to build and watch your Data Journeys.
There are four main benefits of reducing errors. More Innovation – Reducing errors eliminates unplanned work that pulls data team members from their high-priority analytics development tasks. An enterprise cannot derive value from its data unless data scientists can stay focused on innovation. More Trust – Errors undermine trust in data and the data team. Less confidence means less data-driven decision-making; in other words, emotionally-biased decision making. Less Stress – Errors can occur at any moment. The feeling of continuous anxiety is unhealthy for team members and reduces their ability to relax and enjoy their work. Happy and relaxed people think more clearly and creatively. Less Embarrassment – Errors in data analytics tend to be very public. When data errors corrupt reports and dashboards, it can be extremely uncomfortable for the manager of the data team. As embarrassing as having your mistakes highlighted in public, it’s much worse if the errors go unnoticed. Imagine if the business makes a costly and critical decision based on erroneous data.
Metric Number Two: Cycle Time
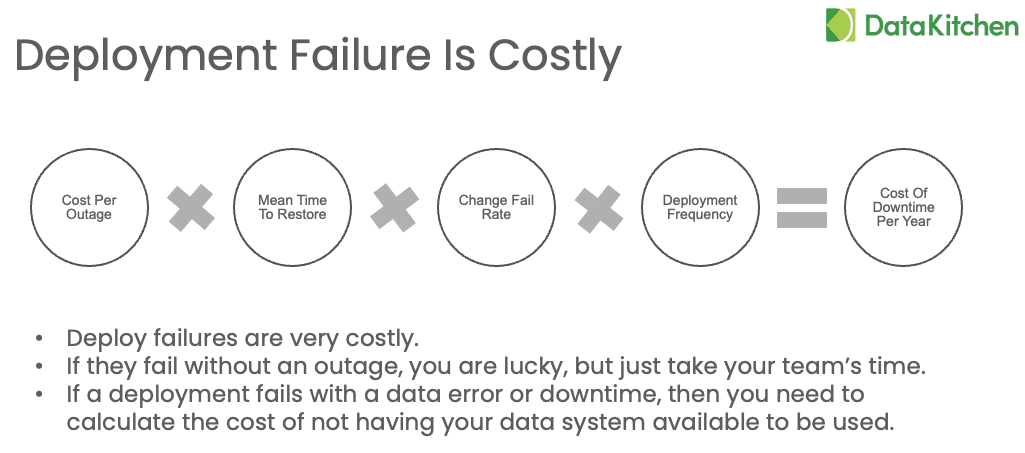
In today’s fast-paced business environment, the ability to quickly deploy new data and analytics solutions has become increasingly important for organizations seeking to maintain a competitive edge. Cycle time, or the duration from initiating a data analytics task to its completion and deployment, is a critical metric affecting an organization’s ability to generate insights and make data-driven decisions. A shorter cycle time enables a more agile decision-making process and allows organizations to capitalize on emerging trends or opportunities.
What is the significance of cycle time in data analytics deployment? A shorter cycle time enables organizations to quickly identify and act upon opportunities or challenges, granting them a competitive advantage in their respective industries. Rapid deployment of data and analytics solutions ensures businesses can stay ahead of their competitors and capitalize on emerging trends. As a result, businesses can adapt their strategies and operations more effectively, ultimately improving their overall performance. By reducing wasted time through minimizing cycle time, organizations can optimize their resource allocation, ensuring that data analysts, data scientists, and other stakeholders can focus on high-impact projects and maximize their contributions to the organization’s success.
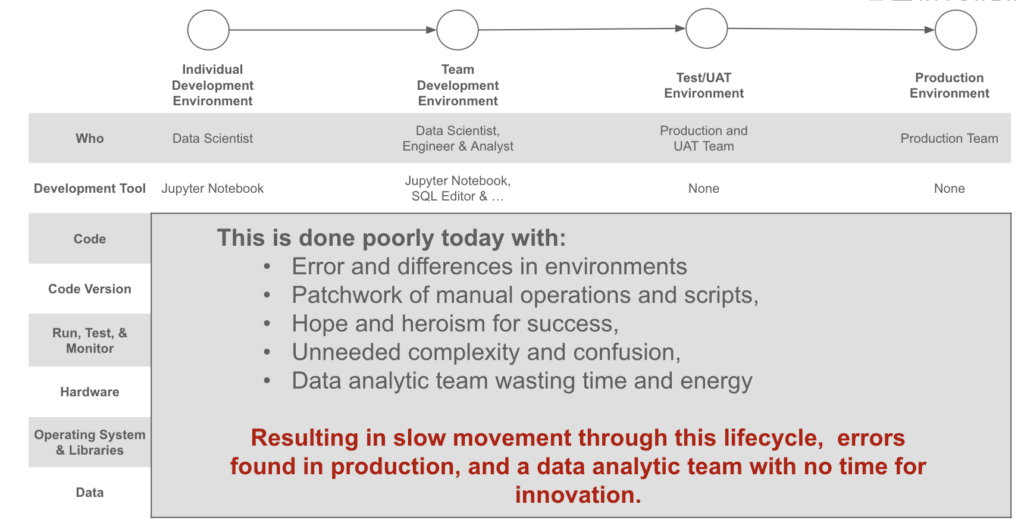
The first part of cycle time is the speed of deployment from development into production and use by your customer. Follow the first several principles of the DataOps Manifesto: get something in your customer’s hands and accept feedback to maximize your team’s learning. To do this, your team must create a high-quality train track’ to deploy your new code/config/data between environments. Deployment methods include an automated process like ‘CI/CD’ or a more functional “Blue-Green” test approach. Either way, part of your cycle time measurement is speed to deploy.
However, it is not just the speed at which you can deploy some new SQL, a new data set, a new model, or another asset from development into production. It is the enabling of deployment with low risk as well. You would not run a train through a busy city without signals at every intersection. Likewise, automated testing based on good test data in a representative technical environment with source code taken from a versioned repository is key. You want to enable your young data developers to make a small change in a big, complex system and automatically, without any manual intervention, have the system tell them that it will have the expected impact on production.
Organizations can adopt Agile methodologies, such as Scrum or Kanban, to reduce cycle time, which promotes iterative development, continuous feedback, and flexible planning. Additionally, investing in data testing and observability and implementing DataOps principles can help streamline data workflows and reduce the time it takes to complete data analytics projects.
Continuous time to deploy new data and analytics is a critical metric impacting an organization’s ability to generate insights and make data-driven decisions. By understanding the factors affecting cycle time and implementing strategies to reduce it, organizations can accelerate the delivery of valuable insights, gain a competitive advantage, and optimize resource waste.
Metric Number Three: Team Productivity
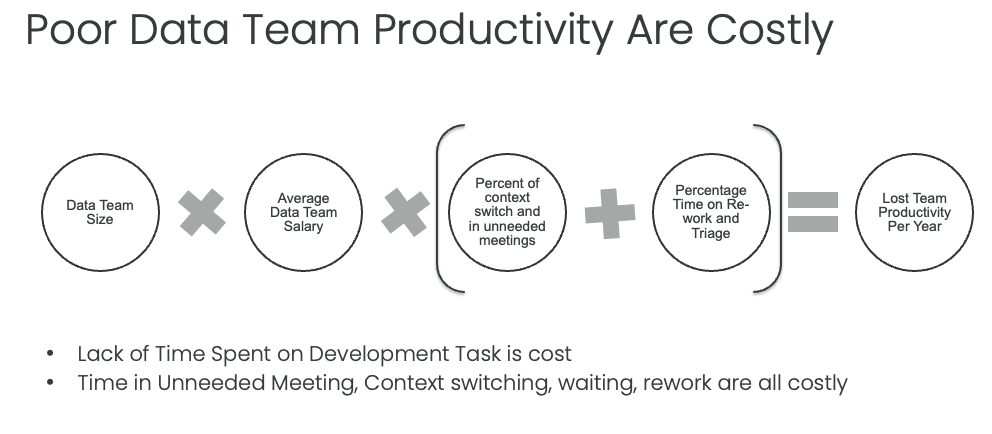
Increasing the productivity of a data analytics team allows organizations to generate more valuable insights with the same or fewer resources. A highly productive team can efficiently prioritize and execute high-impact projects, ultimately contributing to the organization’s overall success. Tracking and monitoring productivity is essential for a data analytics team. It helps optimize team performance and ensures that the team’s work aligns with the organization’s strategic goals.
Unfortunately, many teams do not track the amount of work they do. In one recent survey, a CDO asked his team how they spent their time. Why were they not getting anything new done? He found that over 60% of their time is not doing value-added work. They are waiting, blocked, re-doing work already done, fixing errors, etc.

How does one track a team’s productivity? Productivity can be measured using metrics such as the number of projects completed per team member, the percentage of projects completed on time, and the estimated ROI of each project. However, more agile ways of tracking productivity are better. A simple way is the idea of a ‘story point.’ Story points measure the complexity and effort required to complete a particular task or user story in agile development. While they are often used to estimate the amount of work needed for a sprint or release, they are great for tracking productivity.
To use story points to track productivity, you first need to establish a baseline velocity, which is the average number of story points your team completes in a given sprint. You can use this baseline velocity as a reference point to measure how much work your team completes over time. For example, if your team’s baseline velocity is 20 story points per sprint, and they complete 25 story points in the next sprint, you can infer that they were more productive than usual. Similarly, if they completed only 15 story points in the following sprint, you can infer that they were less productive than usual. By tracking your team’s velocity over time, you can gain insights into their productivity and identify trends or patterns that may help you improve your processes or identify areas for improvement. It’s important to note that story points are not a perfect measure of productivity. They are subjective and can vary depending on the team’s experience and understanding of the task. However, they can still be useful tools for tracking and improving agile data analytics development productivity.
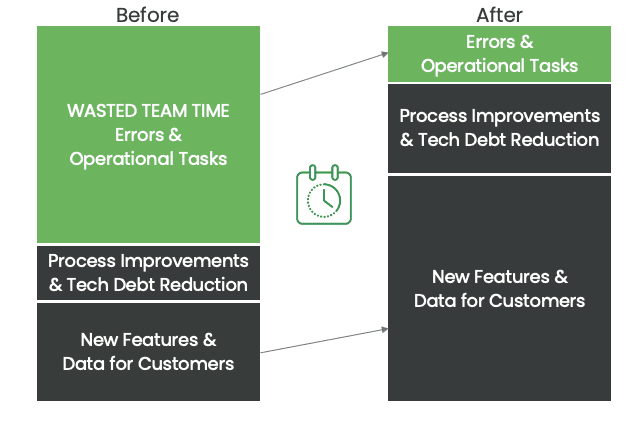
Where is productivity lost? A typical view is that my team is just slow to do their job. It takes them too long to write SQL, python, or make a dashboard. Surveys from Gartner, Eckerson, and others show that waste is the biggest impact on productivity. Reducing waste is a core principle of lean manufacturing, which aims to create more efficient and effective processes while minimizing costs and resources. In lean manufacturing, waste refers to any activity or process that does not add value to the final product. There are many more sources of time waste in a data team, for example, excess team meetings. All sources of waste can be rolled up into the error and cycle time metric. Data teams are full of wasted time and rework.
Given today’s economy, a key question that data teams leaders are asking is how to increase the total amount of data analytics insight generated without continually adding more staff (and cost). The answer lies in tracking productivity and reducing the amount of wasted time. Data leaders are learning that their teams are not very efficient or effective. Where is the problem? Is it in lots of re-work, delays, excess meetings, and context switching? Is it in the fact that teams ‘throw their work over the wall and hope it works in production? Or is it in the loss of time for the team to rush to fix things when they break?
Metric Number Four: Customer Satisfaction
Ensuring high levels of customer satisfaction is essential for demonstrating the value of a data analytics team to internal and external stakeholders. Satisfied customers are more likely to continue using the team’s services, provide positive feedback, and advocate for the team. Consistently delivering high-quality work on time and within budget can increase stakeholder trust and satisfaction, ultimately contributing to the organization’s success. Data trust is imperative.
As we noted in a recent blog, the real problem in data analytics is that teams need to deliver insight to their customers without error, put new ideas into production rapidly, and minimize their ‘insight manufacturing’ expenses … all at the same time. Customer expectations are high for your team. And don’t be surprised if you find your customer is not happy with the state of data analytics in your organization. For example, in a recent CDO survey, less than half of the organizations – 40.8% — report successfully using analytics. A meager 23.9% of companies report creating a data-driven organization. A dismal 20.6% of organizations state they have established a data culture.
Measuring customer satisfaction for a data team is vital for several reasons. Firstly, it helps the team understand how well they are meeting the needs and expectations of their customers, which can inform their priorities and strategies going forward. Secondly, it can help identify areas for improvement and potential pain points in the data team’s processes or services. Finally, it can also build customer relationships and demonstrate the value of the data team’s work.
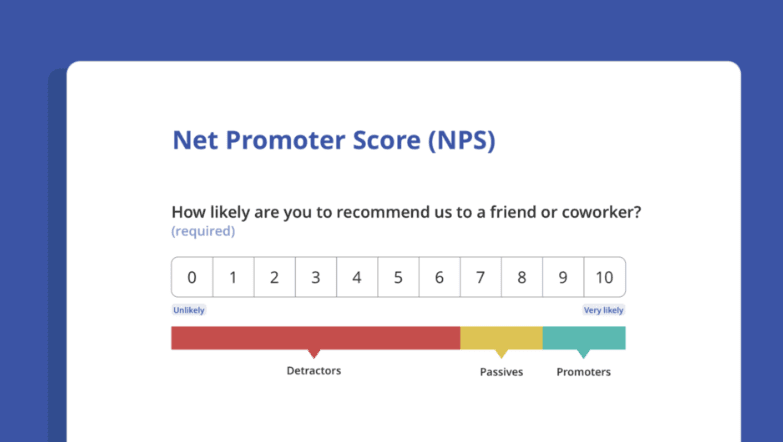
The data team can use various methods to measure customer satisfaction, including surveys, feedback forms, interviews, and user testing. These methods can help the team gather quantitative and qualitative customer satisfaction data. For example, a survey could ask customers to rate their satisfaction with the data team’s services on a scale of 1 to 10 and provide space for open-ended feedback on what the team is doing well and what could be improved. An interview could involve asking customers about their experiences working with the data team and exploring areas where they have had difficulties or frustrations. Once the data team has gathered customer feedback, they can use it to identify areas for improvement and make changes to their processes or services as needed. They can also share the results with their customers and other stakeholders, demonstrating that they listen and respond to feedback.
Measuring customer satisfaction is an integral part of building a successful data team. It can improve the team’s processes and services, build relationships with customers, and demonstrate the value of the team’s work.
Which metrics should I use, exactly?
The world of team metric measurement is confusing. As we previously discussed, Gartner recently published dozens of metrics to track for data teams, and software engineering has its metric world. DORA Metrics, Flow Metrics, and IT/Software Incident Metrics are different metrics used to measure various aspects of software development, deployment, and operations.
- Gartner Data/Model/MLOps Metrics: Gartner states that effective metrics for data and analytics delivery teams should focus on reducing problems and delays caused by code, data, and model defects and drift. To achieve this, teams should map their entire value stream, from product initiation to delivery, to identify areas for improvement and reduce lead times while improving quality. This value stream map can also help to reduce the cost of handovers between DataOps, ModelOps, and MLOps processes and functions.
- DORA Metrics, which stands for “DevOps Research and Assessment,” were developed by a team of researchers to measure the performance of DevOps teams. These metrics focus on four key areas: delivery throughput, deployment frequency, change failure rate, and mean time to restore (MTTR). DORA Metrics are designed to provide a holistic view of the performance of a DevOps team and can be used to identify areas for improvement and track progress over time.
- Flow Metrics are a set of metrics used to measure workflow through a software development process. These metrics help teams identify bottlenecks and inefficiencies in their workflows and optimize their processes to improve throughput and quality. Flow Metrics typically include lead time, cycle time, and work in progress (WIP).
- IT/Software Incident Metrics are used to track and measure incidents that occur in software development and operations. These metrics can include the number of incidents, severity, time to resolution, and the mean time between failures (MTBF). IT/Software Incident Metrics are designed to help teams identify trends and patterns in incidents and take action to prevent them from occurring in the future.
While these metrics are all related to software or data development and operations, they each focus on different aspects of performance and can be used to answer different questions. DORA Metrics focus on the overall performance of a DevOps team, Flow Metrics focuses on the flow of work through a process, and IT/Software Incident Metrics focus on the occurrence and resolution of incidents. Gartner focuses on the unique characteristics of data and data production. Each metric type is useful in its own right, and teams may use a combination of these metrics to gain a more comprehensive understanding of their performance. However, these various metrics can be seen as rolling into our four categories in the table below. They can be used as subcomponents to help quantify the four main metrics described in this blog post.
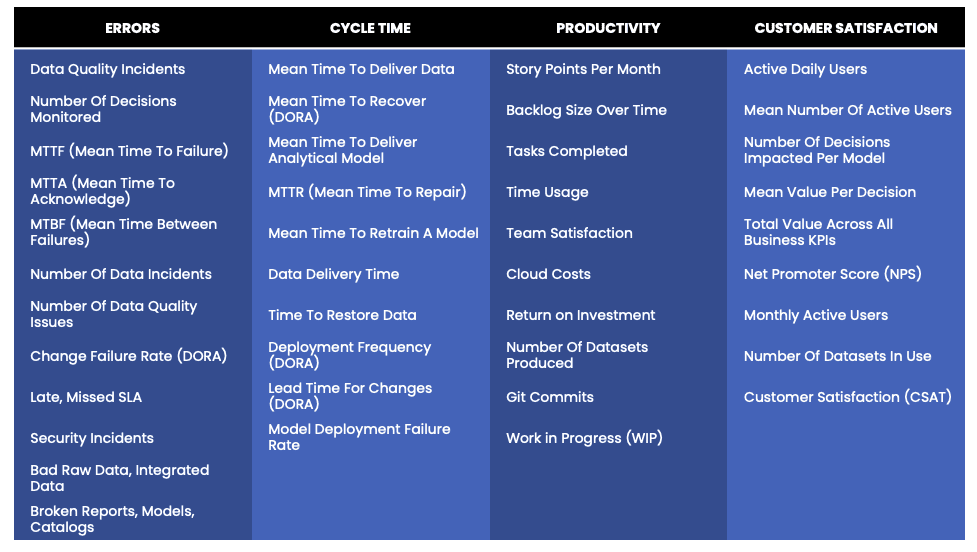
Two Downs Make Two Ups: the relationship between errors and cycle time to productivity and customer satisfaction.
The concept of “Two Downs Make Two Ups” means that there is a relationship between errors and cycle time and their impact on productivity and customer satisfaction. The idea is that when errors and cycle time are lowered, there is an increase in productivity and customer satisfaction.
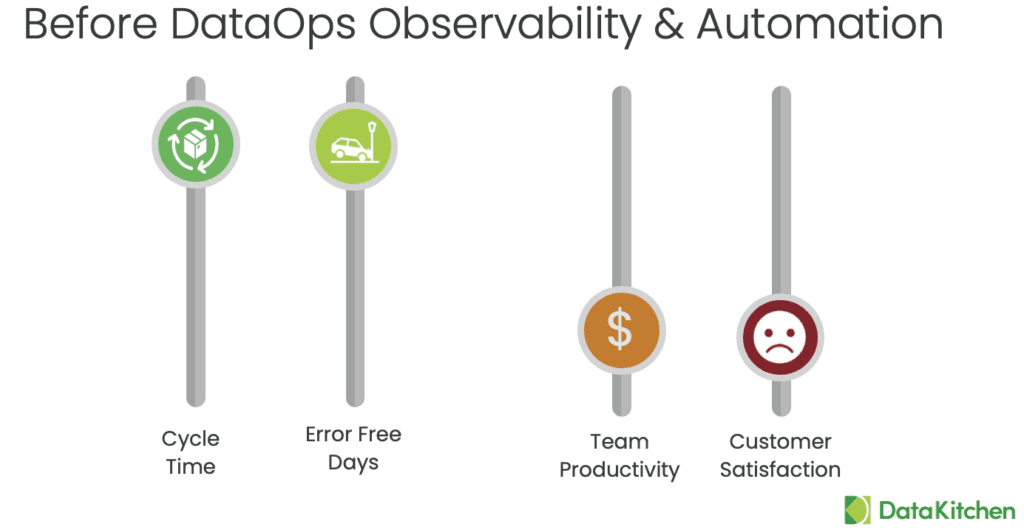
Errors can be anything from mistakes made in data entry to issues with code to a server going down and can significantly impact productivity and customer satisfaction. When errors occur, it can lead to delays in completing work and reduced quality of work produced. This can, in turn, lead to decreased customer satisfaction, as customers need to receive the level of service they expect.
Cycle time is when it takes for a deployment process to be completed, from start to finish. The longer the cycle time, the more time it takes to complete work, leading to decreased productivity and increased costs. By reducing cycle time, teams can complete work more quickly and efficiently, increasing productivity and cost savings.
By reducing errors and cycle time, teams can improve productivity and customer satisfaction. For example, by implementing DataOps Observability, quality testing measures, and using automation tools, teams can reduce the likelihood of errors occurring. Complete the new work correctly the first time, reducing the need for rework and delays.

Data teams are full of wasted time and rework. Customers are more likely to be satisfied when they receive their products or services promptly and feel that they can trust the results.
In summary, “Two Downs Make Two Ups” highlights the importance of reducing errors and cycle time to increase productivity and customer satisfaction. By focusing on these critical areas, teams can improve the quality of their work, complete tasks more efficiently, and deliver better results to their data customers.
Are you looking for help in tracking and improving these metrics? The principles of DataOps enabled via DataOps Observability and Automation are keys to unlocking this challenge. DataKitchen’s scalable software accelerates your path to measuring and accelerating your way to improving these metrics.
