Why a DataOps Approach to Data Quality: Data Quality Challenges
Data quality is more critical than ever in the age of artificial intelligence (AI) and when organizations are ‘competing with data.’ As teams handle increasingly vast amounts of data, the demand for accuracy, consistency, and reliability in data sources has risen. Despite advancements in data management technologies, a significant gap persists in ensuring data quality. According to dbt Labs’ 2024 State of Analytics Engineering survey, 57% of respondents rated data quality as one of the top three most challenging aspects of the data preparation process, a sharp increase from 41% in 2022. This statistic highlights an important reality: data quality is not merely an operational problem but a strategic imperative.
Moreover, IDC reports that 73% of data practitioners do not fully trust their data, signaling deep-seated issues with the reliability of organizational data. This mistrust directly impacts decision-making processes across departments. Forrester’s research adds another layer of urgency, estimating that millions were lost in 2023 due to poor data quality, with the potential for these losses to escalate into billions as AI becomes more integral to business operations. Without a concerted intervention, the symbiotic relationship between AI and data quality could become a global liability for organizations.
The severity and scale of these problems indicate that the traditional methods of addressing data quality must be revised. Many organizations have approached data quality issues through failed initiatives — avoiding fixing problems or through long, slow, get-little-done projects. However, data quality challenges are not static; they are dynamic and continuous, simultaneously impacting multiple aspects of an organization. Addressing these data quality challenges effectively requires more than avoidance or slow bureaucracy. It calls for an ongoing, adaptive methodology that can evolve with the data itself — a methodology found in DataOps.
Why a DataOps Approach to Data Quality: Leadership Challenges
While identifying and understanding data quality issues is crucial, data quality leaders face a different, more nuanced challenge: driving change at scale across their organizations. In many instances, the people responsible for the data quality often differ from those responsible for fixing it. Data quality problems often span multiple departments, crossing into different business units and functional areas. This creates an environment where achieving widespread improvement becomes incredibly complex, as it requires cooperation from a diverse range of stakeholders, many of whom might not see the immediate benefit of investing in data quality improvements.
One of the core issues faced by data quality leaders is that source system data is often deemed “good enough” for the operational systems where it originates. However, this data frequently needs to be revised when repurposed for analytical use or downstream processes. Satisfied with the performance of their data in its original context, source system owners often do not prioritize or even recognize the need for data quality improvements beyond their immediate domain. This scenario creates friction between those who rely on data for analysis and decision-making and those who maintain the systems generating the data.

Compounding this problem is that data quality leadership is often a role of influence rather than direct control. Data quality leaders frequently identify problems but need more authority, resources, or technical capacity to implement solutions directly. They must rely on others — teams and individuals who control the data sources — to execute changes. This dependence on others makes driving action a formidable challenge, as it involves convincing people across the organization to prioritize data quality improvements. The questions that data quality leaders must grapple with are not just technical but are social:
- Where should the changes be made?
- Who should be responsible for making those changes?
- Why should the broader organization care?
- What information is needed to justify and guide the changes?
- How do I motivate someone to make the change to improve the data?
NOTE
We went deeper on this dynamic in How Data Quality Leaders Can Gain Influence and Avoid the Tragedy of the Commons.
These questions underscore the leadership challenge at the heart of data quality improvement. More is needed to identify and understand the problem; data quality leaders must act as influencers, facilitators, and catalysts for change. The solution to this challenge lies in creating a structured, repeatable, and agile process that encourages continuous improvement and aligns the interests of all stakeholders — a solution that DataOps provides.
Critical Ideas in Data Quality The DataOps Way
The DataOps approach to data quality offers a compelling framework for addressing the leadership challenges and systemic issues outlined above. Drawing inspiration from Agile, Lean, and DevOps practices, DataOps applies these principles to data and analytics. It shifts the focus from a reactive, one-off project mindset to a proactive, iterative, continuous improvement process. At its core, DataOps enables individuals and teams to rapidly, collaboratively, and at scale manage and improve data quality. It encourages individuals to start small, iterate quickly, measure success, and ‘ship’ working results early and often.
Individual Empowerment
DataOps emphasizes individual empowerment, recognizing that the people closest to the data are often best positioned to identify and address quality issues. Rather than waiting for top-down mandates, DataOps encourages organizations to equip individuals with the tools, autonomy, and authority to drive change within their respective domains. This empowerment enables faster problem identification and more agile responses.
Experimentation and Iteration
In the DataOps approach, experimentation and iteration are central. A perfect data quality score or test is optional before taking action. Instead, teams are encouraged to start small, experiment with solutions, and iterate based on feedback and results. This iterative approach allows organizations to make incremental improvements quickly, learning from each cycle and refining their processes over time.
Leverage
One of the critical principles of DataOps is leverage — the ability to maximize the impact of limited resources. In many cases, data quality improvements can be achieved not by scaling resources but by identifying the right leverage points within the organization. This could involve automating repetitive tasks, applying AI-driven insights, or tapping into the knowledge of subject matter experts at critical moments. Data quality leaders should use scoring models tailored to distinct business needs to make data scoring more focused and impactful. This ensures scores are relevant to different departments or use cases, allowing data quality efforts to drive targeted improvements.

Agile/DataOps Approach to Data Quality
DataOps draws heavily from Agile methodologies, prioritizing adaptability, collaboration, and rapid iteration. A core tenet of DataOps is to “get a data quality process working right away” and then iterate and improve on it continuously. In practice, this means starting with a minimum viable data quality evaluation and scoring method that addresses the most immediate issues and then building on that foundation as more information becomes available. Documentation and analysis are seen not as obstacles to progress but as byproducts of the improvement process.
Measuring and Evaluating Data Quality Before Standards Are Established
DataOps encourages organizations to measure and evaluate data quality before establishing formal standards. Early measurements provide a baseline against which future improvements can be gauged. Over time, these measurements help inform the creation of data quality standards, which can then be refined and improved through further iterations. By starting with measurable outcomes, data quality leaders can make data-driven decisions about where to focus their efforts and how to prioritize improvements.
[G]ood quality and the proper uniformity have no meaning except with reference to the consumer’s demands.
Deming, W. Edwards. (1953). Statistical Techniques and International Trade. Journal of Marketing, 17(4), 428-433. Sage Publications, Inc., page 428
Continuous Learning
The DataOps approach is predicated on continuous learning. As teams cycle quickly through improvements, they learn more about their data, processes, and organizational needs. This rapid feedback loop enables teams to adapt quickly to changing requirements and evolving data landscapes, ensuring that the organization remains nimble in the face of new challenges.
Where to Start with Data Quality The DataOps Way
The first step in implementing DataOps for data quality is to start small, focusing on individual empowerment and personal leverage. Instead of attempting a large-scale, organization-wide rollout, DataOps data quality encourages organizations to begin with a single person who can gain influence. Still, it may need more authority over the data. This individual should be given a tool that enables them to identify meaningful data quality improvements with minimal ramp-up and at no significant cost.
Organizations can quickly see the benefits of data quality by starting small. This approach allows for learning and improvement over time, as each iteration provides valuable feedback that informs future efforts. Automation and data quality AI can play a significant role in this process, helping to streamline testing and analysis while reducing the manual burden on individuals. The goal is to make it easy to achieve impact, fit the solution to the organization’s specific needs, and measure success along the way.
How to Do Data Quality The DataOps Way: Seven Steps
The following outlines seven steps to do data quality the DataOps way. It focuses on empowering one person with no power but has influence and enables them to start the virtuous data quality influence, action, and measure cycle immediately.
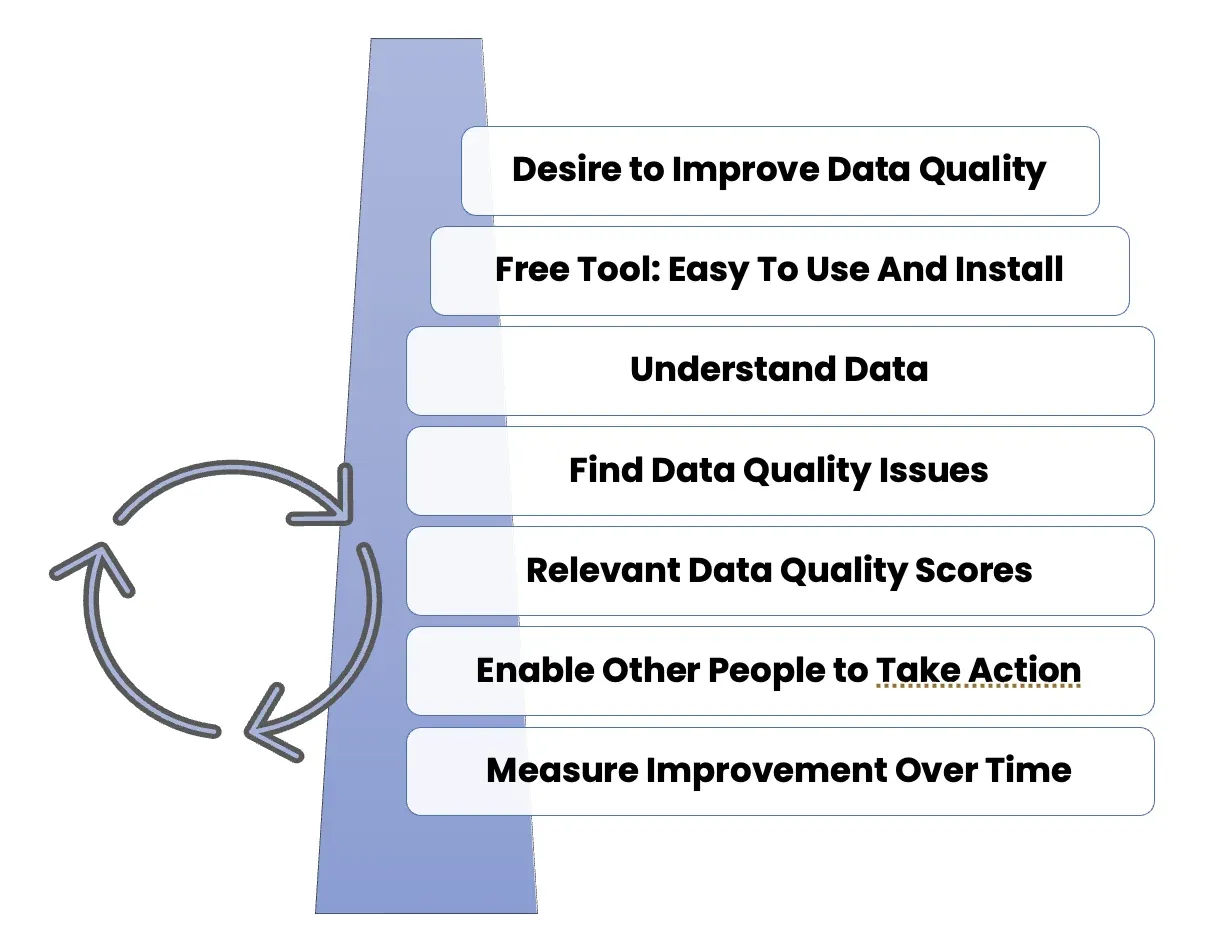
Step 1: Start With A Desire to Improve Data Quality
Finding individuals within the organization who are motivated to improve data quality is essential. These individuals, often tired of being the “data quality nags,” can play a pivotal role in driving change. Organizations can harness their passion and expertise to make meaningful improvements by giving them the necessary tools to influence.
Step 2: Empower an Individual with a Free Tool That Gives Them Data Quality Superpowers
The first step in the DataOps approach is to empower an individual who may not have direct authority but influence within the organization. This person should understand the importance of data quality and be motivated to drive change, even if they do not control the systems generating the data. Organizations can start improving data quality from the ground up by giving these individuals the tools and resources they need to effect change. To enable these individuals to start making improvements quickly, providing a tool that is easy to install and use is crucial. This tool should not require extensive IT support or additional infrastructure, allowing individuals to begin improving data quality within hours. By making the process as simple as possible, organizations can remove barriers to entry and accelerate the path to improvement.
TIP
Install Open Source DataOps TestGen — free, runs on a laptop, and profiles your first table in under an hour.
Step 3: Help Them Understand Their Data Through Profiling
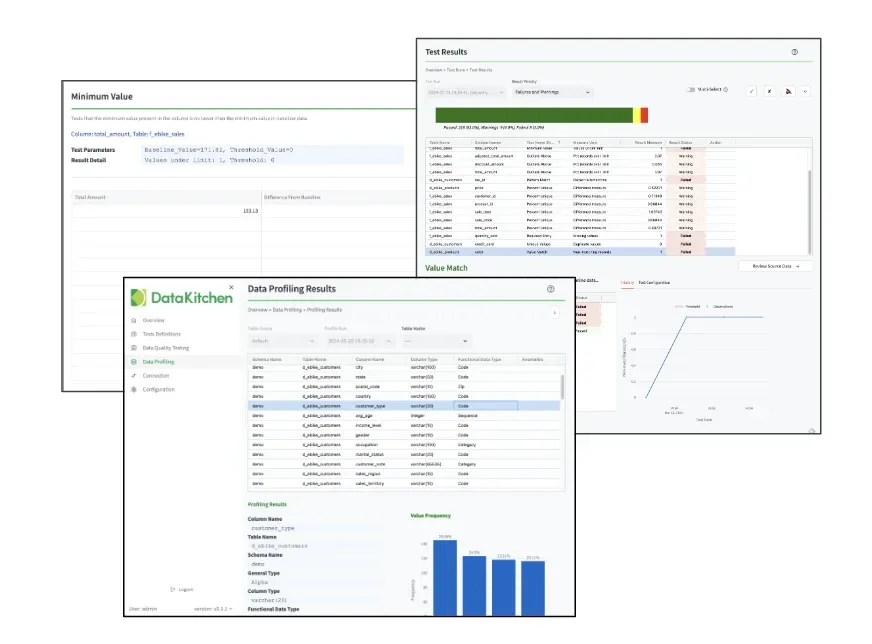
Data profiling is a critical step in understanding the quality of data sources. It visually represents the data and checks for conformance with business rules. Profiling helps visualize data problems, such as missing values, inconsistencies, or patterns, and serves as an excellent starting point for data quality workshops. By enabling fact-based discussions about the causes and impacts of data problems, profiling helps foster collaboration and drive solutions.
Without data, you’re just another person with an opinion.
W. Edwards Deming
Step 4: Identify Data Quality Issues
Once data has been profiled, the next step is identifying specific data quality issues. Identifying data quality issues is critical to ensure that datasets are reliable, consistent, and ready for analysis. Data is complicated; coding hundreds of data quality tests for every table is time-consuming and never gets done. Data quality leaders need an accelerator that automatically creates data quality tests. They need to manage and build company-specific tests with ease.
Automatically Screen New Data
One major category of issues involves data hygiene problems. These hygiene issues can often be detected and mitigated through qualification and hygiene screening. Regularly conducting a periodic review of source data is essential to keep track of any degradation in data quality over time. Additionally, it’s essential to surface data hygiene requirements early on to establish data cleanliness and reliability expectations. These requirements should be well-documented for collaborative review, ensuring that teams are aligned on the standards and any updates or concerns are shared.
A few example tests can help with hygiene management. These include confirming data typing, such as checking for numbers appearing in columns intended for text (alpha columns) and checking blank value representation to ensure no critical data is missing. It’s also necessary to verify that distinct values are present where applicable and assess any string pattern inconsistencies that might suggest data formatting issues.
Automatically Create Data Quality Tests
In addition to detecting hygiene issues, it is possible to automatically generate data quality scores based on data variations. One method for this is consistency testing, where anomalies from the baseline are identified. Baseline characteristics can be derived from data profiling, enabling teams to infer rules and documentation that establish acceptable data patterns automatically. These rules can then lead to the automatic generation of parameterized tests, providing a consistent mechanism for data validation over time.
Anomalies can arise in several forms. For instance, freshness anomaly checking ensures that the dataset is up-to-date, verifying that new data has been received. Similarly, volume anomaly checking confirms that the correct amount of data is being collected, while schema anomaly detection checks if the incoming data conforms to the expected schema. Data drift checks assess whether the received data makes sense compared to previous datasets. Deploying a wide net of simple tests — such as validating required values, calculating missing value percentages, and checking uniqueness — can help ensure data quality. These tests can also include list-of-values checks against baseline values, alpha and decimal truncation evaluations, and verifying that data recency is within acceptable ranges. Additional tests might involve comparing record counts within specific time windows, confirming min/max values against the baseline, and assessing distribution shifts over time.
Build New Tests With Configurable Business Rules
Configurable business rules can also help address data quality concerns. These rules allow for tests that fit single-table and multi-table structures. Business rule testing leverages the knowledge of domain experts to establish accurate data validation rules. Once set, these rules double as documentation for the dataset. The system can then run parameterized tests to verify compliance with these rules, ensuring more signal and less noise in the results. Importantly, these evaluations should focus on the data in a stable state rather than in the middle of a batch process, as this ensures more accurate results.
Several example tests can be applied using business rules. For instance, a test might validate that list-of-values data aligns with expected entries, such as checking if a delivery status field contains only acceptable values. Another example could be ensuring that entity relationships are enforced, such as verifying that every SKU exists in the distributor list. Additional tests could confirm the absence of duplicate values in unique fields or perform referential integrity checks across related tables.
Build Custom Data Quality Tests
For more specific scenarios, custom data quality tests can be created. These tests can be tailored to specific use cases by allowing users to supply the SQL queries needed to validate the data. Vertical domains and industries often have unique requirements, making it necessary to design industry-specific tests. For example, in the healthcare industry, a rule might state that the number of medical practices should not exceed the number of doctors, or in logistics, it could be required that no shipments are made on Fridays. By reserving programming expertise for these complex, custom challenges, organizations can maximize the value of their technical resources without overburdening them with routine checks.
Simply Manage Data Quality Validation Test Suites
Finally, managing the people involved in ensuring data quality is critical to a successful data governance strategy. This can be done through a user interface (UI) or a command-line interface (CLI), allowing users to interact with the data quality process, run tests, review results, and make real-time decisions.
Step 5: Create Relevant Data Quality Scores
The final step is to implement a scoring system that measures data quality. Scoring allows data quality leaders to quantify the state of their data and communicate it effectively to stakeholders. These scores permit focus and be configurable, allowing organizations to tailor them to different use cases, whether assessing critical data elements (CDEs), DAMA quality dimensions, or machine learning model data. Organizations can track improvements over time by continuously monitoring data quality scores and adjusting their efforts.
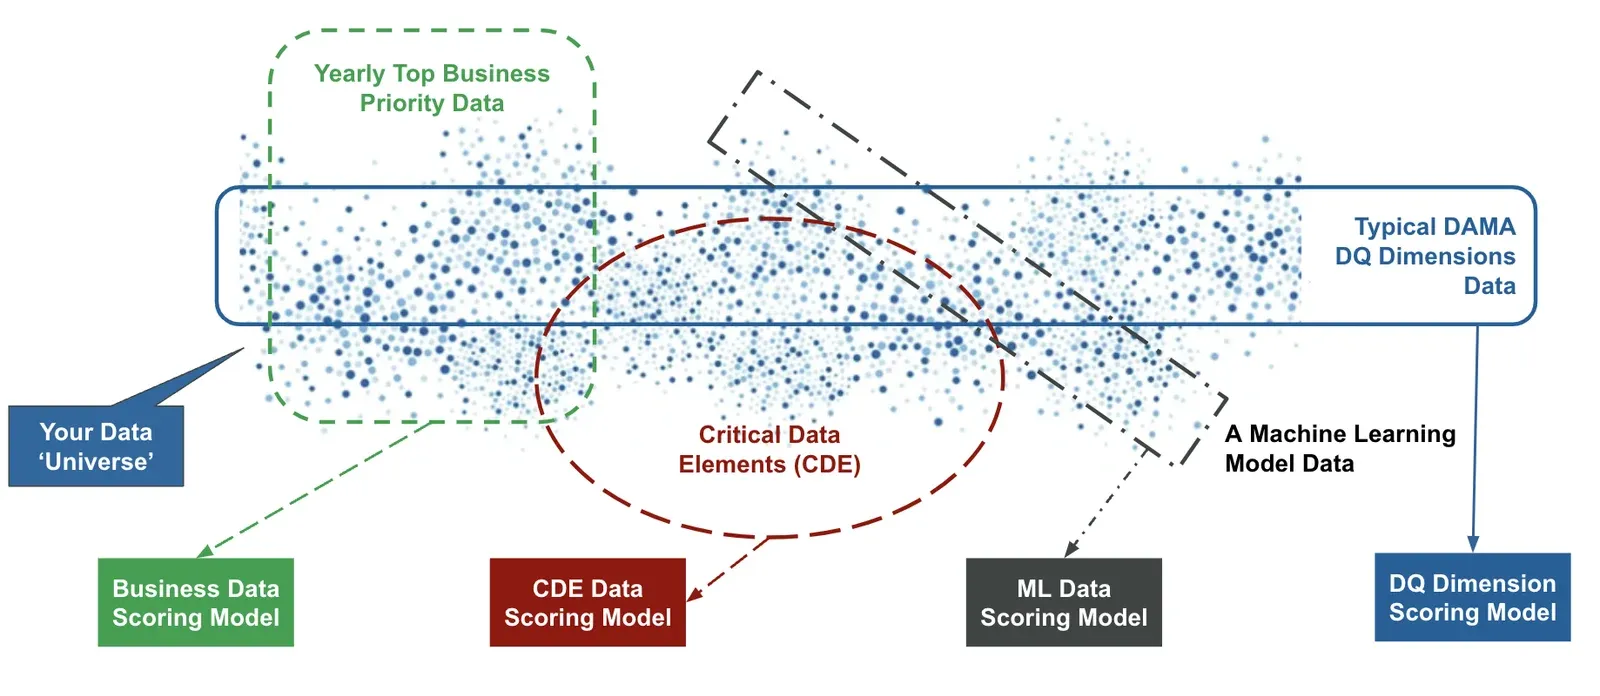
By implementing targeted and relevant data-scoring models, data quality (DQ) leaders can significantly enhance their organizational influence. It is crucial to prioritize scoring only the data elements that matter most to the business, avoiding extraneous metrics like fax numbers that add little value. Instead of adopting a broad approach to data quality scoring, which often results in marginal insights, leaders should focus on scoring data that aligns with the organization’s needs. This means designing scoring models that address critical business requirements and customer priorities, ensuring meaningful and actionable results.
Data quality leaders should develop multiple scoring models tailored to distinct business needs to make data scoring more impactful, rather than relying on a one-size-fits-all approach. This ensures scores are relevant to different departments or use cases, allowing data quality efforts to drive targeted improvements. Each scoring model should prioritize business-critical data elements, starting with a few metrics that genuinely resonate with the customer. As confidence and stakeholder buy-in grow, these models can be expanded to include additional elements supporting the organization’s goals. This approach keeps data scoring manageable and maximizes the influence of DQ initiatives by continually aligning data quality metrics with evolving business priorities. Focused data scoring creates a feedback loop where data quality directly contributes to operational success, cementing the DQ leader’s role as a strategic partner.
NOTE
On choosing what a score should actually measure, see The Six Types of Data Quality Dashboards and Why Your Data Quality Dashboard Isn’t Working — and What to Do About It.
Step 6: Make It Easy For Data Quality Leaders to Cause Other People to Take Action
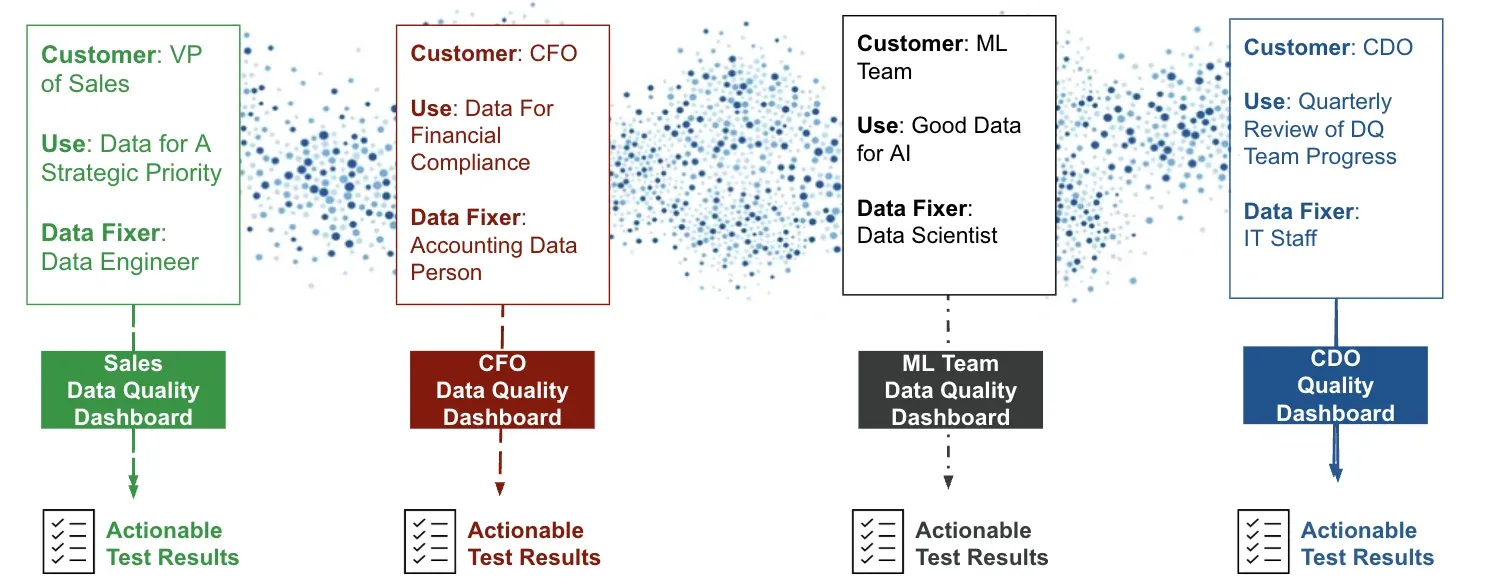
It’s crucial to make sharing data quality scores and test results simple and impactful. Leaders must communicate the significance of identified issues effectively, convincing others to take corrective measures. Providing a shareable summary package that clearly outlines the problem, its impact, and steps for resolution makes it easier for teams to understand and fix the issue. Additionally, simplifying the process of recreating the test conditions ensures transparency and helps others effectively verify and address the problem. To streamline this process, integrating data quality management with existing workflow tools ensures that issues can be tracked, assigned, and resolved within the organization’s standard processes, making it easier for teams to take action and improve data quality.
Step 7: Measure Data Quality Improvement Over Time
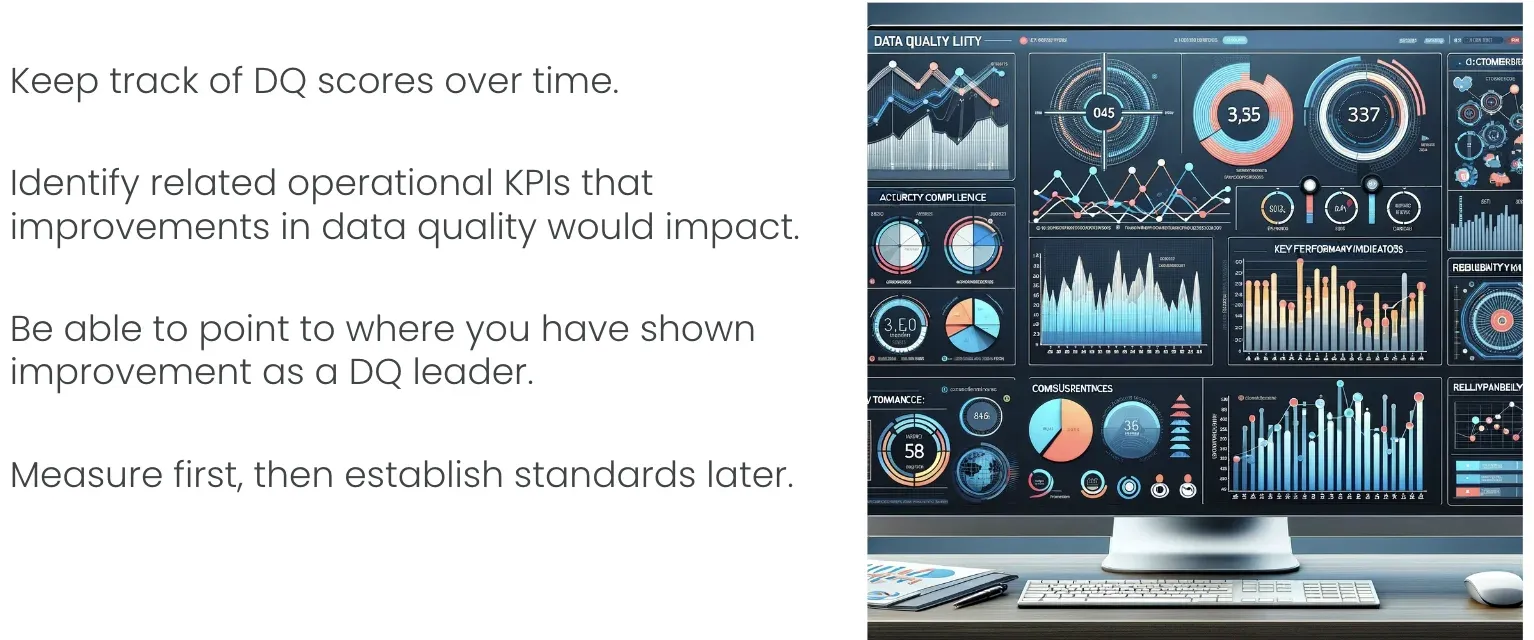
It is crucial to track data quality (DQ) scores over time and consistently measure improvements to demonstrate a meaningful impact on data quality. By keeping a record of these scores, data quality leaders can highlight tangible progress in data quality management and showcase their role in driving that improvement. Additionally, identifying related operational KPIs (key performance indicators) that are influenced by data quality improvements can strengthen the case for ongoing quality initiatives. For example, enhanced data quality could lead to better decision-making, fewer errors, and improved operational efficiency, all visible through KPIs. Measuring progress consistently before setting rigid standards is essential, allowing for flexibility and continuous refinement. Adopting a pragmatic approach, where an initial 70% accuracy score is acceptable, enables teams to make improvements incrementally rather than waiting for perfection, which can cause delays.
As new data comes in, data quality scores are expected to evolve. This makes it crucial to continuously revisit and refine the data quality tests that generate those scores. Regularly refining DQ standards ensures that tests become more accurate and yield fewer false positives, providing a clearer picture of data quality issues. Additionally, real-world data scenarios offer valuable learning opportunities, allowing teams to adapt their testing processes and standards based on practical experience. Over time, this continuous learning process means that even less-skilled team members can be involved in maintaining and improving data quality as they build knowledge of the data and processes. Monitoring DQ score trends on a chart provides visibility into data quality improvements and the effectiveness of evaluation criteria. As standards and data improve, the chart will reflect the progress, reinforcing the impact of refined data quality efforts.
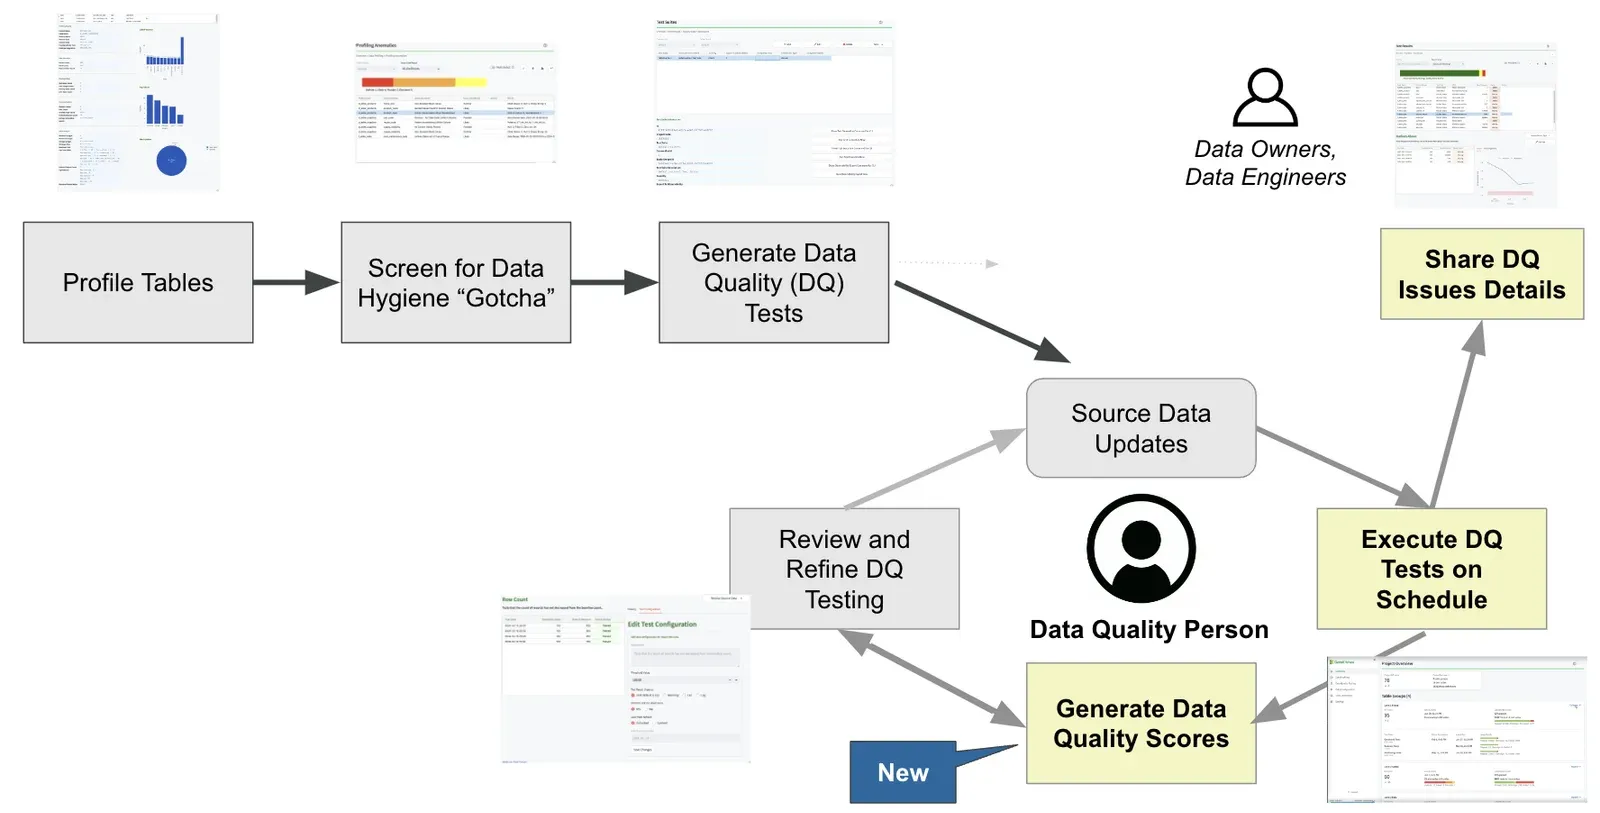
Traditional, Waterfall, Data Quality Projects Versus The DataOps Data Quality ‘Influence and Action’ Cycle
Traditional approaches are about requirements gathering, analysis, meetings, documentation, and planning before any action is taken to improve data quality. Waterfall project management approaches often fail because they rely on rigid, sequential processes that need more flexibility in accommodating changes. In traditional waterfall models, project phases such as requirements gathering, design, development, testing, and deployment occur one after the other, with little room for feedback or iteration until the end of the process. However, many projects, particularly in dynamic environments like data analytics, require continuous adaptation based on new information or changes in requirements. As a result, waterfall methodologies often result in delayed responses to evolving needs, causing misalignment with stakeholders’ expectations and leading to a mismatch between the final deliverable and the users’ needs.
Another major issue with the waterfall approach is that it assumes that all data quality requirements can be fully understood upfront. In reality, it is often difficult to define all aspects of a project in the initial stages. This assumption leads to a need for more iterative feedback loops, making it harder to correct mistakes or refine deliverables throughout the project. In cases where problems arise, they may only be discovered late in the process, resulting in costly delays or even project failure. Agile methodologies, in contrast, allow for more incremental development and testing, enabling teams to identify issues earlier and make adjustments on the fly, which is essential for modern data quality environments where adaptability is critical.
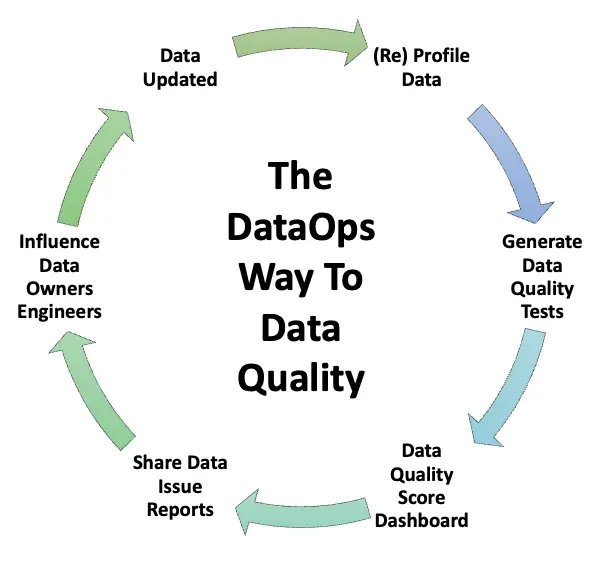
The DataOps approach to improving data quality is a cycle that empowers an individual who may not have direct authority but has influence within the organization. Organizations can start improving data quality from the ground up by giving these individuals the tools and resources they need to effect change. This person is working in a continuous cycle of influence and action. This cycle involves the following key activities:
- New data or updated data
- (Re) profile data:
- Establish a baseline by measuring the current state of the data with data profiling
- Get a foundation for tracking progress and identifying areas for improvement repeatedly
- Generate data quality tests:
- Generative data quality tests can streamline this process, making it easier to catch problems before they become more significant without coding
- Data quality score dashboard:
- Scoring provides a quantifiable way to assess the health of the data and communicate the results
- Scores should be focused on the data elements that matter and reflect top organizational needs
- Share data quality issues report:
- Give actionable, specific changes to those who can do the technical work
- Influence data owners and engineers:
- Once data quality issues have been identified, the next step is to drive the necessary organizational changes
- Influence data owners, system administrators, or other stakeholders to address the identified issues
Advantages of Data Quality The DataOps Way
DataOps provides several distinct advantages when applied to data quality management. These advantages are particularly pronounced in organizations dealing with large volumes of complex data, where traditional approaches often fall short.
Handling data at scale. DataOps helps teams handle massive amounts of changes at scale. As organizations grow and their data requirements expand, the ability to manage and ensure the quality of that data becomes increasingly important. DataOps automatically and at scale applies universal quality principles — such as consistency, accuracy, and completeness — ensuring that large datasets can be managed efficiently without sacrificing quality.
Knowledge-based trade-offs. One key benefit of the DataOps approach is its ability to facilitate knowledge-based trade-offs. Rather than making assumptions about data quality or relying on hope, DataOps encourages organizations to use real-time data and insights to inform their decisions. This ensures that trade-offs between speed, cost, and quality are made based on actual knowledge, leading to better outcomes. Don’t rely on your intuition; look at the facts on the ground with actual data.
Leveraging expertise. Subject matter experts and skilled data engineers often need to improve data quality. By focusing their efforts where they are most needed, organizations can maximize the impact of their resources and ensure that expertise is applied where it counts.
Faster, easier implementation. The iterative, Agile nature of DataOps makes it faster and easier to implement real data quality improvements. Rather than waiting for a perfect solution, teams can begin implementing changes immediately, learning from each iteration and refining their processes over time. This iterative approach accelerates the implementation of data quality initiatives and ensures that improvements are continuously being made. Getting something 70% right working today is much better than a perfect solution sometime in the future.
More iterations, better data quality standards. The more iterations a team goes through in its data quality processes, the more refined its standards become. Each cycle provides an opportunity to learn, improve, and adjust the standards to reflect the organization’s needs and goals better. Over time, this leads to establishing more robust, actionable standards that drive fundamental improvements in data quality. Maximize your team’s learning from experience, not second-hand anecdotes.
Conclusion: Data Quality The DataOps Way
Ultimately, the DataOps approach allows organizations to get data quality processes working quickly and then iterate and improve over time. Documentation and analysis become natural outcomes, not barriers to progress. By starting with testing and measurements, even before standards are fully established, organizations can build a foundation for continuous improvement. The faster the iteration, the more organizations learn, refine their processes, and elevate their data quality standards.
Data quality, the DataOps way, is about action, agility, and learning — making it the best way to drive meaningful, scalable, and lasting improvements in data quality. With data quality the DataOps way, organizations can:
- Start with minimal cost, using tools that run on individual laptops.
- Learn and improve over time with a low ramp-up.
- Leverage automation and AI to streamline testing and improvements.
- Ensure that the process fits the specific needs of the organization.
- Continuously measure success and drive further improvements.
The DataOps approach to data quality provides a scalable, iterative, and flexible framework for improving data quality across an organization. By empowering individuals, leveraging expertise, and focusing on continuous improvement, DataOps enables organizations to address their data quality challenges proactively and effectively. Rather than waiting for perfect solutions, DataOps encourages organizations to start small, iterate quickly, and learn from each improvement cycle.
Related Reading
- What is DataOps? — the discipline this paper applies to data quality
- How Data Quality Leaders Can Gain Influence and Avoid the Tragedy of the Commons — why shared data degrades when no one owns the repair
- The Six Types of Data Quality Dashboards — picking the scoring model that fits the audience
- Why Your Data Quality Dashboard Isn’t Working — the failure modes of scores nobody acts on
- The Seven Deadly Sins of Data Quality — the habits this approach is meant to break
- The Data Quality Revolution Starts With You — the case for starting as one person with influence
- 7 Steps to Implement DataOps — the engineering practices underneath
FAQ
What is the main point of this paper?
Data quality fails as a project and succeeds as a continuous practice. The paper argues that data quality leaders hold influence rather than direct control, so the way to make progress is to empower one motivated person with a free tool, profile the data, generate tests automatically, score what matters to the business, and iterate — rather than running a months-long waterfall assessment first.
Why do traditional data quality projects fail?
Waterfall projects assume every data quality requirement can be understood upfront. In practice, requirements emerge as you look at real data. Sequential phases of requirements, analysis, documentation, and planning delay any actual improvement, and problems surface late, when they are expensive to fix. Data quality is dynamic and continuous, so a one-shot project structure mismatches the problem.
Why is data quality leadership a role of influence rather than control?
The people who own a data source are usually not the people who need it to be clean. Source system owners consider their data good enough for the operational job it was built for. Data quality leaders identify problems but rarely control the systems producing them, so progress depends on persuading other teams to prioritize a fix that benefits someone else.
What does DataOps add to data quality?
DataOps applies Agile, Lean, and DevOps thinking to data. It replaces the reactive, one-off project mindset with iterative continuous improvement: start small, experiment, measure, and ship working results early and often. Individuals closest to the data get the tools and autonomy to fix what they find, instead of waiting for a top-down mandate.
What are the seven steps to do data quality the DataOps way?
Start with a desire to improve data quality; empower an individual with a free tool; help them understand their data through profiling; identify data quality issues; create relevant data quality scores; make it easy for them to cause other people to act; and measure improvement over time. The sequence deliberately begins with a person, not a framework.
Why start with data profiling?
Profiling gives a visual representation of what is actually in the data and checks conformance with business rules. It surfaces missing values, inconsistencies, and unexpected patterns, which makes it the best opening move for a data quality workshop. It replaces opinion with evidence: as Deming put it, without data you’re just another person with an opinion.
Should you measure data quality before standards are established?
Yes. Early measurements create the baseline that future improvement is judged against, and they inform what the standards should say. Waiting for formal standards before measuring anything delays every subsequent decision. Measure first, then let the standards emerge from what the measurements reveal.
How should data quality scores be designed?
Score only the data elements that matter to the business, and build several models tailored to distinct business needs rather than one universal score. Scoring low-value fields like fax numbers produces marginal insight. Start with a few metrics that genuinely resonate with a specific customer, then expand as stakeholder confidence grows.
What does the influence and action cycle look like in practice?
New or updated data arrives; the data is re-profiled to establish a baseline; data quality tests are generated; a score dashboard quantifies the health of the elements that matter; an issue report gives specific actionable changes to the people who can make them; and data owners and engineers are influenced to act. The cycle then repeats on the next tranche.
What are the advantages of the DataOps approach to data quality?
It handles change at scale, supports knowledge-based trade-offs using real data instead of intuition, focuses scarce expert time where it counts, and makes improvements faster to implement because teams start immediately rather than waiting for a perfect solution. More iterations also produce better standards, since each cycle teaches the team something about its own data.
Get the PDF
The full paper is on this page. Fill in the form for a PDF copy to keep or share.