Abstract
Data analytics teams challenged by inflexibility and poor quality have found that DataOps can address these and many other obstacles. DataOps includes tools and process improvements that enable faster, more responsive data analytics while maintaining a high level of quality and reliability. Data analytic teams can implement DataOps in seven simple steps: (1) add data and logic tests, (2) use a version control system, (3) branch and merge, (4) use multiple environments, (5) reuse and containerize, (6) parameterize your processing, and (7) work without fear and heroism.
NOTE
For a more detailed overview of DataOps, see What is DataOps?
Introduction
Data analytics has become business critical, but requirements quickly evolve and data analytics teams that respond to these challenges in the traditional ways often end up facing disappointed users. DataOps offers a more effective approach that optimizes the productivity of the data analytics pipeline by an order of magnitude.
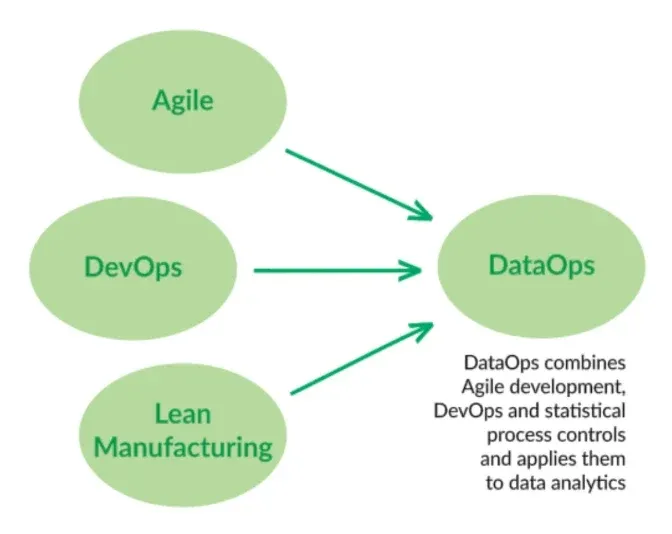
DataOps is a tools and process change that incorporates the speed of Agile software development, the responsiveness of DevOps, and the quality of statistical process control (SPC) widely used in manufacturing.
Like Agile development, DataOps organizes the team and its processes around the goal of publishing releases to users every few days or even every few minutes. Each release contains working and valuable changes to the code base. Improvements are made and published quickly and feedback from users is incorporated into future releases as soon as possible. This approach is particularly good for non-sequential analytics development where requirements are quickly evolving.
Like DevOps, DataOps utilizes the automated provisioning of resources (infrastructure as code) and cloud services (platform as a service) to break down the barriers between IT, software development, quality assurance and other groups. The cloud provides a natural platform that allows individuals in each stage of development to create and define identical run-time environments. This minimizes errors, misunderstandings and delays.
Data analytics is a pipeline process much like software development and manufacturing. It executes a set of operations and attempts to produce a consistent output at a high level of quality. With DataOps this pipeline is highly automated. Statistical process control is used to test, monitor and manage the robustness and consistency of each stage of the data analytics pipeline. With an automated test suite, changes can be quickly verified and approved supporting the continuous development and deployment of enhancements to data analytics.
Imagine the next time that the Vice President of Marketing requests a new customer segmentation, by tomorrow. With DataOps, the data analytics team can respond ‘yes’ with complete confidence that the changes can be accomplished quickly, efficiently and robustly. How then does an organization implement DataOps? You may be surprised to learn that an analytics team can migrate to DataOps in seven simple steps.
Step 1: Add Data and Logic Tests
If you make a change to an analytic pipeline, how do you know that you did not break anything? Automated testing ensures that a feature release is of high quality without requiring time-consuming, manual testing. The idea in DataOps is that every time a data analytics team member makes a change, he or she adds a test for that change. Testing is added incrementally, with the addition of each feature, so testing gradually improves and quality is literally built in. In a big run, there could be hundreds of tests at each stage in the pipeline.
Adding tests in data analytics is analogous to the statistical process control that is implemented in a manufacturing operations flow. Tests ensure the integrity of the final output by verifying that work-in-progress — the results of intermediate steps in the pipeline — matches expectations. Testing can be applied to data, models and logic. The table below shows examples of tests in the data analytics pipeline.
| Stage | Test | What it checks |
|---|---|---|
| Inputs — verifying the inputs to an analytics processing stage | Count verification | Row counts are in the right range |
| Conformity | US Zip5 codes are five digits, US phone numbers are 10 digits | |
| History | The number of prospects always increases | |
| Balance | Week over week, sales should not vary by more than 10% | |
| Temporal consistency | Transaction dates are in the past, end dates are later than start dates | |
| Application consistency | Body temperature is within a range around 98.6°F / 37°C | |
| Field validation | All required fields are present and correctly entered | |
| Business logic — checking that the data matches business assumptions | Customer validation | Each customer should exist in a dimension table |
| Data validation | 90% of data should match entries in a dimension table | |
| Output — checking the result of an operation, for example a cross-product join | Completeness | Number of customer prospects should increase with time |
| Range verification | Number of physicians in the US is less than 1.5 million |
For every step in the data analytics pipeline, there should be at least one test. The philosophy is to start with simple tests and grow over time. Even a simple test will eventually catch an error before it is released out to the users. For example, just making sure that row counts are consistent throughout the process can be a very powerful test. One could easily make a mistake on a join, and make a cross product which fails to execute correctly. A simple row-count test would quickly catch that.
Tests can detect warnings in addition to errors. A warning might be triggered if data exceeds certain boundaries. For example, the number of customer transactions in a week may be OK if it is within 90% of its historical average. If the transaction level exceeds that, then a warning could be flagged. This might not be an error. It could be a seasonal occurrence for example, but the reason would require investigation. Once recognized and understood, the users of the data could be alerted.
DataOps is not about being perfect. In fact, it acknowledges that code is imperfect. It’s natural that a data analytics team will make a best effort, yet still miss something. If so, they can determine the cause of the issue and add a test so that it never happens again. In a rapid release environment, a fix can quickly propagate out to the users.
With a suite of tests in place, DataOps allows you to move fast because you can make changes and quickly rerun the test suite. If the changes pass the tests, then the data analytics team member can be confident and release it. The knowledge is built into the system and the process stays under control. Tests catch potential errors and warnings before they are released so the quality remains high.
TIP
Install Open Source DataOps TestGen to generate this class of test automatically instead of hand-coding each one.
Step 2: Use a Version Control System
There are many processing steps that turn raw data into useful information for stakeholders. To be valuable, data must progress through these steps, linked together in some way, with the ultimate goal of producing a data analytics output. Data may be preprocessed, cleaned, checked, transformed, combined, analyzed, and reported. Conceptually, the data analysis pipeline is a set of stages implemented using a variety of tools including ETL tools, data science tools, self-service data prep tools, reporting tools, visualization tools and more. The stages may be executed serially, but many stages can be parallelized. The pipeline is deterministic because the pipeline stages are defined by scripts, source code, algorithms, HTML, configuration files, parameter files, containers and other files. All of these items are essentially just code. Code controls the entire data analytics pipeline from end to end in a reproducible fashion.
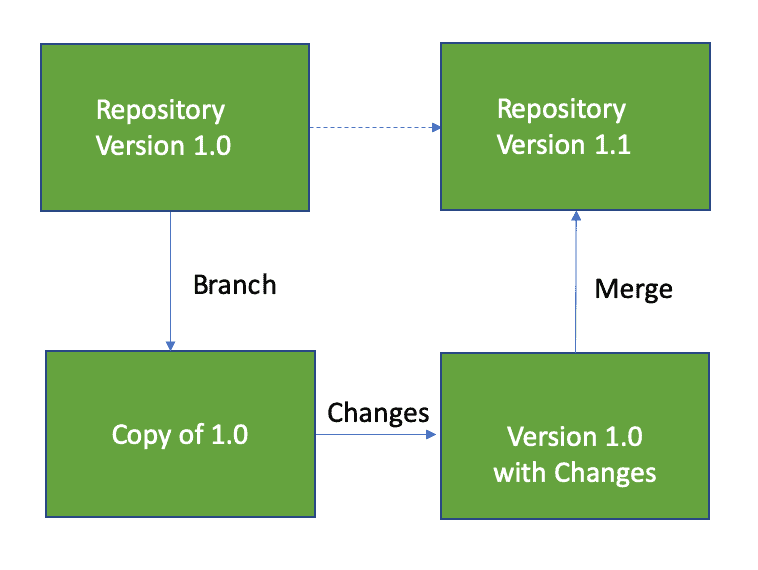
The artifacts (files) that make this reproducibility possible are usually subject to continuous improvement. Like other software projects, the source files associated with the data pipeline should be maintained in a version control (source control) system such as Git. A version control tool helps teams of individuals organize and manage the changes and revisions to code. It also keeps code in a known repository and facilitates disaster recovery. However, the most important benefit of version control relates to a process change that it facilitates. It allows data analytics team members to branch and merge.
Step 3: Branch and Merge
In a typical software project, developers are continuously updating various code source files. If a developer wants to work on a feature, he or she pulls a copy of all relevant code from the version control tool and starts to develop changes on a local copy. This local copy is called a branch. This approach can help data analytics teams maintain many coding changes to the data analytics pipeline in parallel. When the changes to a branch are complete and tested, the code from the branch is merged back into the trunk, where the code came from.
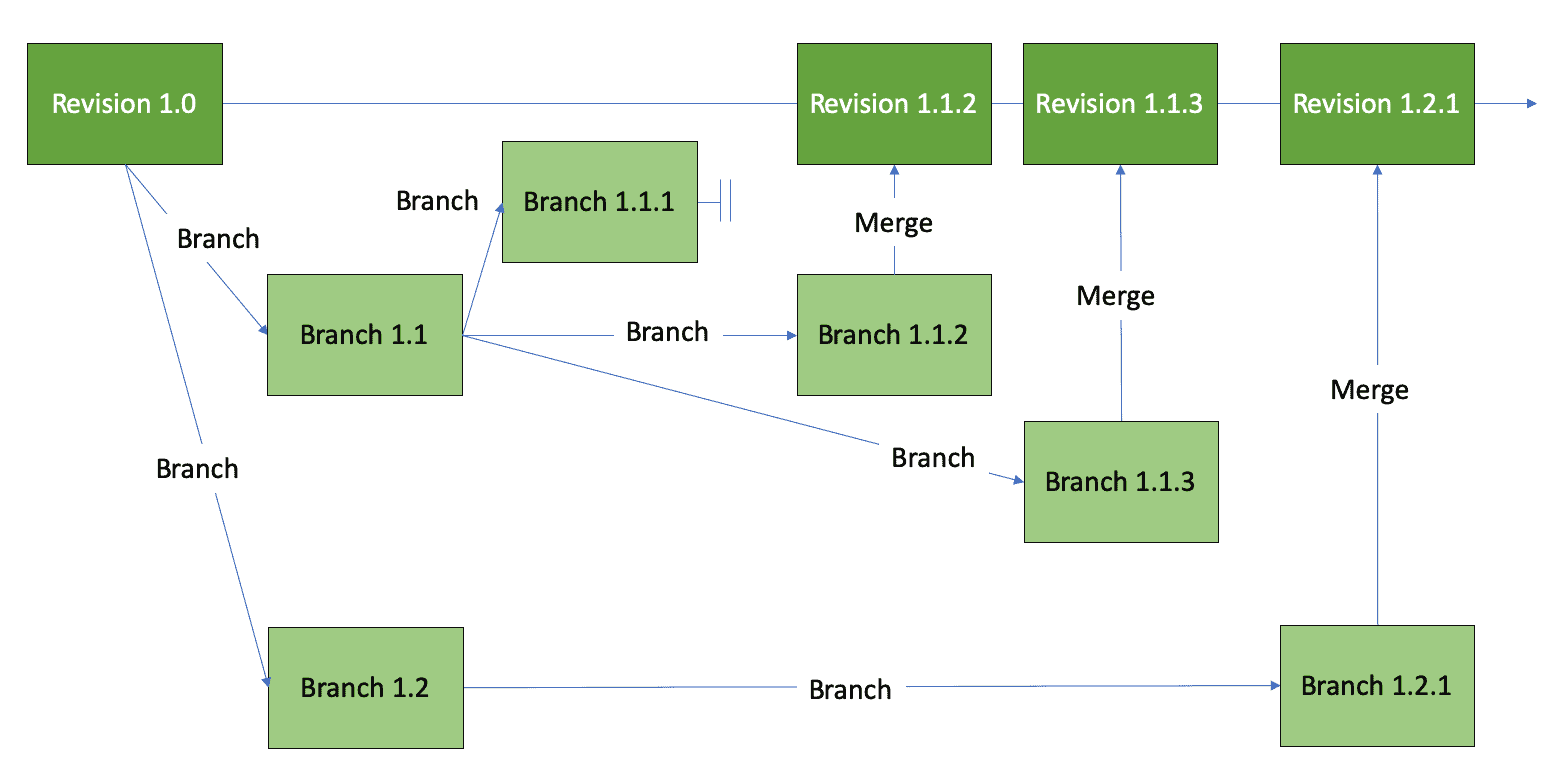
Branching and merging can be a major productivity boost for data analytics because it allows teams to make changes to the same source code files in parallel without slowing each other down. Each individual team member has control of his or her work environment. They can run their own tests, make changes, take risks and experiment. If they wish, they can discard their changes and start over. Another key to allowing team members to work well in parallel relates to providing them with an isolated machine environment.
Step 4: Use Multiple Environments
Every data analytics team member has their own development tools on their own laptop. Version control tools allow team members to work on their own private copy of the source code while still staying coordinated with the rest of the team. In data analytics, a team member can’t be productive unless they also have a copy of the data that they need. Most use cases can be covered in less than a terabyte (TB). Historically, disk space has been prohibitively expensive, but today, at less than $25 per TB per month (cloud storage), costs are now less significant than the opportunity cost of a team member’s time. If the data set is still too large, then a team member can take only the subset of data that is needed. Often the team member only needs a representative copy of the data for testing or developing one set of features.
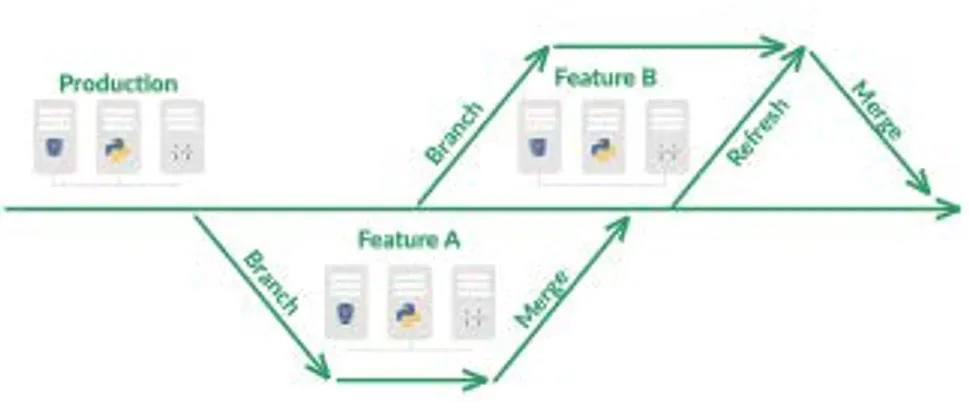
When many team members work on the production database it can lead to conflicts. A database engineer changing a schema may break reports. A data scientist developing a new model might get confused as new data flows in. Giving team members their own environment isolates the rest of the organization from being impacted by their work. The diagram below shows how version control, branching and merging, and multiple environments work together.
Step 5: Reuse and Containerize
Another team productivity tool is the ability to reuse and containerize code. Each step in the data analytics pipeline is the output of the prior stage and the input to the next stage. It is cumbersome to work with an entire data analytics pipeline as one monolith, so it is common to break it down into smaller components. It’s easiest for other team members to reuse smaller components if they can be segmented or containerized. One popular container technology is Docker.
Some steps in the data analytics pipeline are messy and complicated. For example, one operation might call a custom tool, run a Python script, use FTP and other specialized logic. This operation might be hard to set up because it requires a specific set of tools, and difficult to create because it requires a specific skill set. This scenario is another common use case for creating a container. Once the code is placed in a container, it is much easier to use by other programmers who aren’t familiar with the custom tools inside the container, but know how to use the container’s external interfaces. It is also easier to deploy that code to each environment.
Step 6: Parameterize Your Processing
There are cases when the data analytics pipeline needs to be flexible enough to incorporate different run-time conditions. Which version of the raw data should be used? Is the data directed to production or testing? Should records be filtered according to some criterion, such as private health care data? Should a specific set of processing steps in the workflow be included or not? To increase development velocity, these options need to be built into the pipeline. A robust pipeline design will allow the engineer or analyst to invoke or specify these options using parameters. In software development, a parameter is some information — a name, a number, an option — that is passed to a program that affects the way that it operates. If the data analytics pipeline is designed with the right flexibility, it will be ready to accommodate different run-time circumstances.
For example, imagine a pharmaceutical company that obtains prescription data from a third-party company. The data is incomplete, so the data producer uses algorithms to fill in those gaps. In the course of improving their product, the data producer develops a different algorithm to fill in the gaps. The data has the same shape (rows and columns), but certain fields are modified using the new algorithm. With the correct built-in parameters, an engineer or analyst can easily build a parallel data mart with the new algorithm and have both the old and new versions accessible through a parameter change.
Step 7: Work Without Fear and Heroism
Many data analytics professionals live in fear. In data analytics there are two common ways to be professionally embarrassed, or get fired:
- Allow poor quality data to reach users
- Deploy changes that break production systems
Data engineers, scientists and analysts spend an excessive amount of time and energy working to avoid these disastrous scenarios. They work weekends. They do a lot of hoping and praying. They devise creative ways to avoid overcommitting. The problem is that heroic efforts are eventually overcome by circumstances. Without the right controls in place, a problem will slip through and bring the company’s critical analytics to a halt.
The DataOps enterprise puts the right set of tools and processes in place to enable data and new analytics to be deployed with a high level of quality. When an organization implements DataOps, engineers, scientists and analysts can relax because quality is assured. They can Work Without Fear™. DataOps accomplishes this by optimizing two key workflows.
The Value Pipeline
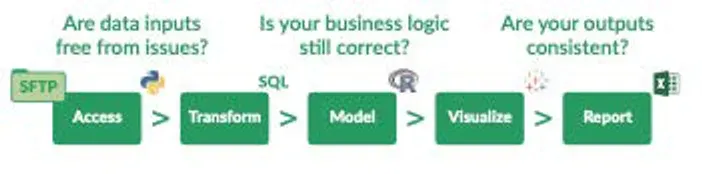
Data analytics seeks to extract value from data. We call this the Value Pipeline. Data enters the pipeline and moves into production processing. Production is generally a series of stages: access, transforms, models, visualizations, and reports. When data exits the pipeline, in the form of useful analytics, value is created for the organization. DataOps utilizes toolchain workflow automation to optimize operational efficiency in the Value Pipeline. Data in the Value Pipeline is updated on a continuous basis, but code is kept constant. Step 2 in the seven steps of implementing DataOps — using version control — serves as the foundation for controlling the code deployed.
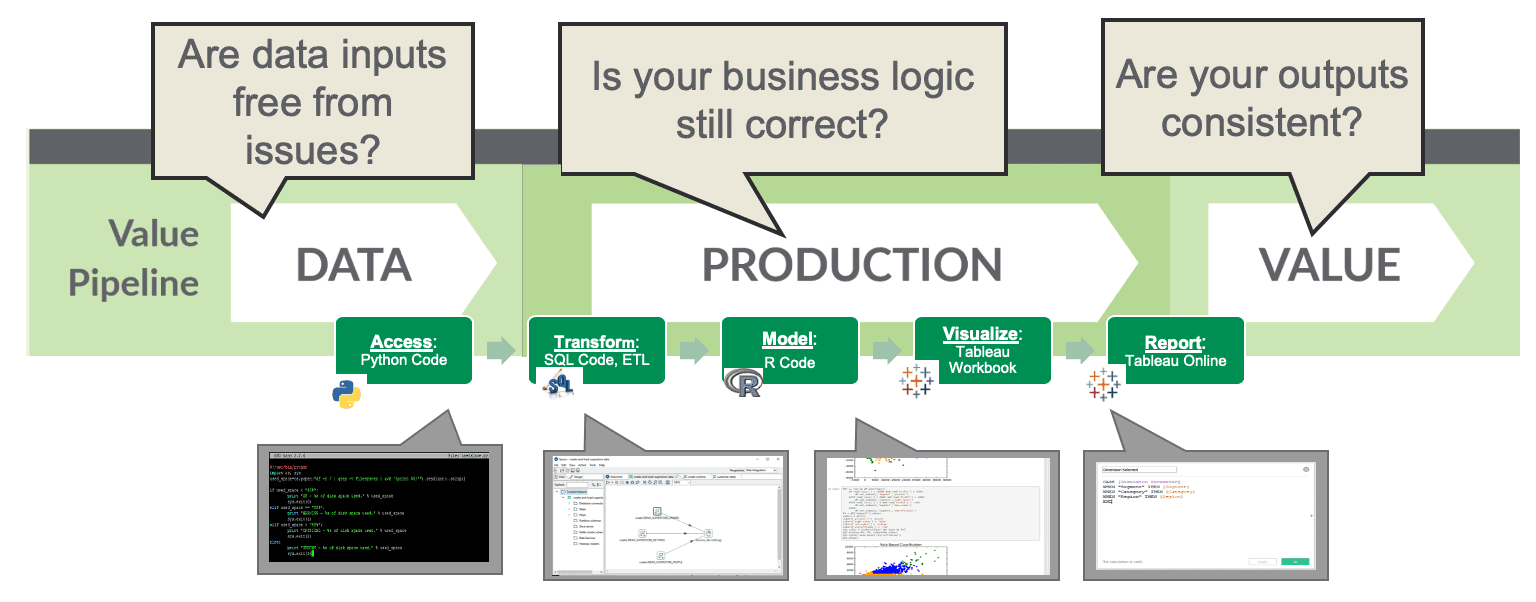
As mentioned above, the worst possible outcome is for poor quality data to enter the Value Pipeline. DataOps prevents this by implementing data tests (step 1). Inspired by the statistical process control in a manufacturing workflow, data tests ensure that data values lay within an acceptable statistical range. Data tests validate data values at the inputs and outputs of each processing stage in the pipeline. For example, a US phone number should be ten digits. Any other value is incorrect or requires normalization.
Once data tests are in place, they work 24x7 to guarantee the integrity of the Value Pipeline. Quality becomes literally built in. If anomalous data flows through the pipeline, the data tests catch it and take action — in most cases this means firing off an alert to the data analytics team who can then investigate. The tests can even, in the spirit of auto manufacturing, “stop the line.” Statistical process control eliminates the need to worry about what might happen. With the right data tests in place, the data analytics team can work without fear. This frees DataOps engineers to focus on their other major responsibility, the Innovation Pipeline.
The Innovation Pipeline
The Innovation Pipeline seeks to improve analytics by implementing new ideas that yield analytic insights. A new feature undergoes development before it can be deployed to production systems. The Innovation Pipeline creates a feedback loop. Innovation spurs new questions and ideas for enhanced analytics. This requires more development leading to additional insight and innovation. During the development of new features, code changes, but data is kept constant. Keeping data static prevents changes in data from being falsely attributed to the impact of the new algorithm. A fixed data set can be set up when creating a development environment — step 4 in the seven steps of implementing DataOps.
DataOps implements continuous deployment of new ideas by automating the workflow for building and deploying new analytics. It reduces the overall cycle time of turning ideas into innovation. While doing this, the development team must avoid introducing new analytics that break production. The DataOps enterprise uses logic tests (step 1) to validate new code before it is deployed. Logic tests ensure that data matches business assumptions. For example, a field that identifies a customer should match an existing entry in a customer dimension table. A mismatch should trigger some type of follow-up.
With logic tests in place, the development pipeline can be automated for continuous deployment, simplifying the release of new enhancements and enabling the data analytics team to focus on the next valuable feature. With DataOps the dev team can deploy without worrying about breaking the production systems — they can work without fear. This is a key characteristic of a fulfilled, productive team.
The Value-Innovation Pipeline
In real world data analytics, the Value Pipeline and Innovation Pipeline are not separate. The same team is often responsible for both. The same assets are leveraged. Events in one affect the other. The two workflows combine into the Value-Innovation Pipeline.
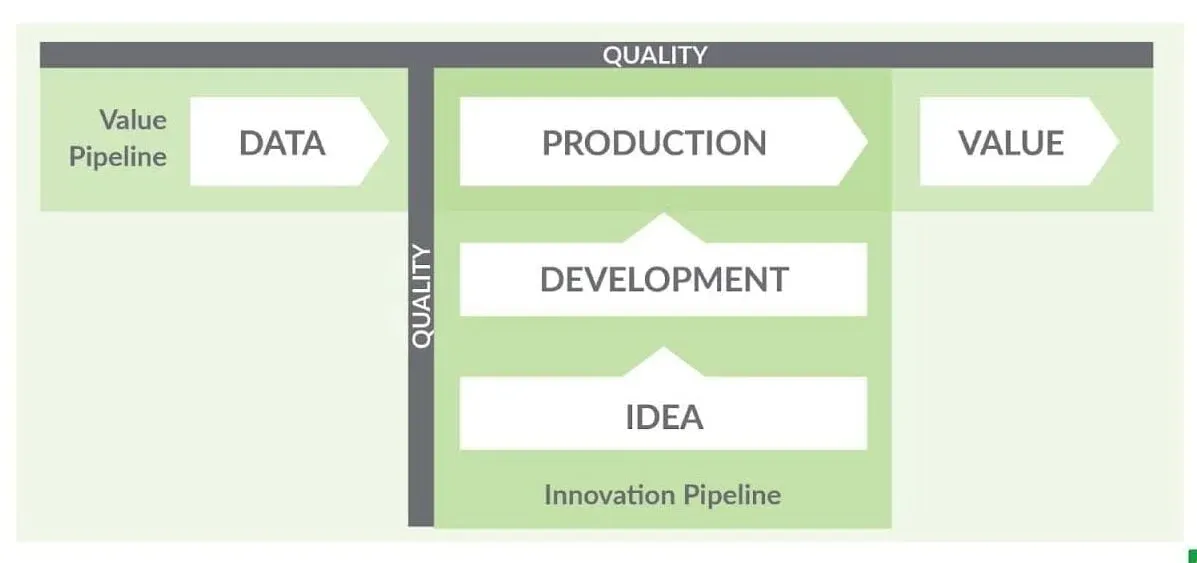
The Value-Innovation Pipeline captures the interplay between development and production and between data and code. DataOps breaks down this barrier so that cycle time, quality and creativity can all be improved. The DataOps enterprise masters the orchestration of data to production and the deployment of new features both while maintaining impeccable quality. Reduced cycle time enables DataOps engineers to impact the organization in highly visible ways. Improved quality enables the team to move forward with confidence. DataOps speeds the extraction of value from data and improves the velocity of new development while ensuring the quality of data and code in production systems. With confidence in the Value-Innovation Pipeline that stems from DataOps, the data analytics team avoids the anxiety and over-caution that characterizes a non-DataOps enterprise. Work without fear and heroism.
Call to Action
DataOps can accelerate the ability of data analytics teams to create and publish new analytics to users. It requires an Agile mindset and must also be supported by an automated platform which incorporates existing tools into a DataOps development pipeline as summarized by the seven steps above. A well-designed data analytics pipeline can serve as a competitive advantage for data-driven organizations. For more on the benefits of DataOps, see our other white papers.
For more information about how you can sharply improve the responsiveness of your data analytics, contact us.
Resources
Related Reading
- Where to Actually Start with DataOps in 2026 — the reading order around these seven steps, for a team lead deciding what to do this quarter
- Add DataOps Tests for Error-Free Analytics — step 1 in practice
- Add DataOps Tests to Deploy with Confidence — the logic-test half of step 1
- We Got Roasted on Reddit for Asking Why Data Engineers Don’t Test — why step 1 is still the one teams skip
- Data Quality Tests on 3 Million NYC Taxi Rides in Five Minutes — what automated test generation looks like on a real dataset
- Data Quality: The DataOps Way — the organizational side of the same argument
FAQ
What is the main point of this paper?
A data analytics team can adopt DataOps incrementally, in seven concrete steps, without a re-platforming project. The steps are: add data and logic tests, use a version control system, branch and merge, use multiple environments, reuse and containerize, parameterize your processing, and work without fear and heroism. Each one delivers value on its own.
What are the seven steps to implement DataOps?
Add data and logic tests; use a version control system; branch and merge; use multiple environments; reuse and containerize; parameterize your processing; and work without fear and heroism. The order matters because each step makes the next one cheaper — tests make branching safe, version control makes environments reproducible.
What kinds of tests belong in a data analytics pipeline?
Three kinds. Input tests verify data entering a processing stage: row counts, conformity, history, balance, temporal consistency, field validation. Business logic tests check that data matches business assumptions, such as every customer existing in a dimension table. Output tests check the result of an operation, such as a cross-product join producing a plausible row count.
How many tests does a pipeline need to start?
One per step is enough to begin. The philosophy is to start simple and grow. A row-count check that confirms counts stay consistent through the pipeline will catch a botched join that silently produces a cross product — a single trivial test catching a class of error that is expensive to find downstream.
What is the difference between a test error and a warning?
An error means the data or logic is wrong and the pipeline should stop. A warning means a value is outside its usual boundaries but may be legitimate. If weekly customer transactions fall outside 90% of their historical average, that could be seasonal rather than broken, so it flags for investigation instead of halting the line.
Why do data teams need version control and branching?
Every stage of a data pipeline is defined by code: scripts, SQL, configuration, parameter files, containers. Keeping those in Git enables branching, which lets team members change the same files in parallel without blocking each other. Each person can experiment, run their own tests, and discard the work if it doesn’t pan out.
Why does each team member need their own environment?
Because a shared production database creates conflicts — a schema change breaks someone’s report, new data arriving mid-experiment confuses a model. Isolated environments protect the rest of the organization from work in progress. Most use cases fit in under a terabyte, and at cloud storage prices that is cheaper than the engineer’s time it saves.
What is the Value Pipeline?
The Value Pipeline is the flow that extracts value from data: access, transform, model, visualize, report. Data changes continuously while code is held constant. Data tests guard it, validating values at the inputs and outputs of every stage, so poor quality data never reaches users unnoticed.
What is the Innovation Pipeline?
The Innovation Pipeline is the flow that improves analytics with new ideas. Code changes while data is held constant, so a change in results can be attributed to the new algorithm rather than to shifting data. Logic tests validate new code before deployment, which is what makes continuous deployment safe.
What does it mean to work without fear and heroism?
Data professionals commonly fear two things: letting poor quality data reach users, and deploying a change that breaks production. Heroic weekend effort is not a control. Automated data and logic tests, version control, and isolated environments put real controls in place, so the team can move fast without gambling on either failure.
Get the PDF
The full paper is on this page. Fill in the form for a PDF copy to keep or share.