Why Do DataOps
If you are frustrated with your enterprise’s data analytics, you are not alone. VentureBeat reported that 87% of data science projects never make it into production. It’s no surprise then that, despite soaring investments in AI and data science, the percentage of organizations that describe themselves as “data driven” has fallen from 37% to 31% since 2017.
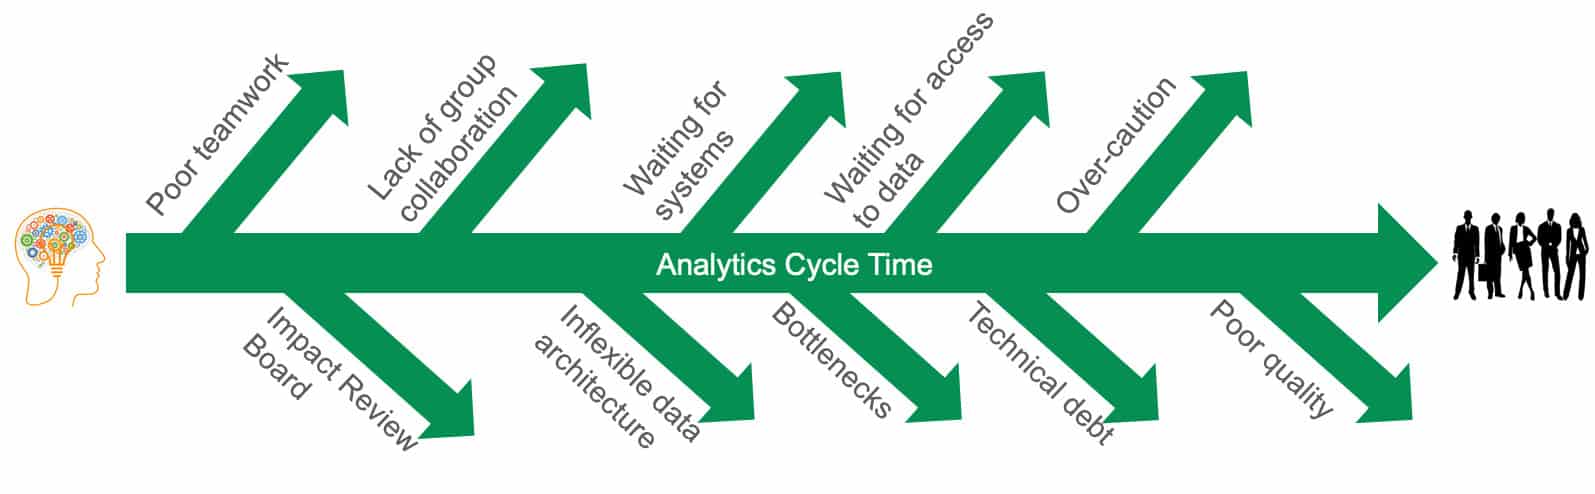
Too often, data science remains a manual process, conducted by highly trained artisans. The technology research firm Gartner asserts that 80% of AI projects resemble alchemy , run by wizards whose talents will not scale in the organization. Imagine an automobile manufacturing plant run without automation. It would suffer from inconsistent quality, long cycle times, waste, inflexibility and bottlenecks. No one in the 21st century would ever run an operations team that way. Yet, walk down the hall to your data analytics group and observe — poor quality, minor changes take months to implement, manual processes, 75% of the day is hijacked by unplanned work, and oversubscribed resources limit overall productivity. It’s a classic case of good people doing their utmost to overcome the limitations inherent in poor business processes.
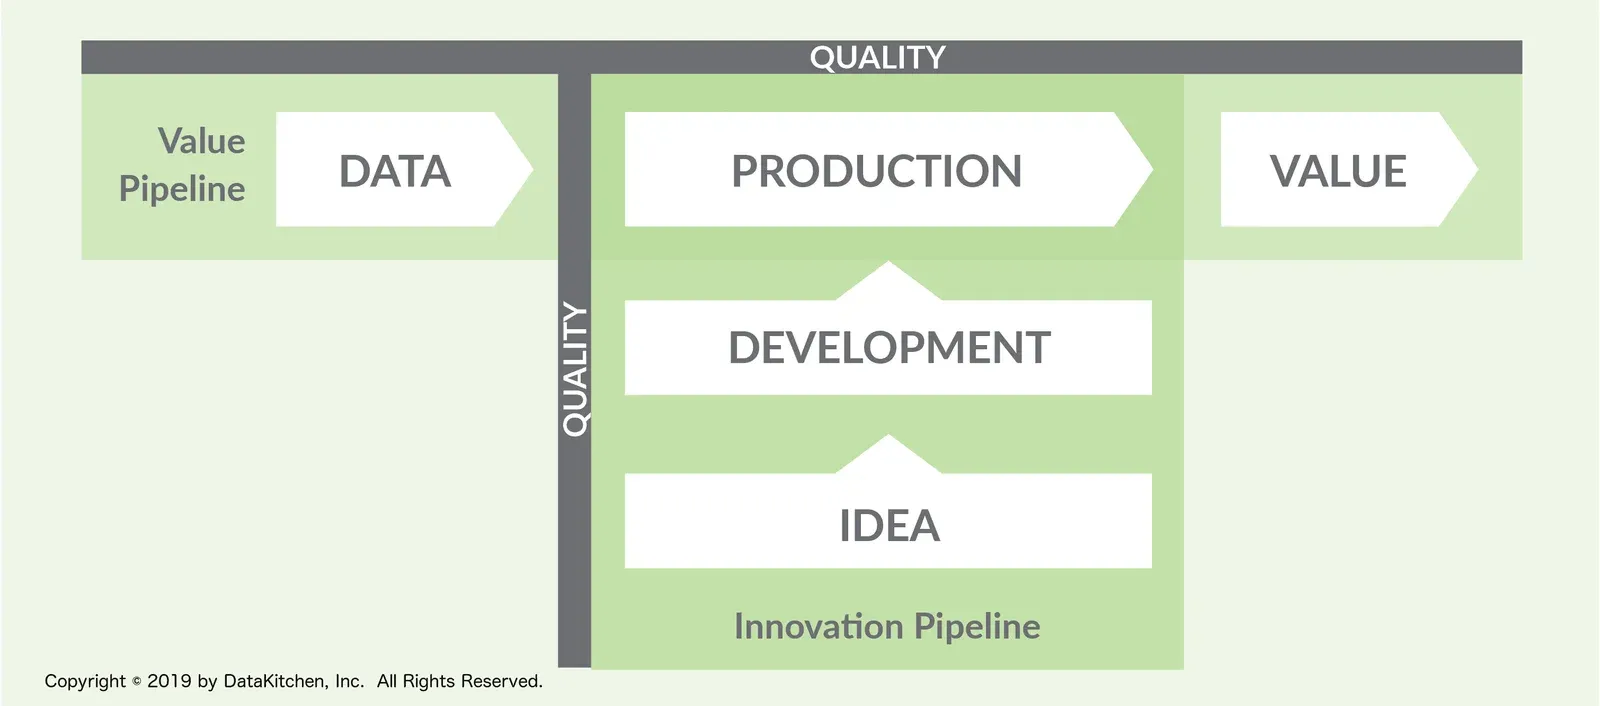
Data teams can learn a lot from the quality methods used in automotive and other industrial manufacturing. Methodologies like Lean Manufacturing and the Theory of Constraints apply just as well to data operations and analytics development as traditional factories. Analytics is a pipeline process. Data sources enter the enterprise, are loaded into databases, undergo processing and transformation, and then feed into charts, graphs and predictive analytics. From a process perspective, this workflow is a manufacturing operation. New analytics are much like manufacturing engineering, creating new and improved operational capabilities. As every factory manager knows, change management is a critical aspect of operations.
Following the Lead of the Software Industry
If you haven’t encountered these ideas before, you may think that I am writing something revolutionary. Actually, the methods described here are widely implemented in the software industry. While a data team might require six months to release a 20-line SQL change, Amazon recently disclosed that their Amazon Web Services (AWS) team performs 50,000,000 code releases per year. If your data team had the same processes and methodologies in place as Amazon, you could ask a complex question about your customer segmentation or operations and receive an answer the same day. The number of “what-ifs?” that you could pose would increase by 50X. Imagine what that could do for creativity and business innovation in your enterprise.
DataOps — Applying Manufacturing Methods to Data Science
The data analytics industry today is much like the software industry of the 1990’s — producing releases at a slow pace and incurring technical debt. The good news is that the software industry discovered a path forward using classic manufacturing methodologies. Furthermore, these ideas are gaining traction in the data analytics world.
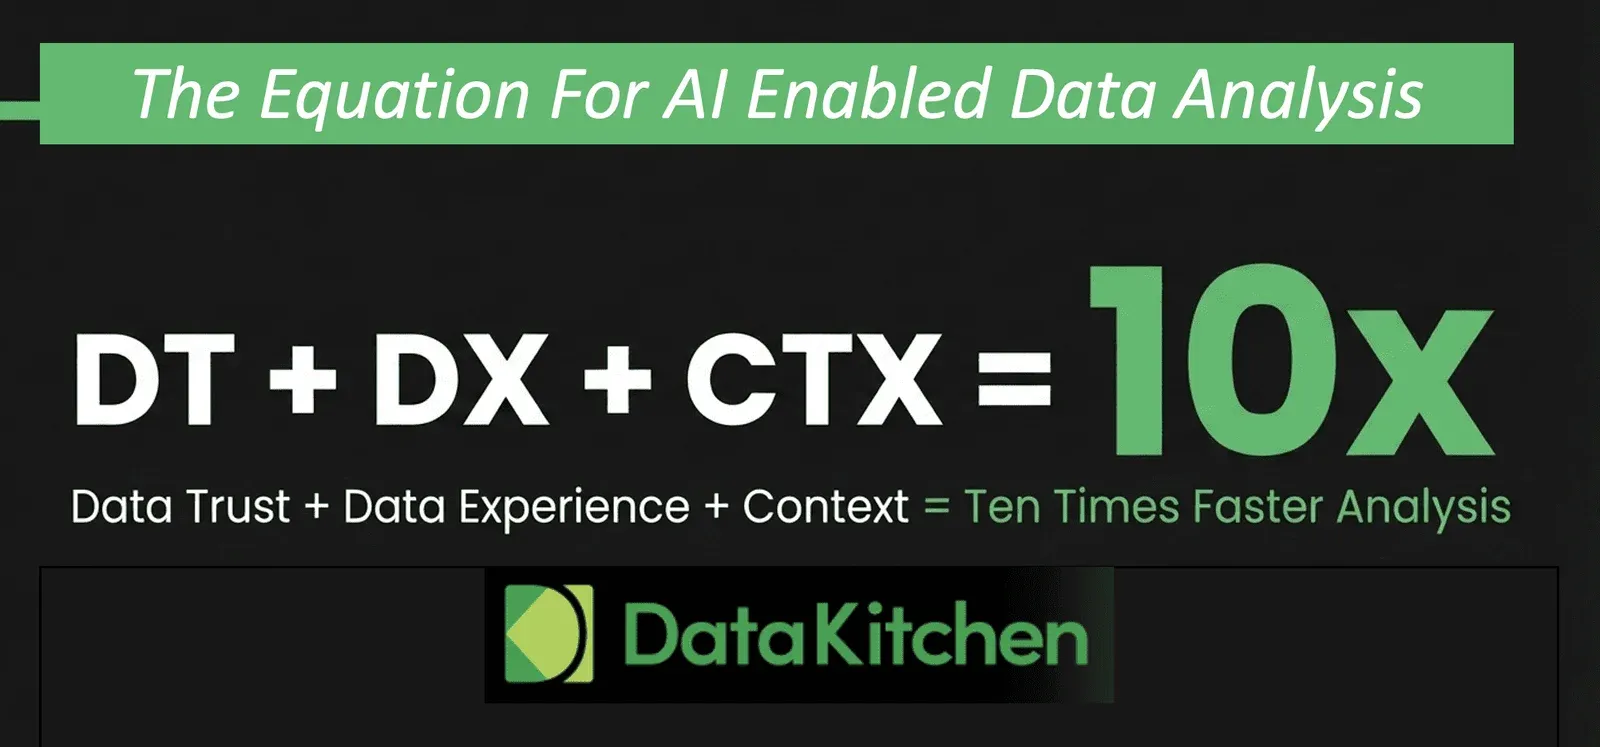
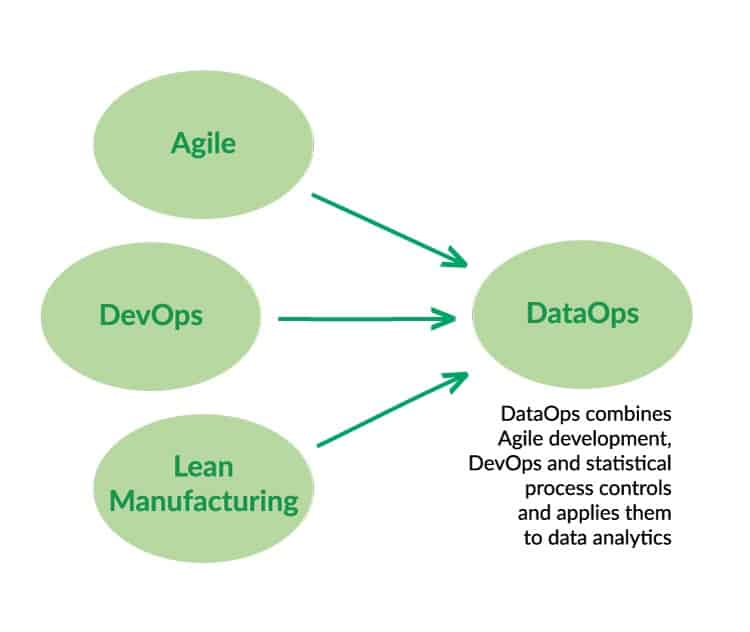
The data science industry refers to these methods under the umbrella term _DataOps_. Just to be clear, DataOps is not a single vendor. It is not a particular tool. You do not have to throw away your existing infrastructure and start over. DataOps augments your existing operations. It is a new approach to data science which draws upon three widely-adopted methodologies that are supported by tools and software automation: Agile Software Development, DevOps and statistical process controls (SPC).
Agile Development
One axiom in the Theory of Constraints is that small lot sizes reduce inventory, minimize waste and increase the overall system throughput of a manufacturing operation. This insight inspired the software industry to create a methodology called Agile development. Studies show that Agile projects complete over 30% percent faster and with a 75% lower defect rate. Today, two-thirds of software organizations describe themselves as either “pure agile” or “leaning towards agile.
Traditional project management utilizes a Waterfall sequential methodology. Projects are executed according to lengthy, complex schedules with a single deliverable at the end. There are several problems with this methodology in data science. In analytics, business conditions are constantly changing so whatever business colleagues needed several months ago has changed or is no longer of value. In other words, requirements have a shelf life. Additionally, waterfall projects are, by design, methodical (slow) and inflexible. Waterfall projects subject to rapid-fire requirements flowing in from business users never exit the planning (and replanning) phase.
In a nutshell, Agile project management delivers valuable features in short intervals and seeks immediate feedback. Large initiatives are broken into small increments and delivered iteratively. In Agile, the data science team responds faster and aligns more closely with the requirements and immediate priorities of end-users. The Agile methodology is particularly effective in environments where requirements are quickly evolving — a situation well known to data science professionals.
Some enterprises understand that they need to be more Agile, but organizations typically do not receive much benefit from Agile methods if quality is poor or deployment processes involve lengthy and laborious manual steps. “Agile Development” alone may not make a team more “ agile.”
DevOps
Imagine clicking a button in order to fully test and publish new analytics into the production pipeline. That’s how Amazon and others deploy software releases in minutes or seconds. This approach to releasing software is called DevOps.
Traditionally, software organizations waited weeks or months for IT to install and configure development environments for new projects. DevOps automates this process by placing it under software control. At the push of a button (or command), DevOps spins up a virtual machine and configures it with software and data. A data scientist can be up and running on a new development project in minutes.
DevOps also automates testing. An extensive battery of tests verify and validate that new analytics work and will operate error-free in an environment that exactly matches production. No more throwing new analytics over the wall and hoping that it doesn’t break anything. When testing is complete, analytics are quickly published to users via an automated workflow. This method of publishing software is also called continuous delivery or continuous deployment, and it is a central tenet of DataOps.
When environment creation, test and deployment are placed under software control, they can happen in seconds or minutes. This is how companies like Amazon attain such rapid cycle time.
Agile development and DevOps work hand in hand. Agile enables enterprises to quickly specify and commit to developing new features, while DevOps speeds execution, test and release of those features. Neither of these methods would be as effective without the other. Additionally, it’s impossible to move quickly when a team is plagued by quality errors.
Statistical Process Controls
Modern enterprises have hundreds or thousands of data sources flowing into their data pipeline. The sheer quantity of data powering analytics exceeds the monitoring capacity of the typical data team. Left unchecked, errors eventually creep into data, and data errors can break or invalidate analytics. If you’ve ever received a report that was based upon incorrect data, you have experienced this first hand.
DataOps approaches data errors the same way that a manufacturing operation controls supplier quality, work-in-progress and finished goods. DataOps borrows a methodology, straight from lean manufacturing, called statistical process control (SPC). Tests monitor data flowing through the pipeline and verify it to be valid, complete and within statistical limits. Every stage of the data pipeline monitors inputs, outputs and business logic. Input tests can catch process drift at a data supplier or upstream processing stage. Output tests can catch incorrectly processed data before it is passed downstream. Tests ensure the integrity of the final output by verifying that work-in-progress (the results of intermediate steps in the data pipeline) matches expectations.
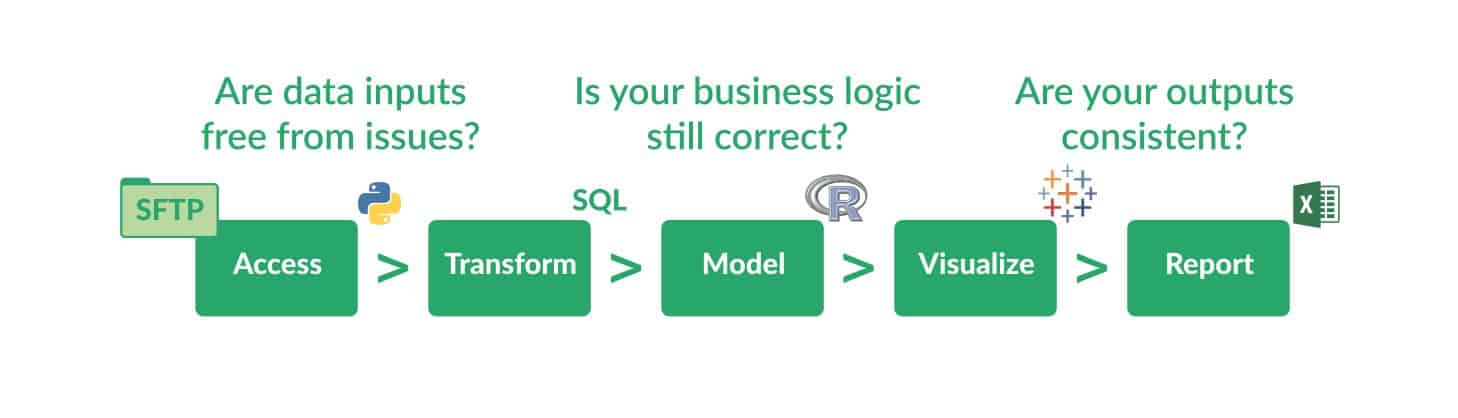
If an anomaly occurs at any point in the workflow or pipeline, the data team will be the first to know, through an automated alert, and they can take action. Test results can also be displayed in dashboards, making the state of the data pipeline transparent from end to end.
Turning Data into Value
As enterprises develop and deploy data analytics with DataOps, they can attain the same level of productivity that we see in leading software companies. Analytics will be created and deployed rapidly and statistical process controls will ensure that quality remains high. The data science team will respond to requests for new analytics with unprecedented speed and accuracy.
DataOps offers a new approach to creating and operationalizing analytics that minimizes unplanned work, reduces cycle time and improves code and data quality. It is a methodology that enables data science teams to thrive despite increasing levels of complexity required to deploy and maintain analytics in the field. Without the burden of inefficiencies and poor quality, data science teams can focus on their area of expertise; creating new models and analytics that fuel business innovation and create competitive advantage.