Data Breaks. Tools Break. You Break.
First To Know. Free To Fix.
Open source data quality testing and data observability software. No Limits. No Vendor Lock-in. No Six-Figure Contracts.
- Trusted by: Bristol Myers Squibb, Eisai, Catholic Relief Services, Progeny Health, X4 Pharmaceuticals, and more.
- 40,000+ Cookbook downloads 20,000+ Manifesto signatories
- A note to Great Expectations customers: buy from a profitable company

DataOps. End to End.
100% of the features.
10% of the price.
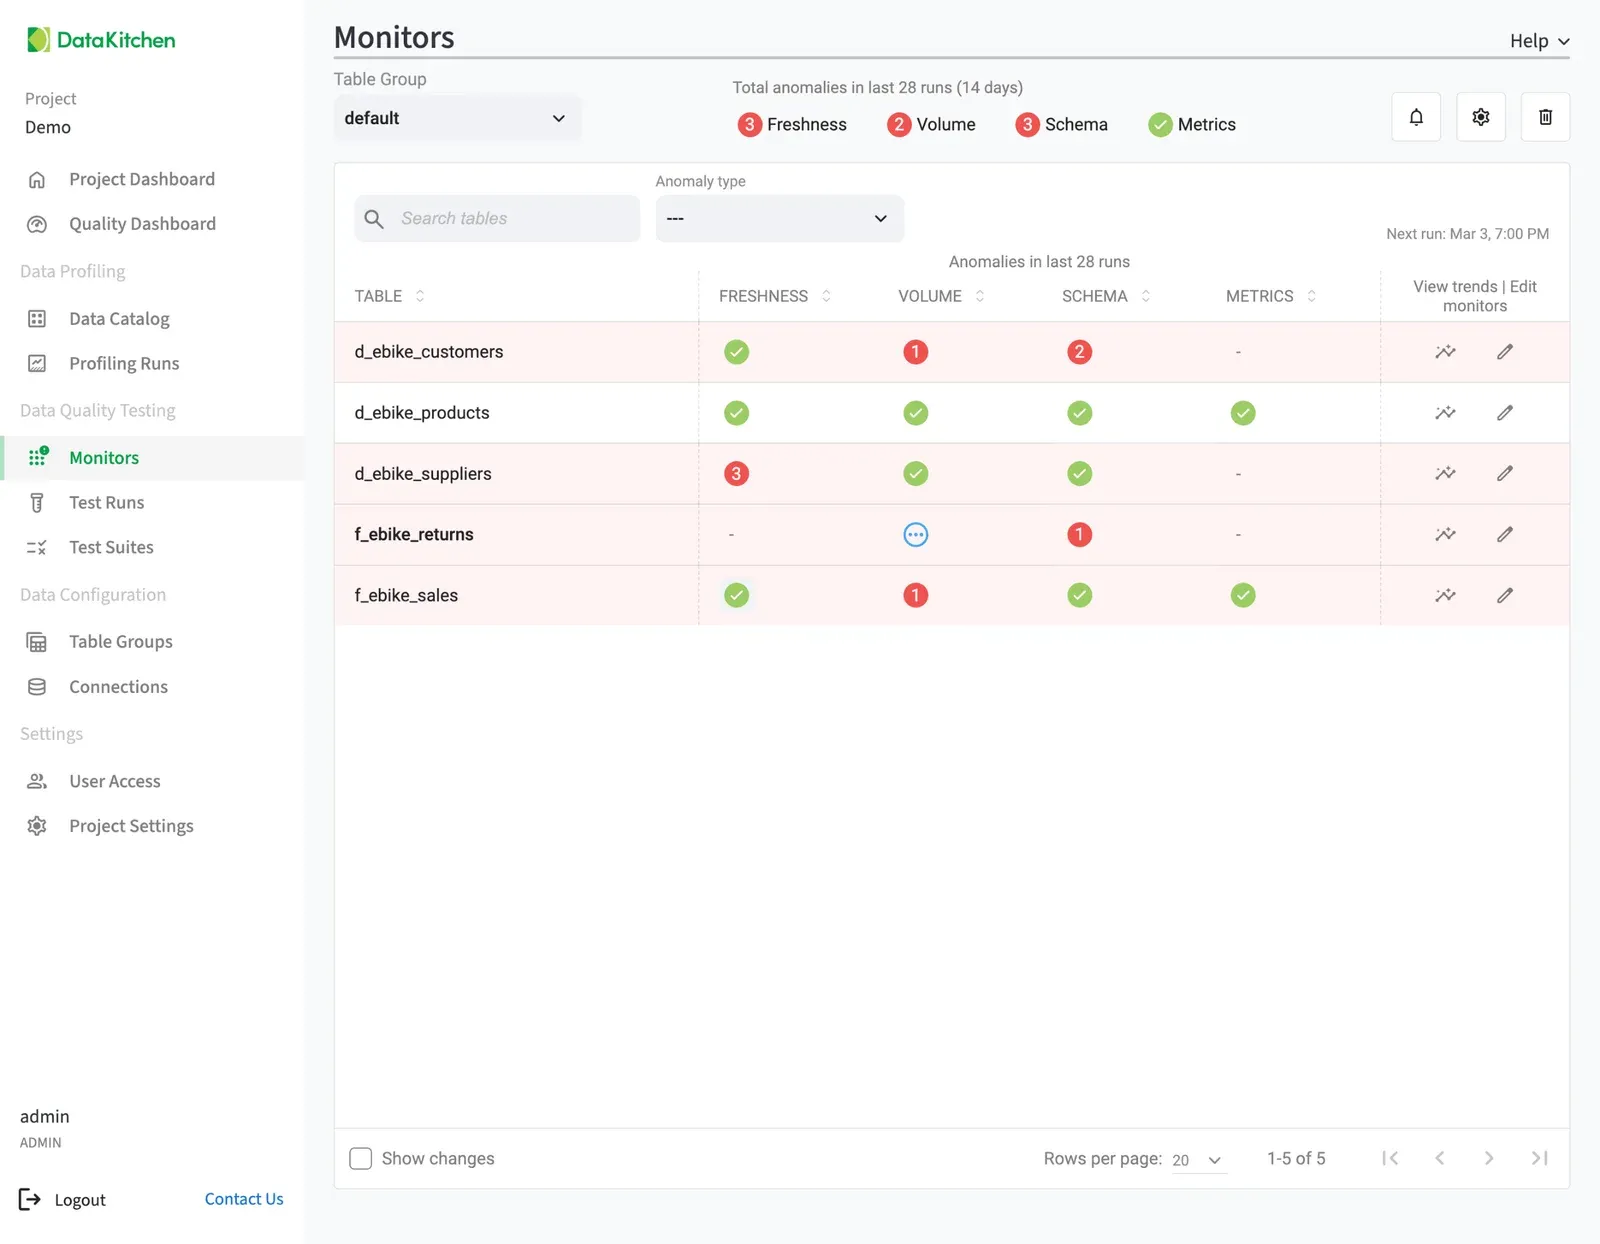
Two Apache 2.0 tools that profile your data, detect anomalies, monitor pipelines, and catch issues before they reach your customers. Built by the team that pioneered DataOps.
Compare Pricing- Unlimited testing, flat price. Test every table in every database. No per-table fees, no credit meters.
- Open source core, Apache 2.0 licensed. Start free with no feature gating. Profiling to anomaly detection, all included.
- No vendor lock-in. Self-host on your own infrastructure. Your data never leaves your environment.
- Bootstrapped since 2013. Profitable and independent. Our success depends on yours, not investor demands.
Up and Running in Under 30 Minutes
Install
Download Docker Compose and install TestGen
Connect
Point TestGen at your primary database
Generate
Auto-generate profiling and hygiene tests for every table
Compare
See results alongside your current tool
# TestGen install for Macs, Linux.
# Download the latest version of dk-installer.
$ curl -o dk-installer.py \
  'https://raw.githubusercontent.com/DataKitchen/data-observability-installer/main/dk-installer.py'

# Run the install command.
$ python3 dk-installer.py tg install

# More information? https://docs.datakitchen.io/testgen/get-started/install-on-mac-linux/# TestGen install for Windows.
# Download the latest version of dk-installer.
PS> Invoke-WebRequest `
-Uri 'https://github.com/DataKitchen/data-observability-installer/releases/download/latest/dk-installer.exe' `
-OutFile dk-installer.exe
# Run the install command.
PS> .\dk-installer.exe
# More information? https://docs.datakitchen.io/testgen/get-started/install-on-windows/Customer Story
We realized dramatic cost savings and also capitalized on opportunities better because we were more efficient and could do things more quickly.James Royster Former Head of Data Strategy & Operations, Celgene
The DataOps Experts
Over a decade of applying Agile, DevOps, and lean manufacturing to data operations.
What's Cooking at DataKitchen
Writing on DataOps, data quality, and our products.
Support
that actually
supports you.
Our support team is data engineers with decades of experience, not script readers. They help you get the software working, and they help you with the harder part: writing good data quality tests and improving your observability across the pipelines you care about. At no extra cost.
Enterprise customers get a standing weekly meeting. Open-source customers get monthly office hours, with weekly meetings on request.