How does a data team prevent poor data from poisoning AI when they have piles of raw and imperfect data?
What Does Flossing One Tooth Have to Do with Data Quality?
Surprisingly, the answer may comes from an unusual place.
Drug Launch Case Study: Amazing Efficiency Using DataOps
When launching a groundbreaking pharmaceutical product, the stakes and the rewards couldn’t be higher. This blog dives into the remarkable journey of a data team that achieved unparalleled efficiency using DataOps principles and software that transformed their analytics and data teams into a hyper-efficient powerhouse.
Webinar: DataOps For Beginners – 2024
If you’ve ever heard (or had) these complaints about speed-to-insight or data reliability, you should watch our webinar, DataOps for Beginners, on demand.
From Cattle to Clarity: Visualizing Thousands of Data Pipelines with Violin Charts
What do you do when you have thousands of data pipelines in production? Is there a way that you can visualize what is happening in production quickly and easily?
Data Quality Circles: The Key to Elevating Data and Analytics Team Performance
DataOps Quality Circles are focused teams within data and analytics organizations that meet weekly or monthly to drive continuous improvement, quality automation, and operational efficiency. By leveraging the principles of DataOps, these circles ensure that data processes are error free, consistent, and aligned with business goals.
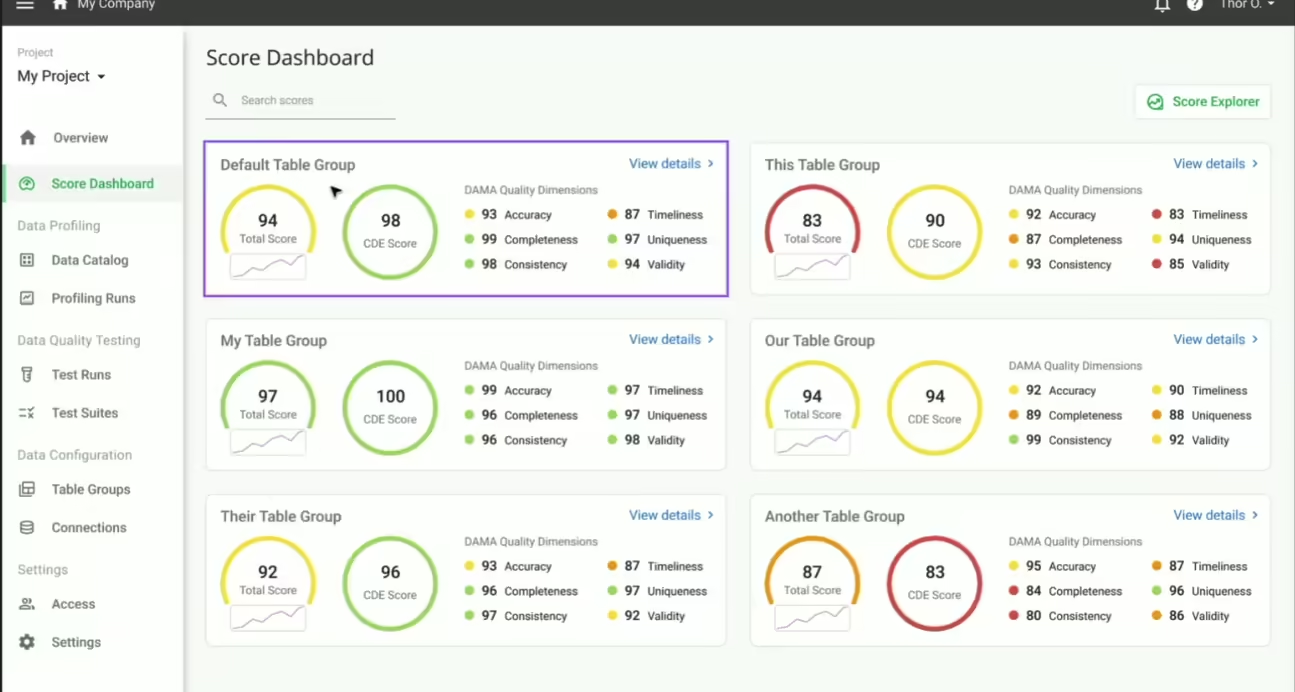
DataKitchen’s Data Quality TestGen Found 18 Potential Data Quality Issues In A Few Minutes!
Imagine a free tool that you can point at any dataset and find actionable data quality issues immediately! I took DataKitchen’s Data Quality TestGen for a test drive on ~600k rows of Boston City data and found 18 data quality hygiene issues in a few minutes.
Believe It Or Not, Your Tools are DataOps Compatible
Almost every data analytic tool can be used in DataOps, but some don’t enable the full breadth of DataOps benefits. DataOps views data-analytics pipelines like a manufacturing process that can be represented by directed acyclic graphs. Each node in the graph...


