A global financial institution with more than 70 million retail customers in more than 30 countries wanted its data organization to move faster. It could not move faster by loosening governance. Regulations such as the Gramm-Leach-Bliley Act (GLBA) and the California Consumer Privacy Act (CCPA) require enterprises that collect customer data to manage it carefully. Uncontrolled behavior is not an option. But onerous governance policies severely limit innovation, and this bank had the receipts.
The customer is not named here. The case study this post is drawn from described them only by industry and scale, and we have kept it that way. Every figure below is the customer’s own, recorded during the engagement and published in that 2020 case study: the 10-to-20-week baseline, the three-week build, and the step timings. None of it is a projection or an industry average.
Ten to twenty weeks for a sandbox
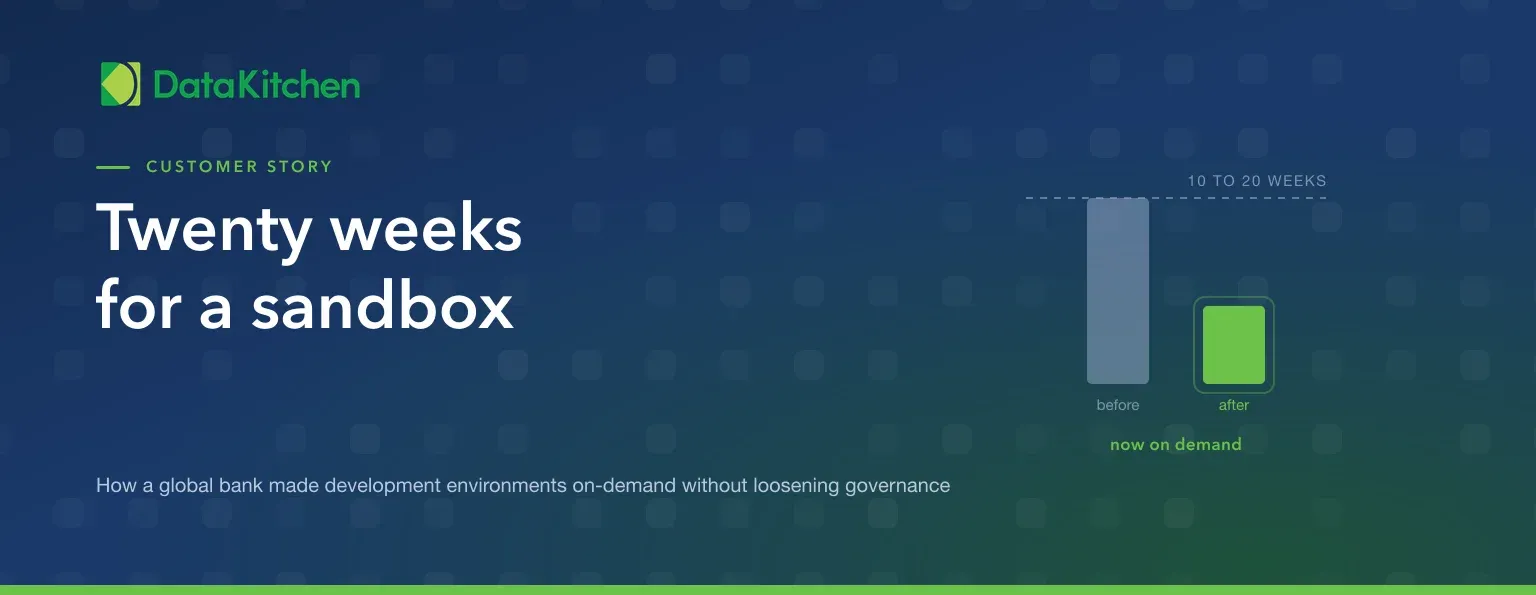
Policy at the bank required that each project receive its own development environment: a sandbox, with its own machine resources, tools and data. Under the process in place, creating one took 10 to 20 weeks.
The delay was not in any single step. It was in all of them, run in series:
- management approvals
- user authentication
- purchase and provisioning of hardware and software
- preparation of data
None of that is unreasonable on its own. Added together, it meant a quarter or more elapsed before an analyst could write the first line of a new project. Eliminating that start-up time would promote self-service analytics and data democratization. It would also, apparently, mean giving up the controls the bank was not allowed to give up.
That is the conflict the project had to resolve: how do you empower self-service analytics and innovation while maintaining necessary governance?
The answer was orchestration, not exemption
The management team understood that the DataKitchen Platform could resolve the conflict with DataOps automation rather than with an exception process. DataKitchen orchestrated the tools the team already ran, in a way that fit the workflows they already used, and monitored governance policy while it did so.
NOTE
This case study was written in 2020, when the product was called the DataKitchen DataOps Platform. It is DataOps Automation today. Kitchens, Recipes and orders are still current core concepts of that product: the name changed, the orchestration model did not.
The Platform was configured to manage the end-to-end lifecycle of self-service sandbox development environments. Each environment consisted of:
- SQL Server database
- Prepackaged data sets
- Tableau project
- DataKitchen Kitchen: a workspace that integrates tools and workflows
- Role-based access control
- Governance: tracking user activity with respect to regulated data
- Integration into a JIRA front end
The solution was completed in three weeks and quickly shared throughout the data organization. Workflow orchestration reduced the cycle time for sandbox creation from months to minutes and hours.
Sandbox environment creation cycle time
| Original workflow | DataKitchen | Change | |
|---|---|---|---|
| Elapsed time | 10 to 20 weeks | On-demand | -99+% |
Governance automation went into the sandbox life cycle at the same time. When users instantiated sandboxes on demand, the Platform invoked background processes that monitored those users from a governance perspective. Transparency improved, detailed logs of user activity appeared, and none of it interfered with user productivity.
Inside the orchestrated workflow
Step 1: Request
Elapsed time about 5 minutes.
A data team member completes a JIRA form to request a sandbox for a new project. The form carries check boxes for prepackaged data sets and an option to create a Tableau project. It also captures the user ID of the requestor and the other users who will have access to the environment, so those users can be authenticated and tracked later. Once the ticket is approved in JIRA, the Platform creates the sandbox.
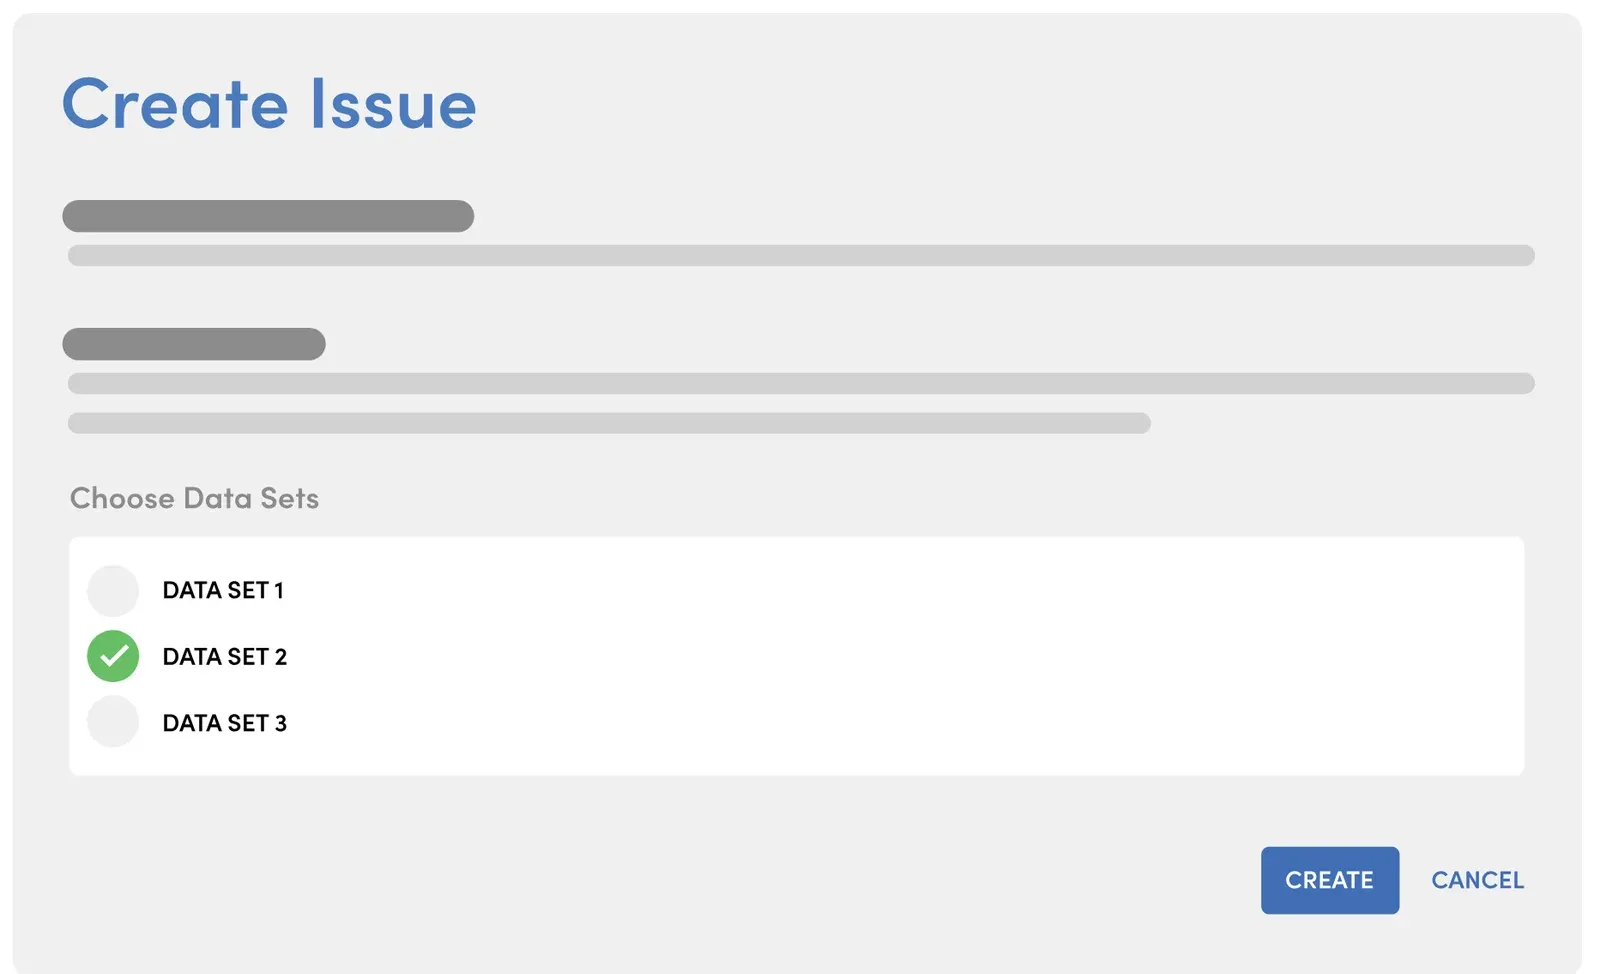 Figure 1: A data analyst kicks off sandbox creation by completing a JIRA form. The request is an ordinary ticket in a tool the team already uses, which is why there was nothing to roll out.
Step 2: Environment creation
Elapsed time about 1 minute, plus a data copy.
The Platform validates user credentials, instantiates machine resources, creates a database and a Tableau project, and copies the requested data: whatever options the user asked for. A monitor Recipe, an orchestrated sequence of events running as a background process, then tracks the created database to ensure compliance in access and in data. If an unauthorized data set is added, the monitor Recipe raises an alert to the data steward or the governance team.
Step 3: Environment decommissioning
Elapsed time about 1 minute, not including data deletion.
When development is done, the user advances the JIRA project ticket to the done state. That launches a decommission Recipe, which deletes the sandbox environment and releases all allocated resources. The Kitchen is closed, which updates Git with the code changes. The ticket moves to closed.
Decommissioning being part of the same workflow is the part teams tend to skip. An environment that is easy to create and hard to delete becomes a governance problem of its own within a year.
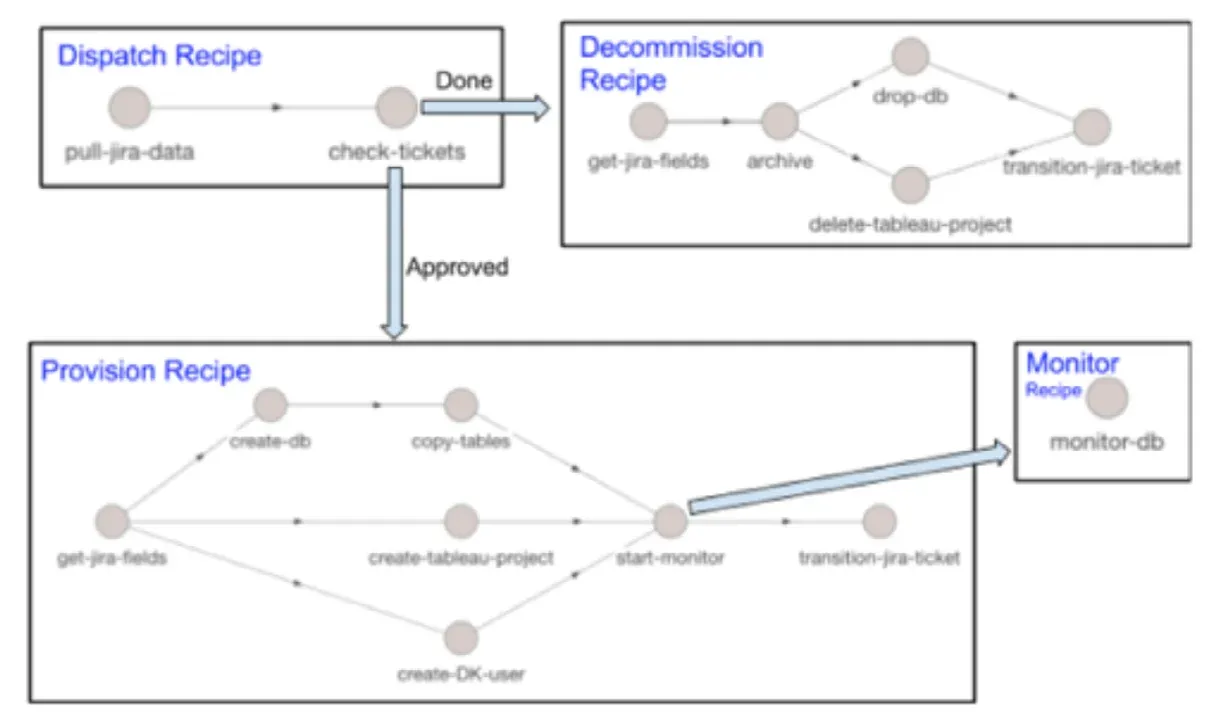 Figure 2: Management of a self-service sandbox involves five DataKitchen orchestrations that dispatch, provision, decommission and monitor the environment. The dispatch Recipe reads JIRA and routes; the monitor runs for as long as the sandbox does.
Automated governance
Self-service sandbox creation improves agility. The interesting half of this project is that the Platform also automated the governance.
The monitor Recipe inspects the sandbox environment and detects when a user performs an operation that violates governance. A user might create an unauthorized database table, or export sensitive data. When a violation occurs, the monitor Recipe sends an alert to the appropriate governance body. All operations performed within the sandboxes are monitored, controlled and auditable.
Automated tests confirm that the operations themselves execute without errors. Recipes track create and delete events related to databases, tables, Tableau projects and Kitchens, and a log report makes it easy to review the events and the status of all of them.
The end-to-end process is controlled by the data team’s JIRA workflow software. The orchestration verifies the roles and permissions of users as part of execution. The history of events is available in the DataKitchen UI, including order run history and the details of each provisioning and decommissioning.
IMPORTANT
Being able to view a detailed log of events is critical in a regulated industry like financial services. The company has to be able to answer an audit with specific information about how data was used, by whom, and how it is governed and controlled. Monitoring and transparency are what make governance more efficient and more effective, not more approval gates.
That is the inversion worth taking from this project. The manual process controlled the creation of an environment and then largely stopped looking. The automated process granted the environment immediately and watched it continuously. Fewer gates, more evidence. The same reframing drives continuous governance with DataGovOps and the DataGovOps solution, and it is the argument of the Data Governance as Code white paper.
What came next
Improving cycle time without sacrificing governance helped the data team speed ideas into production and collaborate more. The success of the sandbox governance orchestration project raised the prospect of putting the Platform into other parts of the enterprise’s workflows: deploying analytics into production, and adding the statistical controls that virtually eliminate data errors. The company planned to explore both, to further shorten analytics cycle time while improving quality and robustness.
Conclusion
A tier-one financial enterprise relies on the DataKitchen Platform to orchestrate and monitor its analytics development environments. It cut 10 to 20 weeks out of the cycle time of every new analytics development project, and with it the project costs and the bureaucracy. Automated user validation and activity logging made governance of sensitive data more thorough and more reliable at the same time. The data team now works with more agility and more transparency, which is what stimulates innovation, while adhering to the strict governance that financial services markets require across the globe.
TIP
Environments are the pinch point in most data organizations, not the analytics. See how environments power DataOps innovation, or request a demo of DataOps Automation.
FAQ
What are the key points in this blog?
A global financial institution took 10 to 20 weeks to create a development sandbox, which made self-service analytics impossible in practice. DataKitchen orchestration reduced that to on-demand, a cut of more than 99 percent, and automated governance at the same time: a monitor Recipe inspects each sandbox for as long as it exists and alerts the data steward on a violation. The solution took three weeks to build.
Why did it take 10 to 20 weeks to create a development sandbox?
Because every step waited on a person. The bank’s policies required each project to get its own environment, and that meant management approvals, user authentication, purchase and provisioning of hardware and software, and preparation of data. No single step was unreasonable. Run in series, they added up to a quarter or more before anyone could write a line of analytics.
Can you have self-service analytics and data governance at the same time?
Yes, if governance is automated into the provisioning workflow instead of enforced by an approval queue. This bank granted sandboxes on demand and had a monitor Recipe inspect each one for as long as it existed. Users moved faster, and the governance team ended up with a more detailed audit trail than the manual process had ever produced.
What is a self-service analytics sandbox?
A private development environment that a data team member gets for one project. At this bank each sandbox held a SQL Server database, prepackaged data sets, a Tableau project, a DataKitchen Kitchen, role-based access control, governance tracking of activity against regulated data, and a JIRA front end for requesting and closing it.
How does automated governance detect a violation?
A monitor Recipe runs as a background process against the live sandbox and inspects it for operations that breach policy: an unauthorized database table, an export of sensitive data, an unapproved data set added to the environment. When it finds one it alerts the data steward or the governance team rather than blocking the user mid-task.
What happens when a development sandbox is no longer needed?
The user moves the JIRA ticket to done, which launches a decommission Recipe. It archives, drops the database, deletes the Tableau project, releases the machine resources, closes the Kitchen so the code changes land in Git, and transitions the ticket to closed. About a minute, not counting the time to delete the data.
Which orchestrations run the sandbox lifecycle?
Five, handing off to each other. A dispatch Recipe pulls JIRA data and checks tickets. An approved ticket triggers a provision Recipe that creates the database, copies tables, creates the Tableau project and the DataKitchen user, then starts the monitor. A ticket marked done triggers a decommission Recipe. The monitor Recipe runs for the life of the environment.
Why does a bank need an audit trail of sandbox activity?
Because it has to answer an audit with specifics about how data was used and by whom. Regulations such as the Gramm-Leach-Bliley Act and the California Consumer Privacy Act require enterprises that collect customer data to manage it carefully, and a regulator wants evidence that a policy held, not an assurance that one existed.
How long did the implementation take?
Three weeks to build, after which it spread through the data organization without a rollout program. That is the usual shape for this kind of work: the orchestration wraps tools the team already ran, so there is no migration to schedule and nothing new for a data analyst to learn beyond a JIRA form they already knew how to fill in.
Does automating governance mean fewer controls?
Usually more. The manual process controlled sandbox creation through an approval queue and then largely stopped watching. Automated governance granted the environment immediately and then monitored it continuously, logging every create and delete event against databases, tables, Tableau projects and Kitchens. More gets observed, not less, and the log is machine-generated rather than reconstructed later.
Which DataKitchen product does this case study describe?
DataOps Automation, which was called the DataKitchen DataOps Platform when this case study was written in 2020. The Kitchens, Recipes and orders in the story are current core concepts of that product rather than retired ones. The name changed. The orchestration model did not.
What should a data team measure to prove a project like this worked?
Cycle time first: the elapsed time from a sandbox request to a usable environment, which here went from 10 to 20 weeks to on-demand. Then measure what governance can see: alerts raised, create and delete events logged, and how fast the team can answer an audit question about who touched which regulated data.