Nobody at the company could tell you what was in their own database. The team was not careless. The main care management application holds about 1,000 tables, the data arrives from clients who send whatever they have, and no tool in the building could answer the question at that scale.
“Never had a tool to understand what is going on,” is how their database engineer described the starting point.
The customer is a national, tech-enabled women’s healthcare company with over 200 employees. They asked us to keep their name out of it, so we have. They bought DataOps TestGen Enterprise in mid-2025 with three users and two database connections, and this is what the year after looked like, including the parts that went wrong.
The answer they arrived at is the part to copy. This team stopped treating data quality as a cleanup task. Bad email addresses and whitespace-padded fields got corrected once, and then the recurring patterns went to the application engineering team so those fields get validated where clinicians type them. Cleanup is a job that repeats forever. Validation at entry is a job you do once. Test results are what let a data engineer make that case with evidence rather than opinion.
The environment, because fit is the first question
If you are evaluating a tool, you want to know whether it runs on your stack before you care what it finds.
They are an Azure shop. SQL Server versions from 2019 to 2022, a mix of Azure SQL databases and managed instances, one SQL Server on an Azure VM, Tableau and SSRS on top, SSIS jobs moving incremental changes into a dimensional warehouse overnight. Later, a Snowflake environment with more than 100 schemas.
TestGen Enterprise went onto Kubernetes in Azure. We recommended putting its Postgres on its own managed instance rather than in a container, which is the advice that matters if you plan to keep history. Upgrades since then have taken about ten minutes including the database migration step, and one of them needed a hard browser refresh afterward to clear a stale front end.
They had tried the open source edition first and had a hard time getting it installed. The install was the first real cost, and it took help.
Why the data is hard
Nurses and care coordinators work in the application through the day. Two things make the data harder than a table count suggests.
The first is that a lot of it is typed by clinicians under time pressure, in an application used from 8am to 8pm. Birth dates get transposed. Weights get entered wrong. Email addresses get a character off and nobody finds out until a message bounces.
The second is that much of the inbound data does not belong to them. Health insurers send claims and eligibility files during evaluation, and those arrive in whatever shape the sender happens to produce. Column headings change between months. Whole columns come through empty. There is a data contract, and prospective clients do not always follow it.
The first thing that went wrong was ours to fix
The team pointed TestGen at the live transactional database and profiled five tables, none larger than a million rows. The application slowed down for 20 minutes.
If you take one thing from this post, take this one. Profiling reads a lot. A transactional system serving clinicians does not have the headroom, and the table count is not what predicts the damage.
Profiling moved to a replicated copy of production. The team set up table groups and schedules so the heavy work runs in the overnight window the application leaves open, and staggered the long-running tests rather than firing them all at once. Very large tables came out of the profiling set until they could be segmented behind views, because a profile of one humongous table averages away the thing you were looking for. If a table mixes cotton balls and MRI scans, the column statistics describe neither.
Organizing by business area, not by schema
Table groups got named after the business, not the database: authorizations, members, claims. This sounds like housekeeping. It is the decision that makes every later conversation possible, because a failing test now has an owner without anybody having to translate a schema name into a department.
What profiling actually surfaced
Profiling produces a hygiene issue list before you have written a single test. This is TestGen’s own demo project rather than the customer’s data, but the issue types are the same ones that came back on the care management database:
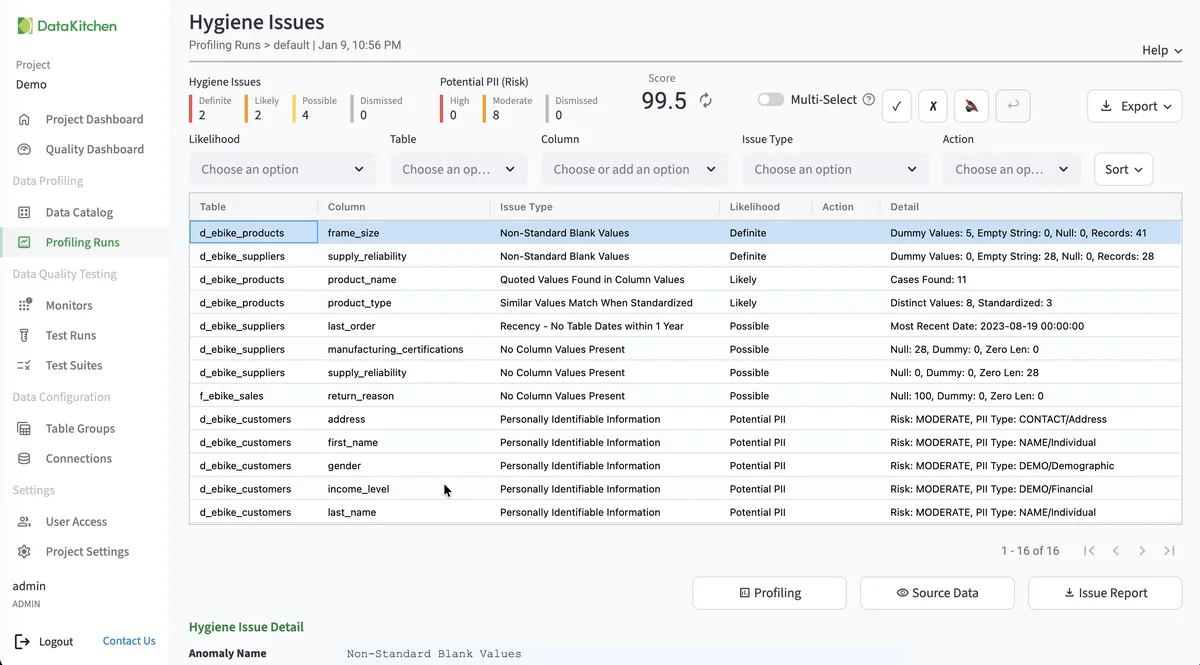
Three rows on that screen map directly onto what this team found. Non-Standard Blank Values is the blank-and-whitespace problem that later became an application change. Similar Values Match When Standardized is the same field spelled four ways, the classic being Boston, boston, and BOSTON in one column. No Column Values Present is the empty column that arrives in a client file and gets loaded anyway.
The likelihood rating is the part engineers tend to appreciate. A profiler that flags everything at equal weight produces a list nobody reads. Sorting into Definite, Likely, and Possible is what makes the first pass triageable by one person.
What clinicians actually fixed
The team sent test result reports to the clinicians who own the records. Things got corrected: bad email addresses, typos in birth dates, newborn weights that were simply wrong.
They also added tests for values that cannot exist. A newborn cannot weigh 100 pounds. That test is trivial to write and it catches a class of error no amount of downstream cleanup prevents, because the value is plausible to a database and impossible to a nurse. Any domain has these. A temperature of 120 degrees. A discount larger than the maximum allowed discount. They are the cheapest tests you will ever write and they find real defects.
Their database engineer’s summary of that phase: “People are impressed with what was found.”
The part that matters more than the cleanup
Then the team did the thing that separates a data quality project from a data quality program. They took the recurring patterns to the software engineers.
Bad email addresses do not need to be found every month. They need to be checked on entry. Fields padded with whitespace do not need to be trimmed in the warehouse forever. They need to be trimmed where they are typed. Application changes to close those gaps went onto the engineering plan for the following quarter.
This is the whole argument for testing your data. Finding an error is worth something. Removing the mechanism that generates the error is worth much more, and you cannot make the case for the second one until you have counted the first one. The test results were the evidence.
Where the built-in tests stop
Two gaps showed up, and if you work in healthcare payer data you will hit both.
The first is provider data. The team pulls NPI data from the CMS website through a pipeline, and it is their single largest source of data quality failures. The interesting part is which half fails. The NPI numbers themselves are mostly fine. The metadata attached to them, the names and the addresses, is not. That data is only as good as the government makes it.
The second is referential integrity across a wide surface. A chart ID has to be valid across roughly 50 tables, and those tables span about ten test suites and more than one project. That is custom SQL. Test suites attach to one table group, so a check that spans the estate gets copied into each suite that needs it, and copying across projects is a manual step. If your model looks like that, plan for the copying.
Sorting tests by what they cost the business
A later release grouped tests by impact dimension: reliability, conformance, regularity, and usability. Usability covers the failures nobody writes a ticket for.
The example this team hit was inconsistent null representation. A column where absence is sometimes null, sometimes NA, sometimes a dash, sometimes whitespace. Nothing is broken. Every count is wrong, and the business users arguing about which number is right have no idea why. Scorecards default to grouping by these dimensions, which puts that category in one view instead of scattered through a test list.
Making results land where people already look
A finding that stays inside a data quality tool has not changed anything yet. Four channels carry results out.
Notifications post into a Microsoft Teams chat, currently by way of an email integration. The team opens an Azure DevOps ticket from the result report and tags the owning team members so it lands on their board. The team reviews findings in a standing bi-weekly meeting. And profiling and hygiene results feed the data warehouse, which drives executive dashboards and lets them trim the Postgres instance behind TestGen back to six months or a year of history.
Data quality results became a reported metric in the same warehouse as everything else the executives look at. That is what it means for testing to be part of operations rather than a side project.
One honest note on the human bottleneck. Muting tests that do not apply to a given table group, and opening the tickets, both still route through one engineer. Automating ticket creation is on their list precisely because they can see themselves in the critical path.
Wiring tests into the pipeline
The REST API is the piece a data engineer should look at first. It triggers test runs, which means testing can hang off the pipeline rather than off a schedule.
The difference matters. A schedule tells you the data was wrong at 3am. A pipeline gate stops the run when a test fails and keeps the bad load from reaching a dashboard at all. The documented workflow is start a job, poll for status, check for failures, and decide. This team began with production incident checks and is heading toward continuous integration testing.
Drift monitoring came in with a later release and started catching freshness changes and schema changes on its own, which is the data observability half of the job rather than the testing half. Freshness drift showed up as expected. Schema drift showed up less than they anticipated, which turned into a support conversation rather than a silent assumption, and that is the right outcome for a monitoring feature you are still learning to trust.
What it does not do
If you are evaluating TestGen, these are the walls this team found. All of them are real.
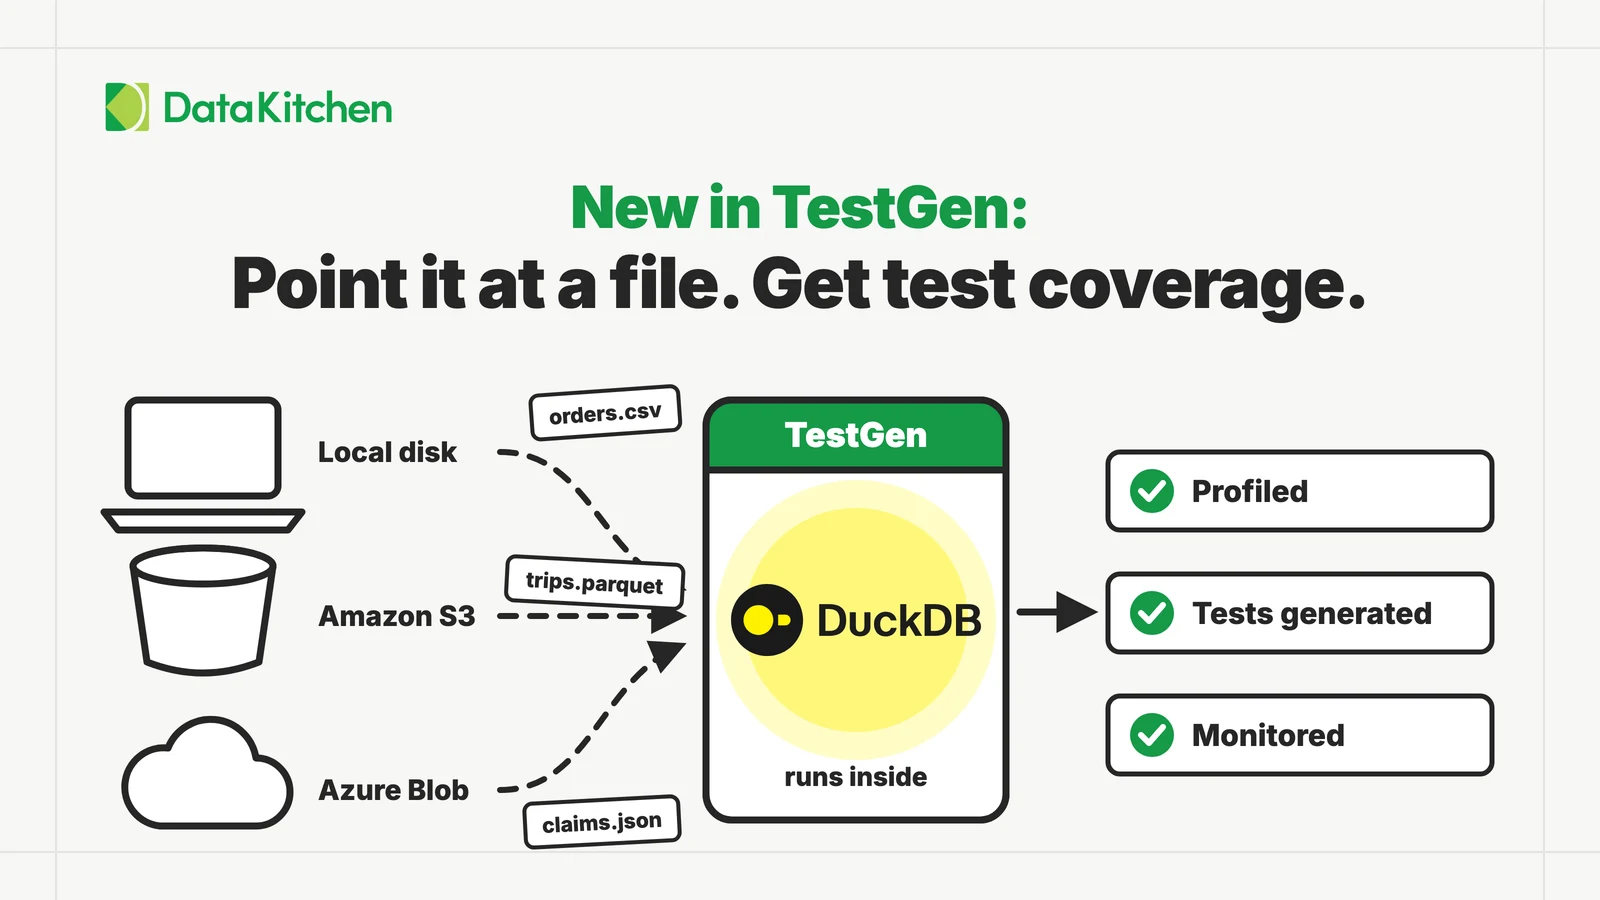
It needs a database connection. It cannot point at a CSV on a network share, at S3, or at Azure blob storage. Files have to be loaded into a table first, or mounted as an external table in Snowflake, which works but is a Snowflake setup step rather than a TestGen feature. For a team whose inbound data arrives as inconsistent CSVs from prospects, that is friction, and a file-native path with reusable test suites per file type is a real gap.
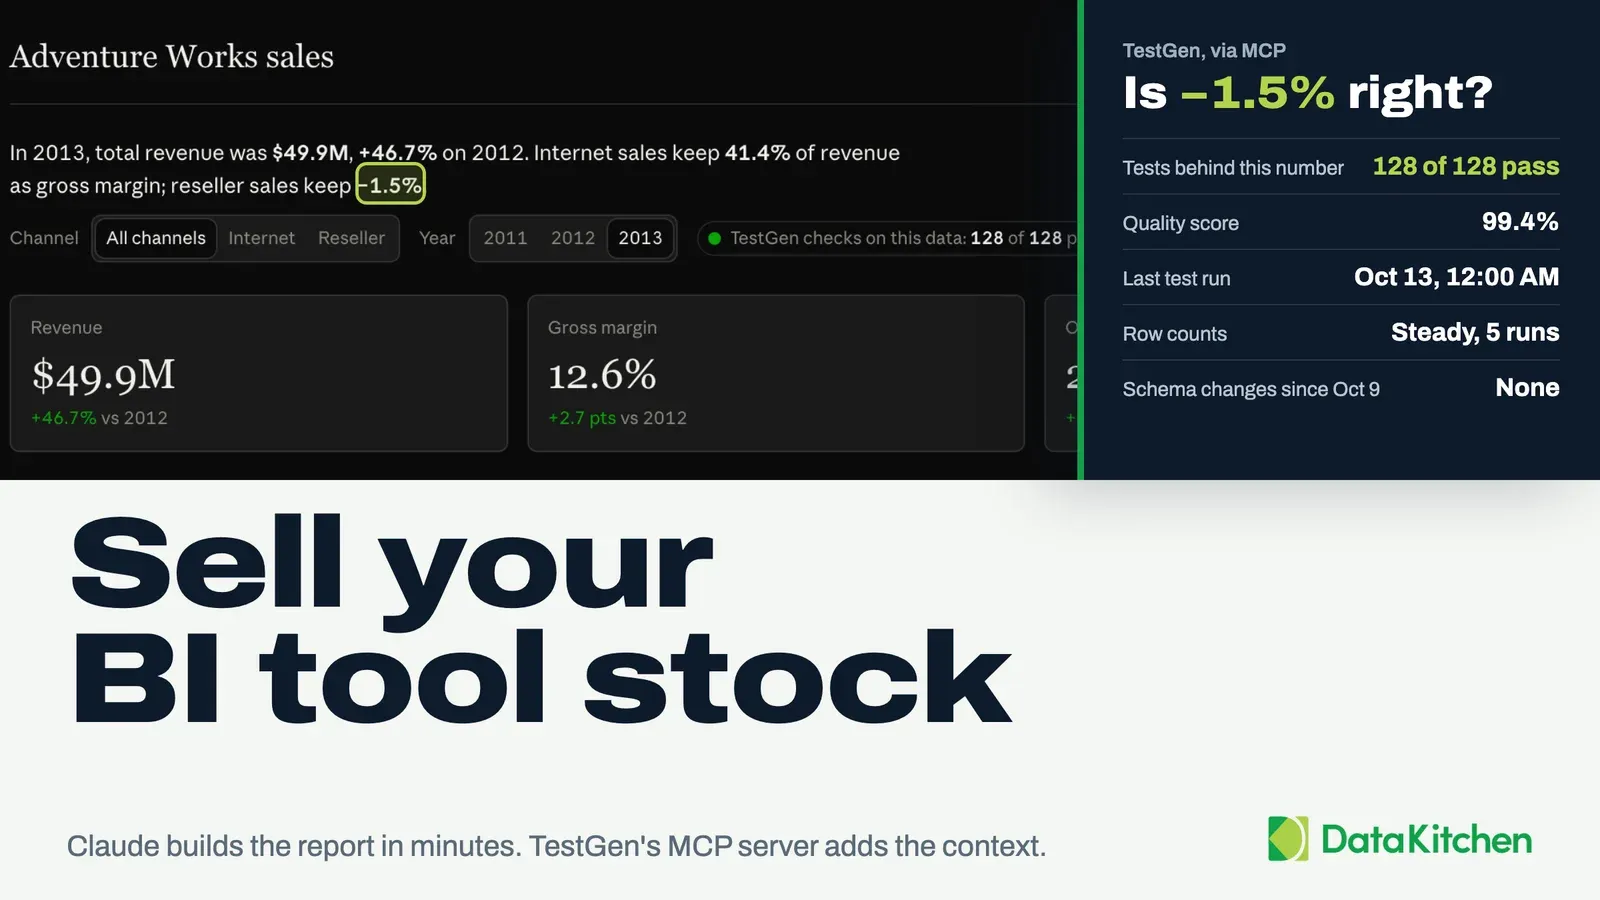
It does not write to your database. When the MCP integration suggests SQL to fix a hygiene issue, it hands you the query to review and run. That is a limitation and also the reason their security review went anywhere at all.
The data catalog is a view onto what profiling already knows, not a lineage tool. This team wanted to start at a metric, follow it into a Tableau dashboard or an SSRS report, and walk down through the views to the source. TestGen does not do that, and it does not ingest SQL Server extended properties to enrich column descriptions either. Both are on the request list.
Webhook notifications do not exist yet, which is why the Teams alert path goes through email.
Inheriting a system, and proving what you inherited
The newest use case is one we had not seen before.
The team is taking over a Snowflake environment that an outside consulting firm built and ran. Before the handover, they profiled it. Not to fix it. To record it.
The reason is defensive and completely reasonable. When the internal team owns that environment and someone finds bad data in it, the question of who caused it comes up immediately. A profile taken before the transition answers it with evidence instead of memory. Garbage in, garbage out is easy to assert and hard to prove, and a baseline is the proof.
That environment turned out to be larger than expected: over 100 schemas, most tables over 100 million rows, and a 24-hour window to snapshot them. The constraint was the Snowflake warehouse, not TestGen. On an extra-small warehouse the work thrashes and pays a double penalty, slow and working harder than it needs to. Sizing up roughly doubles throughput per step. Budget for the compute if you are profiling at that scale on a deadline.
Where it stands
The account started with three users and two database connections. It went to five connections a couple of months later, then to seven with the Snowflake environment. They added read-only seats so the rest of the team can look at results without going through one person.
None of that is the interesting number. The interesting number is the count of application changes now queued up because a test found the same thing twice.
TIP
Want to profile your own database and see what comes back? Install Open Source TestGen. It is free, it runs in your environment, and profiling one table group is a short afternoon.
FAQ
What are the key points in this blog?
A national women’s healthcare company runs DataOps TestGen against a care management application of about 1,000 tables that no previous tool could describe. Profiling had to move off the live transactional database after five small tables slowed the application for 20 minutes. Test reports sent to clinicians corrected bad emails, mistyped birth dates, and implausible newborn weights. Recurring failures then became application changes.
How do you profile a production database without slowing the application down?
Point the profiler at a replicated copy rather than the live transactional database, and schedule runs for off hours. This team learned it the hard way: profiling five tables of under a million rows each slowed their care management application for 20 minutes. Their application is used from 8am to 8pm, which leaves a real overnight window.
What databases and deployment does DataOps TestGen need?
A database connection and somewhere to run. This team is an Azure shop on SQL Server 2019 through 2022, a mix of Azure SQL databases and managed instances, plus a Snowflake environment with more than 100 schemas. TestGen Enterprise runs on Kubernetes in Azure with its Postgres on a managed instance rather than in a container. Upgrades take about ten minutes.
Can you trigger TestGen tests from a CI/CD pipeline?
Yes, through the REST API. Tying tests to the pipeline beats running them on a schedule, because the pipeline can stop on a test failure and keep bad data from reaching a dashboard. The documented workflow is to start a job, poll for status, and check for failures. This team started with production incident checks and is moving toward pipeline gating.
Why fix the application instead of just cleaning the data?
Because cleanup is a job that repeats forever and validation at entry is a job you do once. This team found bad email addresses and whitespace-padded fields, corrected them, and then took the recurring patterns to their software engineers to check the email format on entry and trim the field. The error stops being generated instead of being caught again next month.
How do you get data quality results in front of the people who can act on them?
Give each audience the form it already reads. This team posts test notifications into a Microsoft Teams chat, and opens an Azure DevOps ticket from the result report, tagged to the owning team. The team reviews findings in a standing bi-weekly meeting. Profiling and hygiene results feed the data warehouse, so executives see them on their own dashboards.