
Why Manual Data Governance Fails
Data teams using inefficient, manual processes often find themselves working frantically to keep up with the endless stream of analytics updates and the exponential growth of data. If the organization also expects busy data scientists and analysts to implement data governance, the work may be treated as an afterthought, if not forgotten altogether. Enterprises using manual procedures need to carefully rethink their approach to governance.
With DataOps automation, governance can execute continuously as part of development, deployment, operations and monitoring workflows. Governance automation is called DataGovOps, and it is a part of the DataOps movement.
Instead of starting with a typical wordy definition of data governance, let’s look at some examples of the problems that governance attempts to solve:
- The VP calls a quarterly meeting with the global sales force to review the forecast for each territory. Some salespeople display only direct product sales — others commingle products, services and non-recurring engineering. Some team members include verbal commitments, whereas others report only bookings. Without a single definition of “sales,” it’s hard to obtain an accurate picture of what’s happening.
- Data resides in different locations and under the control of different groups within the enterprise. It’s hard to track and manage the organization’s data assets. It’s difficult to even know where to look.
- Some users export sensitive customer data to their laptop in order to work remotely using self-service tools. Some of this regulated data falls under GDPR, GLBA or California’s CCPA.
- The journey from raw data to finished charts and graphs spans groups, data centers and organizations. The data pipeline follows a complex execution path with numerous tools and platforms involved. When there is an issue to fix, who owns each part of the data analytics pipeline?
- Data is notoriously incomplete and full of errors. How can and should it be cleaned? Is it fit for a given use? How is data quality assured?
Often data governance initiatives attempt to address these issues with meetings, checklists, sign-offs and nagging. This type of governance is a tax upon data analyst productivity. DataGovOps offers a new approach to governance by building automated governance into development and operations using DataOps tools and methods. “Governance-as-code” actively incorporates governance into data team workflows. With DataGovOps automation, governance is no longer a forgotten afterthought that is deferred until other more important work is complete.
Data Governance Should Increase the Use of Data
In her book, “Disrupting Data Governance: A Call to Action,” data governance expert Laura Madsen envisions a more agile model for data governance by redirecting the focus of governance towards value creation through promoting the usage of data (figure 1). Instead of focusing on how to limit users, governance should be concerned with promoting the safe and controlled use of data at scale. Data governance is then more about active enablement than rule enforcement. In other words, can we design data quality, management and protection workflows in such a way that they empower, not limit, data usage? This can be done if we take a DataOps approach to governance.
Figure 1 shows how Madsen weights the four concerns of data governance. Increasing usage takes the largest single share, at 40%, and protection the smallest, at 10%.
| Data governance concern | Percentage of importance |
|---|---|
| Increase Usage of Data | 40% |
| Data Quality | 25% |
| Data Management (i.e. lineage) | 25% |
| Data Protection | 10% |
DataOps and Governance
In the past couple of years, there has been a tremendous proliferation of acronyms with the “Ops” suffix. This was started in the software space by DevOps — the merger of development (Dev) and IT operations (Ops). Since then, people have been creating new Ops terms at a pretty rapid pace. It’s important to remember that these methods have roots in foundational business management methodologies.
To understand the historical roots of Ops terms, we have to go back to manufacturing quality methods like Lean manufacturing and the writings of quality pioneer W. Edwards Deming. These methodologies were applied in industries across the globe and, more recently, introduced into the software domain under the guise of methods you may find familiar.
For example, Agile development is an application of the Theory of Constraints (TOC) to software development. The TOC observed that it was possible to lower manufacturing latency, reduce errors and raise overall system throughput in manufacturing assembly lines using small lot sizes. Agile brings these same benefits to software development by utilizing short development iterations.
DevOps is an application of Lean manufacturing to application development and operations. DevOps automation eliminates waste, reduces errors and minimizes the cycle time of application development and deployment. DevOps has been instrumental in helping software teams become more agile.
Data analytics differs from traditional software development in significant ways. DevOps by itself is insufficient to improve agility in data organizations because data analytics includes both a code and data factory. Whereas quality is generally code dependent in traditional software development, quality is both code and data dependent in data analytics. To design robust, repeatable data pipelines, analytics organizations must turn to automated orchestration, tests and statistical process control (hearkening back to W. Edwards Deming, figure 2).
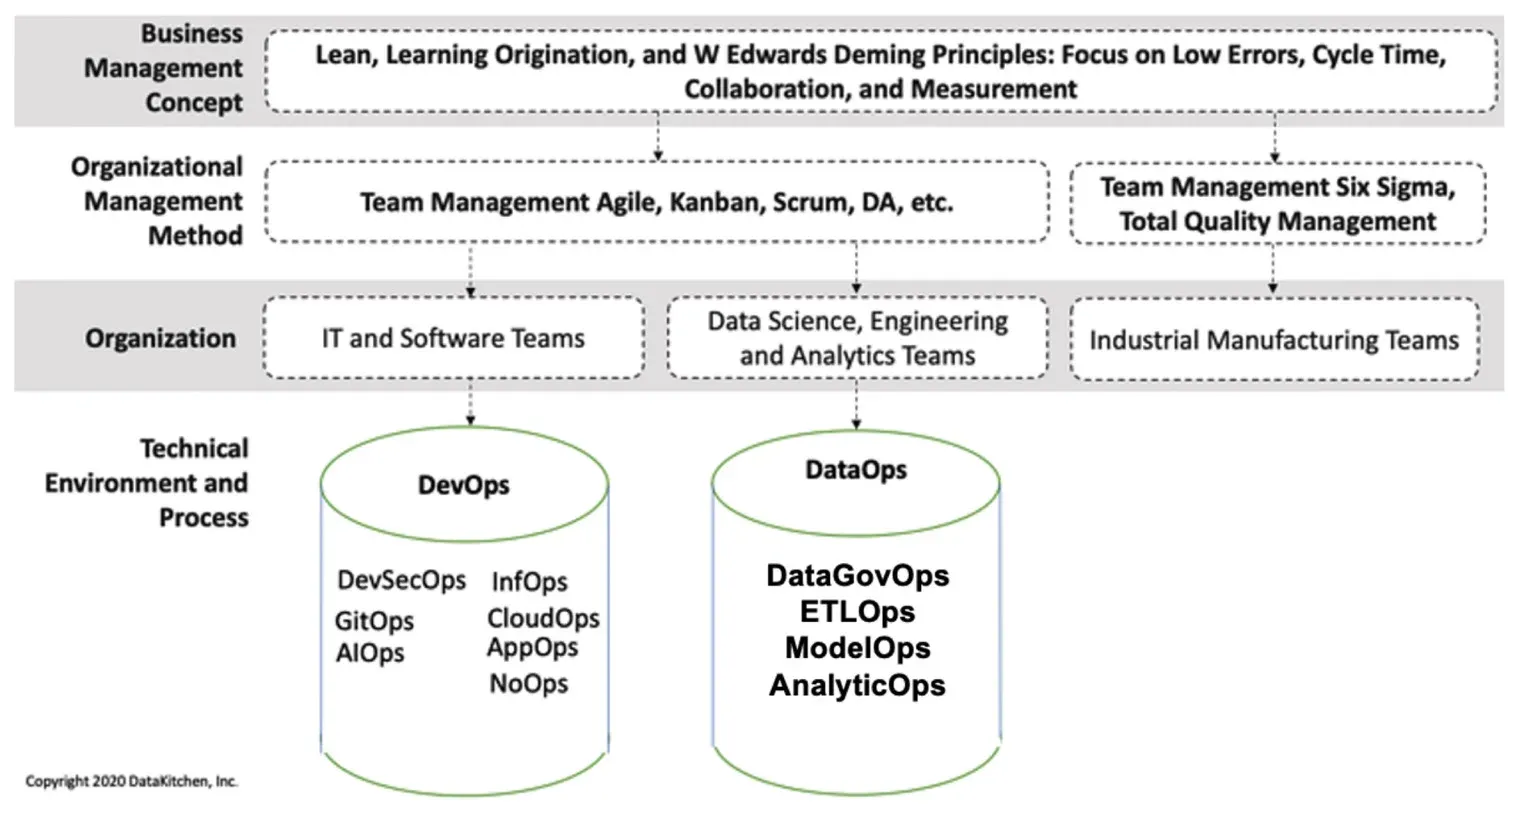
When these various methodologies are backed by a technical platform and applied to data analytics, it’s called DataOps. DataOps automation can enable a data organization to be more agile. It reduces cycle time and virtually eliminates data errors, which distract data professionals from their highest priority task: creating new analytics that add value for the enterprise.
DataGovOps
All of the new Ops terms (figure 2) are simply an effort to run organizations in a more iterative way. Enterprises seek to build automated systems to run those iterations more efficiently. In data governance, this comes down to finding the right balance between centralized control and decentralized freedom. When governance is enforced through manual processes, policies and enforcement interfere with freedom and creativity.
With DataOps automation, control and creativity can coexist. DataGovOps uniquely addresses the DataOps needs of data governance teams who strive to implement robust governance without creating innovation-killing bureaucracy. If you are a governance professional, DataGovOps will not put you out of a job. Instead, you’ll focus on managing change in governance policies and implementing the automated systems that enforce, measure, and report governance. In other words, governance-as-code.
The Role of DataGovOps in Data Governance
Data governance can keep people quite busy managing the various aspects of governance across the enterprise:
- Business glossary: Defines terms to maintain consistency throughout the organization. A glossary builds trust in analytics and avoids misunderstandings that impede decision-making.
- Data catalog: A metadata management tool that companies use to inventory and organize the data within their systems. Typical benefits include improvements to data discovery, governance, and access.
- Data lineage: Consider data’s journey from source to ETL tool to data science tool to business tool. Data lineage tells the story of data traversing the system in human terms.
- Data quality: Evaluated through a data quality assessment that determines if data is fit for use.
- Data security: Protecting digital data from the unwanted destructive actions of unauthorized users.
- Defined roles and responsibilities: Holding people accountable for adhering to governance and policies.
Governance is, first and foremost, concerned with policies and compliance. Some governance initiatives are somewhat akin to policing traffic by handing out speeding tickets. Focusing on violations positions governance in conflict with analytics development. Data governance advocates can get much farther with positive incentives and enablement rather than punishments.
DataGovOps looks to turn all of the inefficient, time-consuming and error-prone manual processes associated with governance into code or scripts. DataGovOps reimagines governance workflows as repeatable, verifiable automated orchestrations. Figure 3 shows how DataGovOps strengthens the pillars of governance: business glossary and data catalogs, data lineage, data quality, data security, and governance roles and responsibilities.
| Data governance focus | DataGovOps focus |
|---|---|
| Business Glossary & Data Catalog | Business Glossary & Data Catalog as Code |
| Data Lineage | Process Lineage |
| Data Quality Definitions | Automated Data Testing |
| Data Security | Self-Service Sandbox and Test Data Management |
| Defined Roles and Responsibilities | Agility in Defined Roles and Responsibilities |
Automate Change Through Governance as Code
Figure 4 represents a deployment of new analytics from a development environment to a production environment. Imagine you have an existing system that does some ETL, visualization, and data science work. Let’s say you want to add a new data table, join it to another fact table, and update a model and report. The table is new data, and it should also be added to the data catalog. DataGovOps views governance as code or configuration. The orchestration that deploys the new data, new schema, model changes, and updated visualizations also deploys updates to the data catalog. The orchestrations that implement continuous deployment include DataGovOps governance updates into the change management process. All changes are deployed together. Nothing is forgotten or heaped upon an already-busy data analyst as extra work. DataGovOps deploys the changes in the catalog as a unit with the ETL code, models, visualizations, and reports.
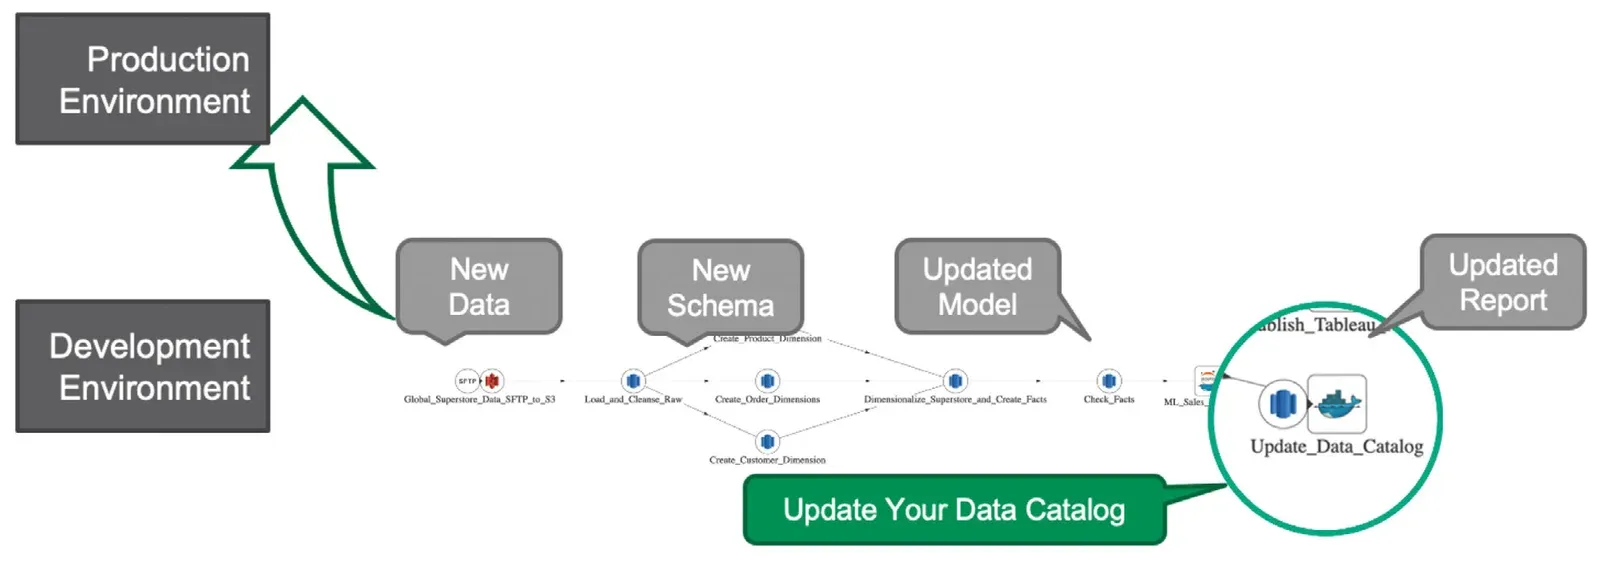
Automating governance ensures that it happens in a timely fashion. With manual governance processes, there is always a danger that high-priority tasks will force the data team to defer catalog updates — and occasionally drop the ball. If data catalogs are a deployable unit, updates are more likely to get done, and everyone directly participates in governance via DataGovOps orchestrations.
DataGovOps Focuses on Process Lineage, Not Just Data Lineage
Data analytics is a profession where your errors get plastered on billboards. When a chart is missing or a report looks wrong, you may find out about it when the VP calls asking questions. Data lineage helps you get those answers.
Figure 5 depicts a data pipeline that ingests data from sftp, builds facts and dimensions, forecasts sales, visualizes data and updates a data catalog. Many data organizations use a mix of tools across numerous locations and data centers. They may use hybrid cloud with some centralized data teams and decentralized development using self-service tools. Data lineage helps the data team keep track of this end-to-end process. Which team owns which steps in the process? Which tools are used? Who made changes and when?
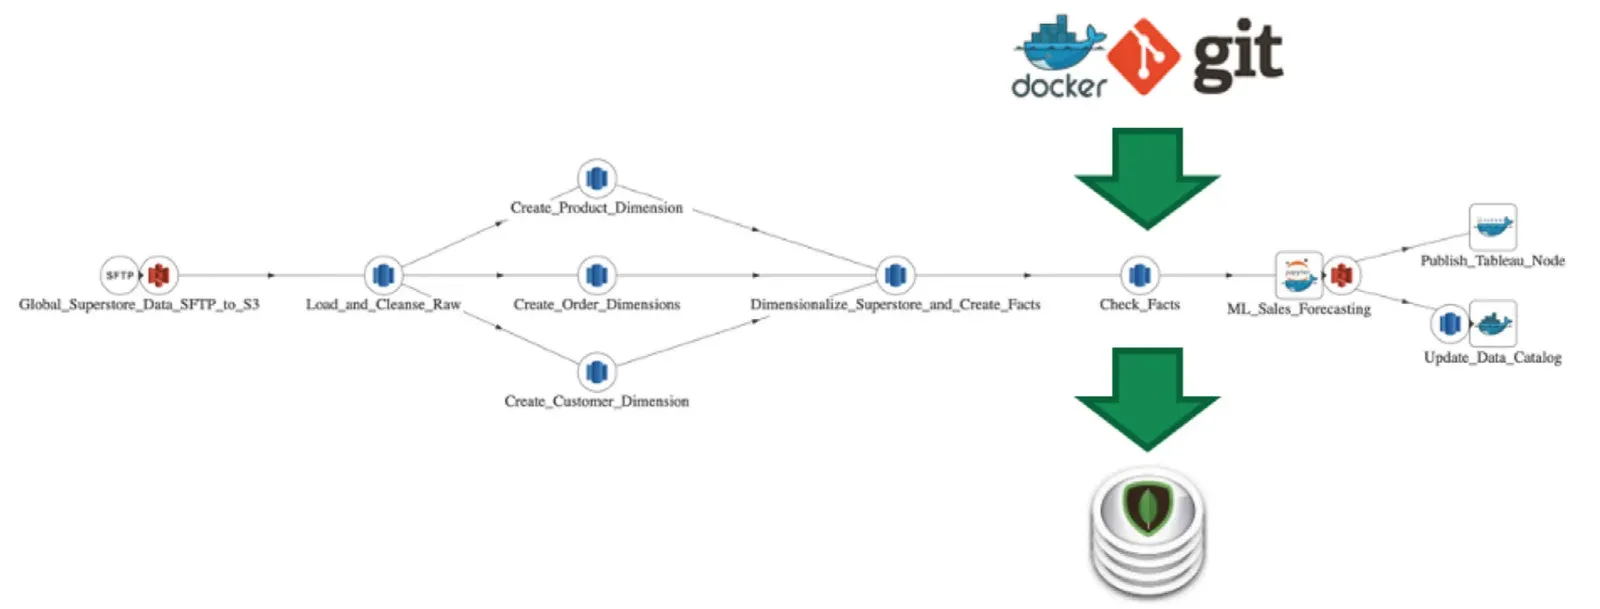
DataGovOps records and organizes all of the metadata related to data — including the code that acts on the data. Test results, timing data, data quality assessments and all other artifacts generated by execution of the data pipeline document the lineage of data. All metadata is stored in version control so that you have as complete a picture of your data journey as possible. DataGovOps documents the exact process lineage of every tool and step that happened along the data’s journey to value.
DataGovOps Automates Testing and Data Quality
Manual governance programs evaluate whether data is fit for purpose by performing a data quality assessment. A labor-intensive assessment can only be performed periodically, so at best, it provides a snapshot of data quality at a particular time. DataGovOps takes a more dynamic and comprehensive view of quality. DataGovOps performs continuous testing on data at each stage of the analytics pipeline. Real-time error alerts pinpoint exactly where a problem was detected. Quality assessment is performed as an automated orchestration, so you always have an updated status of data quality. Additionally, DataGovOps performs statistical process control, location balance, historical balance, business logic and other tests, so your data lineage is packed with artifacts that document the data lifecycle (figure 6).
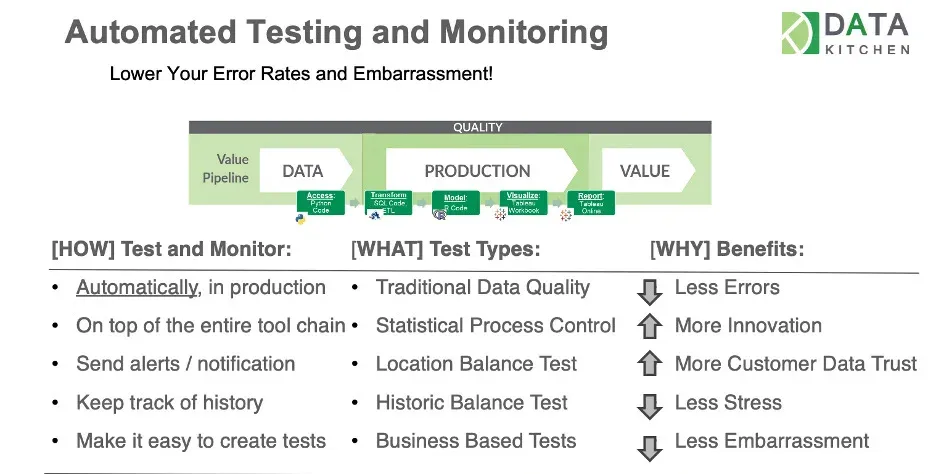
If your users see an error in charts, graphs or models, they won’t care whether the error originated with data or the transformations that operate on that data. DataGovOps tests the code that operates on data so that ETL operations and models are validated during deployment and monitored in production.
All of this testing reduces errors to virtually zero, eliminating the stress and embarrassment of having to explain mistakes. When analytics are correct, data is trusted, and the data team has more time for the fun and innovative work that they love doing.
DataGovOps Enables Self-Service Analytics
A lot of organizations have begun to rely heavily on self-service analytics. From the CDO’s perspective, self-service analytics spur innovation, but can be difficult to manage. Data flowing into uncontrolled workspaces complicates security and governance. Without visibility into decentralized development, the organization loses track of its data sources and data catalog, and can’t standardize metrics. The lack of cohesion makes collaboration more difficult, adds latency to workflows, creates infrastructure silos, and complicates analytics management and deployment. It’s hard to keep the trains running on time amid the creative chaos of self-service analytics.
Self-Service Sandboxes
DataGovOps relies upon self-service sandboxes to improve development and governance agility simultaneously. If manual governance is like handing out speeding tickets, then self-service sandboxes are like purpose-built race tracks. The track enforces where you can go and what you can do, and are built specifically to enable you to go really fast.
A self-service sandbox is an environment that includes everything a data analyst or data scientist needs in order to create analytics. For example:
- Complete toolchain
- Standardized, reusable, analytics components
- Security vault providing access to tools
- Prepackaged datasets: clean, accurate, privacy and security aware
- Role-based access control for a project team
- Integration with workflow management
- Orchestrated path to production: continuous deployment
- DataKitchen Kitchen: a workspace that integrates tools, services and workflows
- Governance: tracking user activity with respect to policies
Self-service environments are created on-demand with built-in background processes that monitor governance. If a user violates policies by adding a table to a database or exporting sensitive data from the sandbox environment, an automated alert can be forwarded to the appropriate data governance team member. The code and logs associated with development are stored in source control, providing a thorough audit trail.
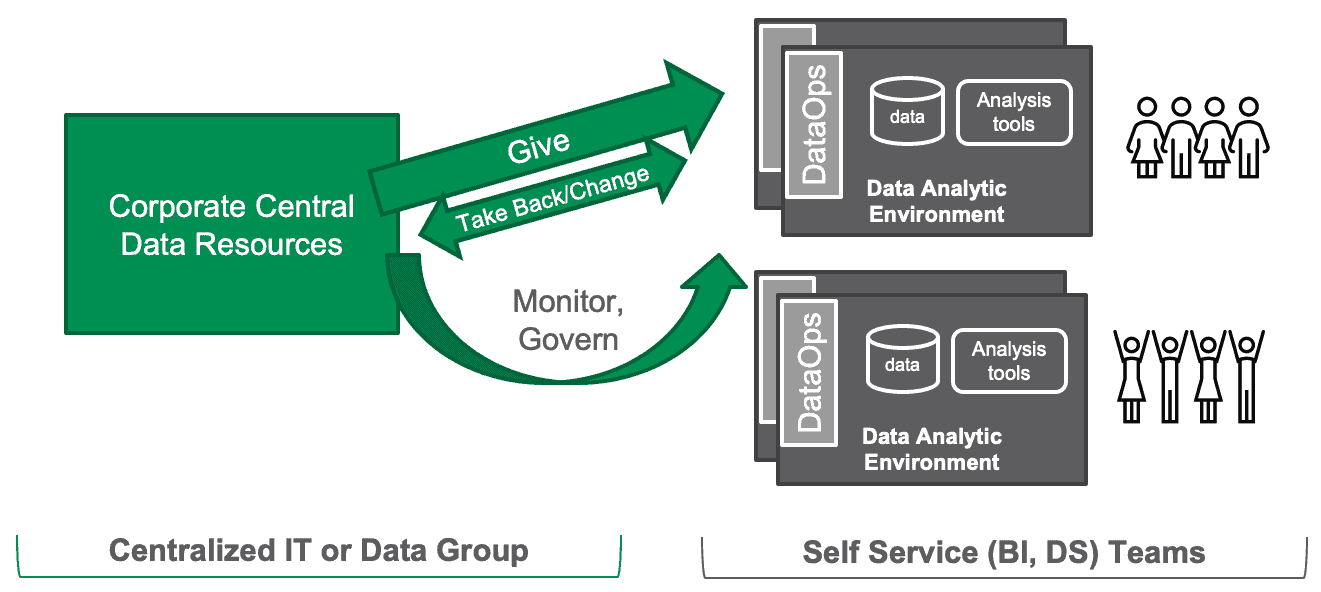
Note that the self-service sandbox includes test data. Access to test data is a significant pain point for many enterprises. It sometimes takes several months to obtain clean, accurate, and privacy-aware test data that has passed security checks. Once set-up, a self-service environment provides test data on demand. The self-service sandbox enables data teams to deploy faster and lower their error rate. This capability empowers them to iterate more quickly and find solutions to business challenges. The provision of test data on demand is called Test Data Management.
Test Data Management
In data science and analytics, test data management (TDM) is the process of managing the data necessary for fulfilling the needs of automated tests, with zero human intervention (or as little as possible).
That means that the TDM solution is responsible for creating the required test data, according to the requirements of the tests. It should also ensure that the data is of the highest possible quality. Poor quality test data is worse than having no data at all since it will generate results that can’t be trusted. Another important requirement for test data is fidelity. Test data should resemble, as closely as possible, the real data found in the production servers.
Finally, the TDM process must also guarantee the security and privacy of test data. It’s no use to have high-quality data that is as realistic as possible but lack secure, privacy-aware data for testing.
DataGovOps Is Mission Control for Your Data
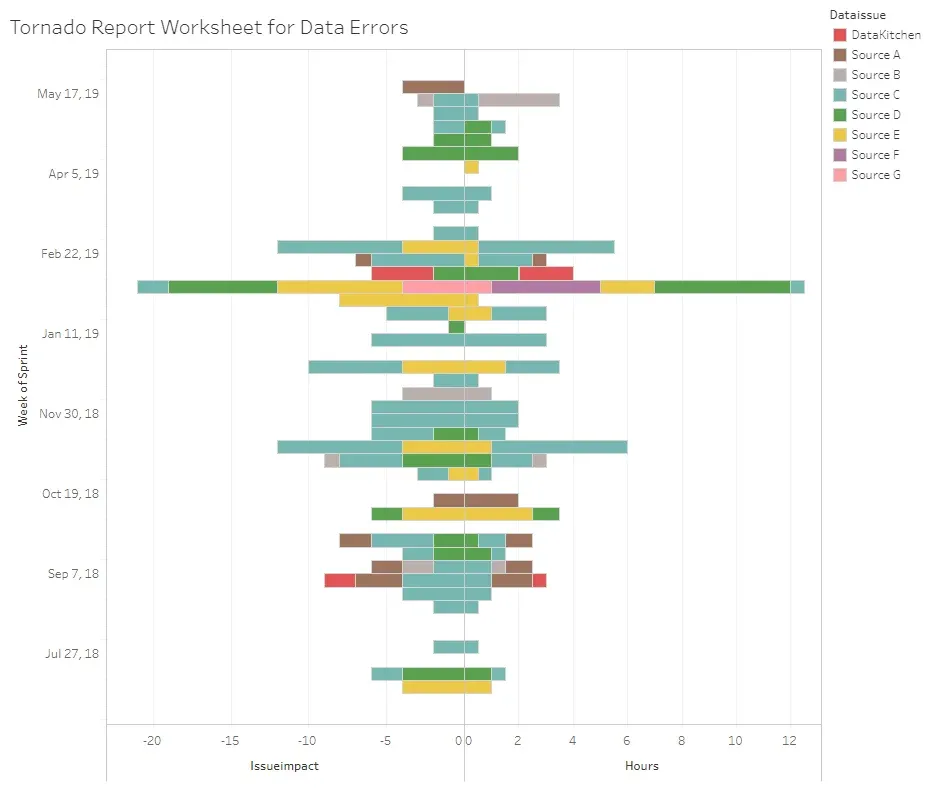
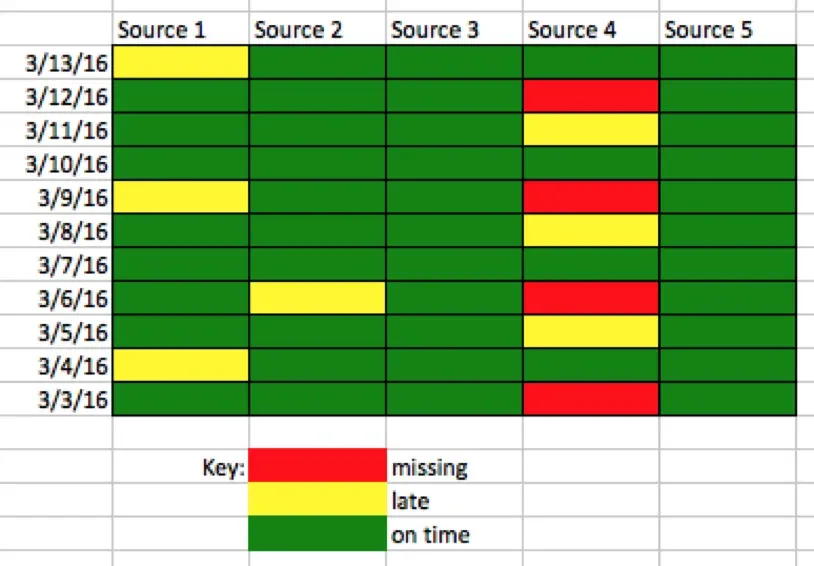
In space flight, a “mission control” center manages a flight from launch until landing, providing stakeholders with complete situational awareness. To properly govern data, you similarly need to know what’s happening at a glance — with an ability to quickly drill down into the details. DataGovOps serves as mission control for your data and data pipelines. It provides a single-pane-of-glass view of data and operations, enabling the data team to quickly locate and diagnose problems (figures 7, 8, and 9).
The daily build summary in figure 7 is the first of those views. Every scheduled analytic, its last run status, its schedule, and its next build appear in one table — including the one that failed.
| Type | Variations/Recipes | Build status | Last status | Schedule | Next build |
|---|---|---|---|---|---|
| Analytic | scrape-data | COMPLETE - ON-TIME | Orchestration COMPLETED | AT 08:00 AM | Tomorrow 08:00 AM |
| Analytic | pov | COMPLETE - ON-TIME | Orchestration COMPLETED | AT 09:15 AM MONDAY through FRIDAY | Tomorrow 09:15 AM |
| Analytic | gc_dataprep | COMPLETE - ON-TIME | Orchestration COMPLETED | AT 11:00 AM on MONDAY | Monday 11:00 AM |
| Analytic | generate_labels | COMPLETE - ON-TIME | Orchestration COMPLETED | AT 01:00 PM DAILY | Tomorrow 01:00 PM |
| Analytic | graph_amazon_data | UPCOMING | Error in Orchestration | AT 12:00 PM every TUESDAY | Tuesday 12:00 PM |
Conclusion
The concept of governance as a policing function that restricts development activity is out-moded and places governance at odds with freedom and innovation. DataGovOps provides a better approach that actively promotes the safe use of data with automation that improves governance while freeing data analysts and scientists from manual tasks. DataGovOps is a prime example of how DataOps can optimize the execution of workflows without burdening the team. DataGovOps transforms governance into a robust, repeatable process that executes alongside development and data operations.
Install Open Source DataOps TestGen — free, runs on a laptop, and profiles your first table in under an hour. Automated data testing is the pillar of DataGovOps you can stand up this afternoon.
Related Reading
- Continuous Governance with DataGovOps — the blog edition of this paper
- Redefining Data Governance with DataGovOps — the conversation with Laura Madsen behind figure 1
- Can DataGovOps Make Governance Dreams Come True? — what changes on a governance team that adopts this
- Govern Self-Service Analytics Without Stifling Innovation — the sandbox argument in more detail
- DataGovOps — the product view of governance automation
- A Guide to DataOps Tests — the test types named in figure 6, one by one
- A New, More Effective Approach to Data Quality Assessments — what replaces the periodic manual assessment
- DataOps Is Not Just DevOps for Data — why the code-and-data factory needs its own methods
- The “Right to Repair” Data Architecture with DataOps — the architecture that makes governance-as-code deployable
- Reducing Organizational Complexity with DataOps — the centralization-versus-freedom problem in full
FAQ
What is the main point of this paper?
Manual data governance — meetings, checklists, sign-offs and nagging — is a tax on data analyst productivity, so it gets deferred and forgotten. DataGovOps builds governance into development and operations using DataOps tools and methods, so catalog updates, lineage capture, quality tests and access controls execute as automated orchestrations every time a change ships. Governance as code makes governance happen without burdening the team.
What is DataGovOps?
DataGovOps is governance automation, and it is part of the DataOps movement. With DataOps automation, governance executes continuously as part of development, deployment, operations and monitoring workflows rather than as a separate manual program. DataGovOps addresses the needs of data governance teams who want robust governance without creating innovation-killing bureaucracy, so control and creativity can coexist.
What does governance as code mean?
Governance as code means the artifacts of governance — catalog entries, glossary terms, lineage, tests, access policies — live as code or configuration and deploy alongside the ETL code, models, visualizations and reports they describe. Manual, time-consuming and error-prone governance steps become repeatable, verifiable automated orchestrations that run every time analytics change.
How is DataGovOps different from traditional data governance?
Traditional governance focuses on policies, compliance and violations, somewhat like policing traffic by handing out speeding tickets. DataGovOps focuses on enablement: business glossary and data catalog as code, process lineage, automated data testing, self-service sandboxes with test data management, and agility in defined roles and responsibilities. The pillars are the same; the enforcement mechanism is automation, not nagging.
Does DataGovOps replace data governance professionals?
No. If you are a governance professional, DataGovOps will not put you out of a job. The work shifts from chasing compliance by hand to managing change in governance policies and implementing the automated systems that enforce, measure and report governance. That is what governance as code means in practice for the person doing the governing.
What is process lineage, and how is it different from data lineage?
Data lineage tells the story of data traversing the system from source to ETL tool to data science tool to business tool. Process lineage adds the code that acts on the data: test results, timing data, quality assessments and every other artifact generated by a pipeline run, all stored in version control, documenting every tool and step along the data’s journey to value.
How does DataGovOps handle data quality differently from a data quality assessment?
A labor-intensive assessment can only be performed periodically, so at best it gives a snapshot of quality at one point in time. DataGovOps performs continuous testing at each stage of the analytics pipeline, with real-time alerts pinpointing where a problem was detected, plus statistical process control, location balance, historical balance and business logic tests.
What is a self-service sandbox?
A self-service sandbox is an environment containing everything a data analyst or data scientist needs to create analytics: a complete toolchain, reusable analytics components, a security vault, prepackaged privacy-aware datasets, role-based access control, workflow integration and an orchestrated path to production. Background processes monitor governance and alert the governance team when a policy is violated.
What is test data management?
Test data management is the process of managing the data needed by automated tests with as little human intervention as possible. The solution creates the required test data according to the tests’ requirements, ensures the data is high quality and high fidelity to production data, and guarantees the security and privacy of that data. Poor test data is worse than none.
Why does data governance need automation at all?
Because the problems governance addresses recur constantly: no single definition of a metric across a sales force, data assets scattered across groups and locations, regulated data exported to laptops, unclear ownership of pipeline steps spanning teams and data centers, and data that is incomplete and full of errors. Meetings and checklists cannot keep pace with daily analytics change.
What did Laura Madsen say data governance should prioritize?
In her book Disrupting Data Governance: A Call to Action, Laura Madsen weights governance toward value creation: increasing usage of data 40%, data quality 25%, data management such as lineage 25%, data protection 10%. Rather than limiting users, governance should promote the safe and controlled use of data at scale — active enablement over rule enforcement.
What does mission control for your data mean?
In space flight, a mission control center manages a flight from launch to landing and gives stakeholders complete situational awareness. DataGovOps does the same for data pipelines: a single-pane-of-glass view of data and operations, with reports such as a daily build summary, a tornado report of issue impact and resolution time, and a data arrival report tracking suppliers.
Get the PDF
The full paper is on this page. Fill in the form for a PDF copy to keep or share.