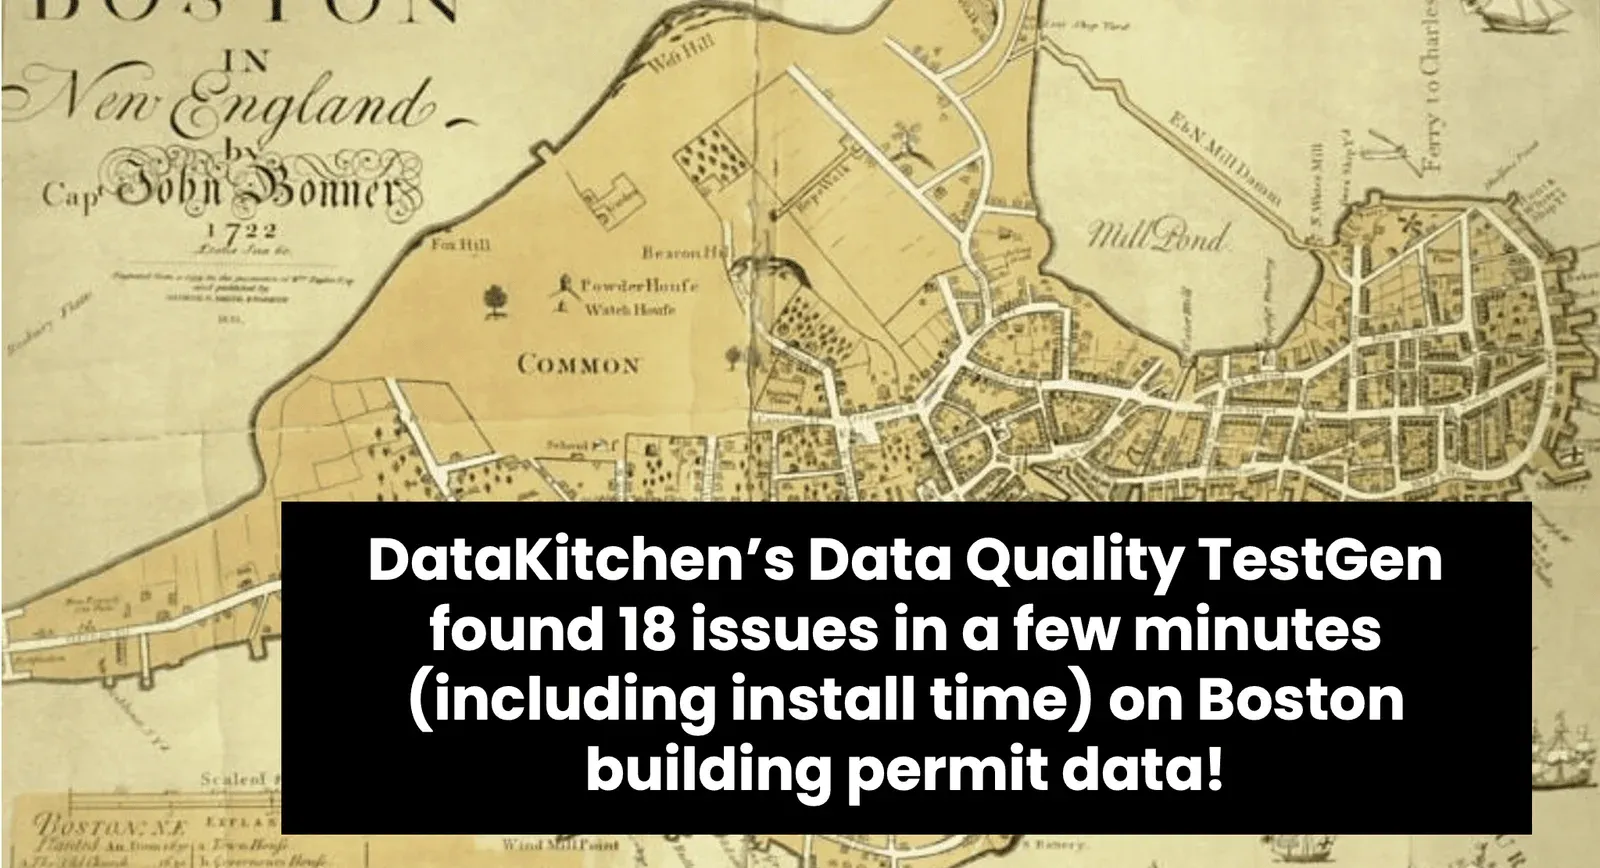
Imagine a free tool that you can point at any dataset and find actionable data quality issues immediately! It sure beats having your data consumers tell you about problems they find when you are trying to enjoy your weekend. There is such a tool: DataKitchen’s Data Quality TestGen. I took TestGen for a test drive on ~600k rows of Boston City data and found 18 data quality hygiene issues in a few minutes.
First, I grabbed building permit data from Approved Building Permits from data.boston.gov and used Superset to load it into a Postgres DB. Second, I installed TestGen, which took just a few minutes. Then, I started profiling, which completed in 3 minutes and 16 seconds on 646,899 records containing 23 columns (14,878,677 data points). TestGen finds potential data quality issues during the profiling process! Here is a summary of the data hygiene issues that TestGen found:

The run: 646,899 records, 23 columns, 14,878,677 data points. Profiling finished in 3 minutes 16 seconds and returned 18 hygiene issues: 1 definite, 9 likely, 8 possible, 0 dismissed.
Five of those 18 are detailed below. Each row is what TestGen reported, verbatim:
| Column | Anomaly | Likelihood | Detail |
|---|---|---|---|
| comments | Non-Standard Blank Values | Definite | Filled values: 5, empty string: 0, null: 216, of 646,899 records |
| city | Similar Values Match When Standardized | Likely | Distinct values: 132, standardized: 98 |
| city | Small Percentage of Missing Values Found | Possible | 185 of 646,899 blank: 0.03% |
| applicant | Similar Values Match When Standardized | Likely | Distinct values: 55,251, standardized: 45,329 |
| applicant | Small Percentage of Missing Values Found | Possible | 9,365 of 646,899 blank: 1.47% |
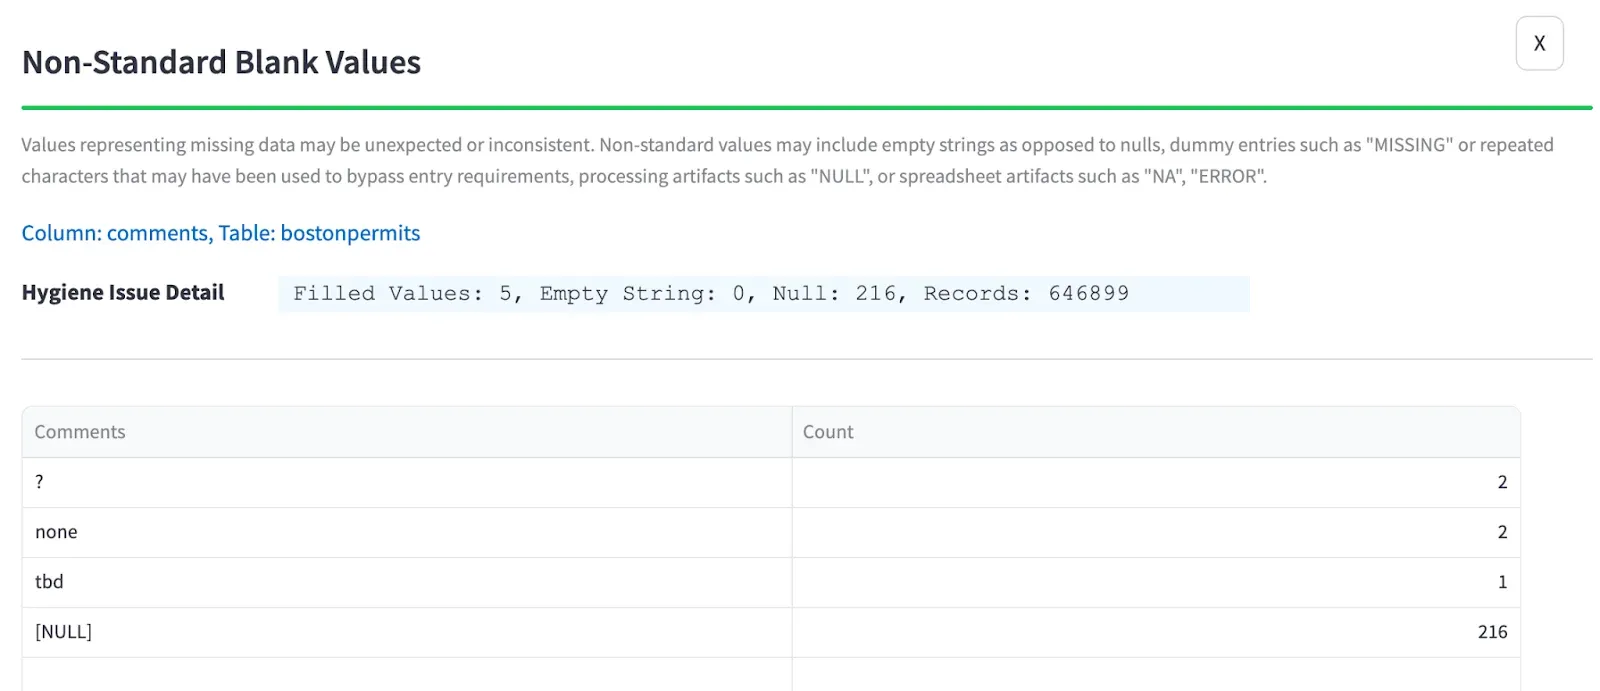
The comments column had four different ways of saying nothing: [NULL] 216 times, ? twice, none twice, and tbd once.
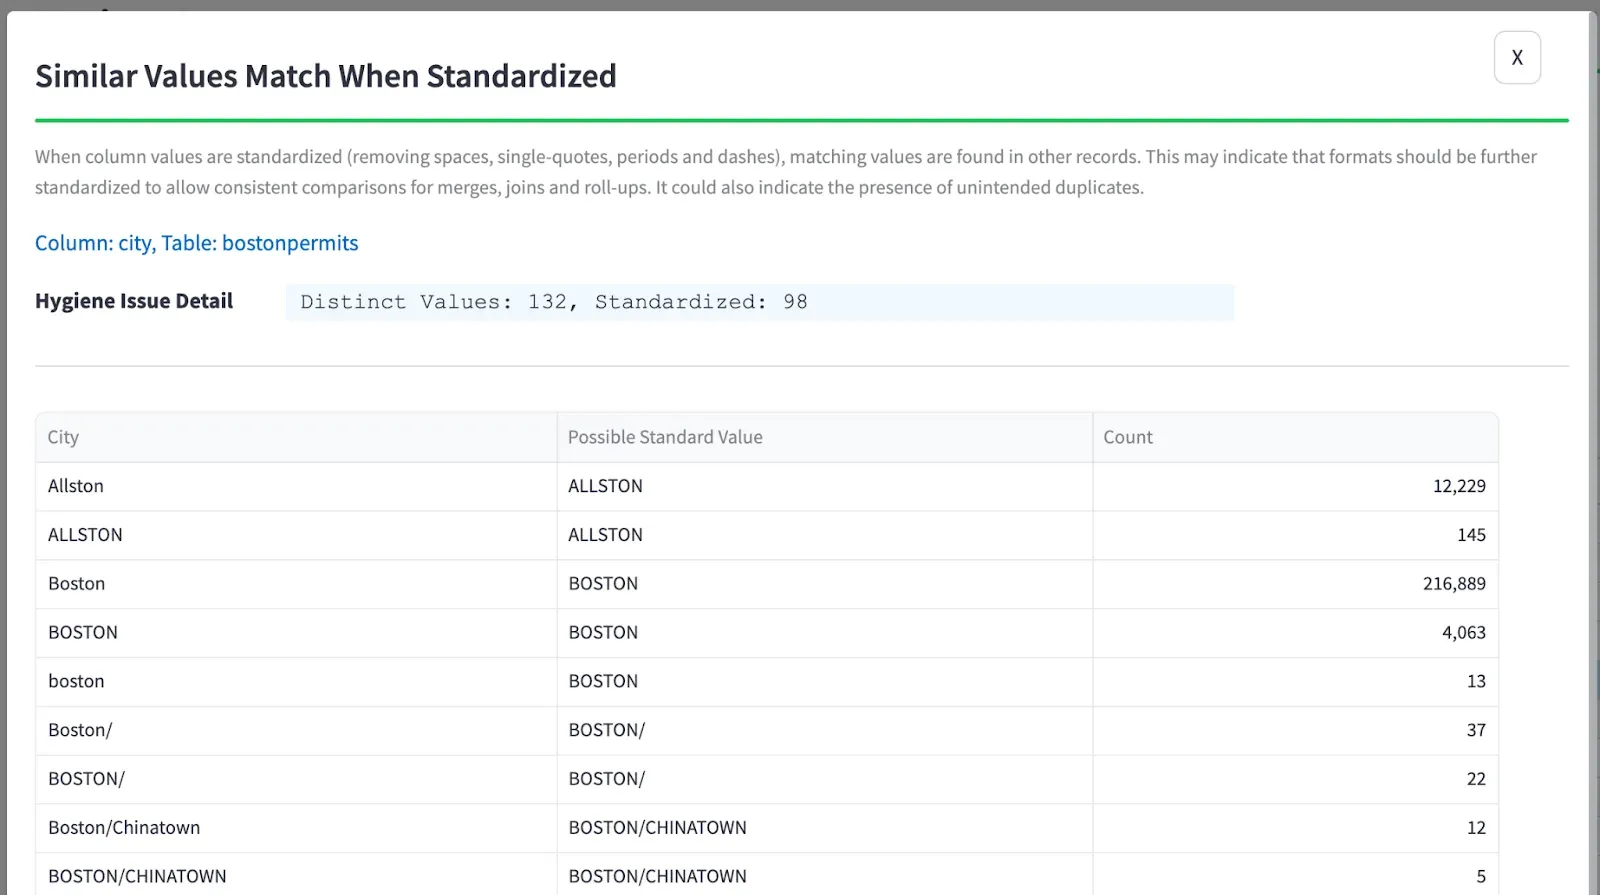
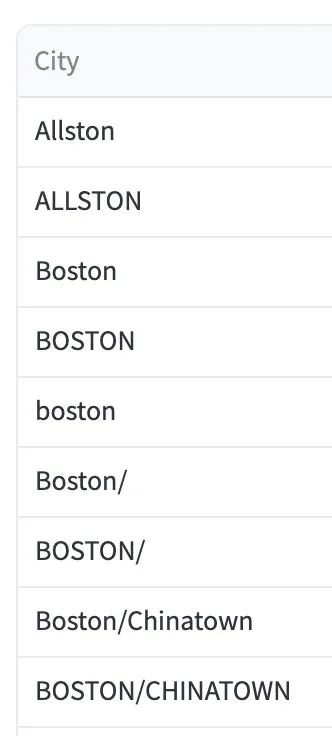
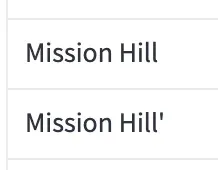
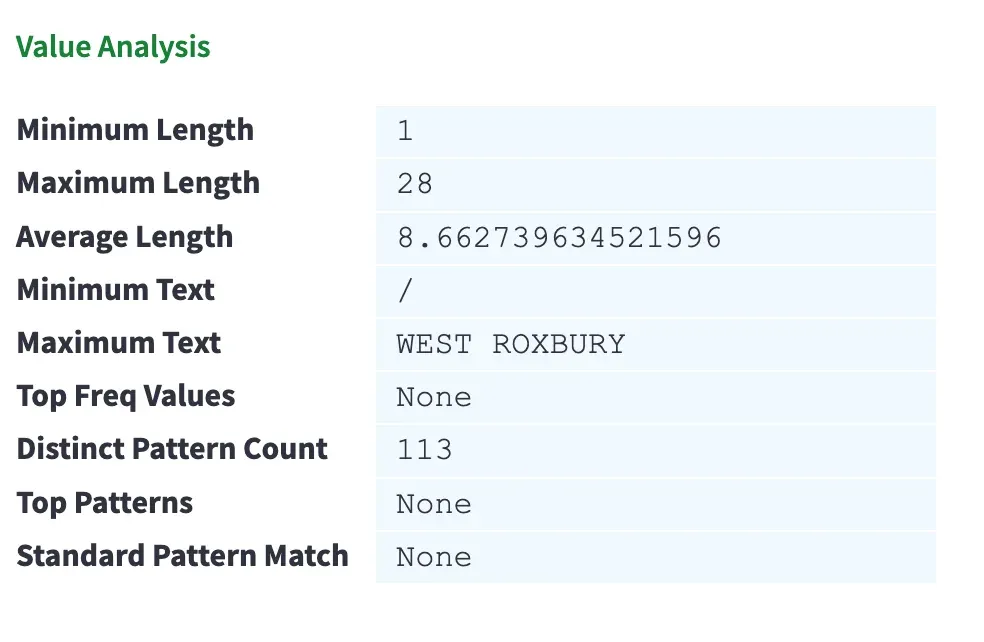
The city column is worse than the 0.03% null rate suggests. Standardizing collapses 132 distinct values to 98, because the same city is spelled several ways: Boston 216,889 times, BOSTON 4,063, boston 13. Allston 12,229 against ALLSTON 145. Mission Hill 8,424 against Mission Hill' 3, the difference being one stray apostrophe. Eight records list the city as /. Value analysis puts the shortest city at 1 character (/), the longest at 28, and counts 113 distinct patterns.
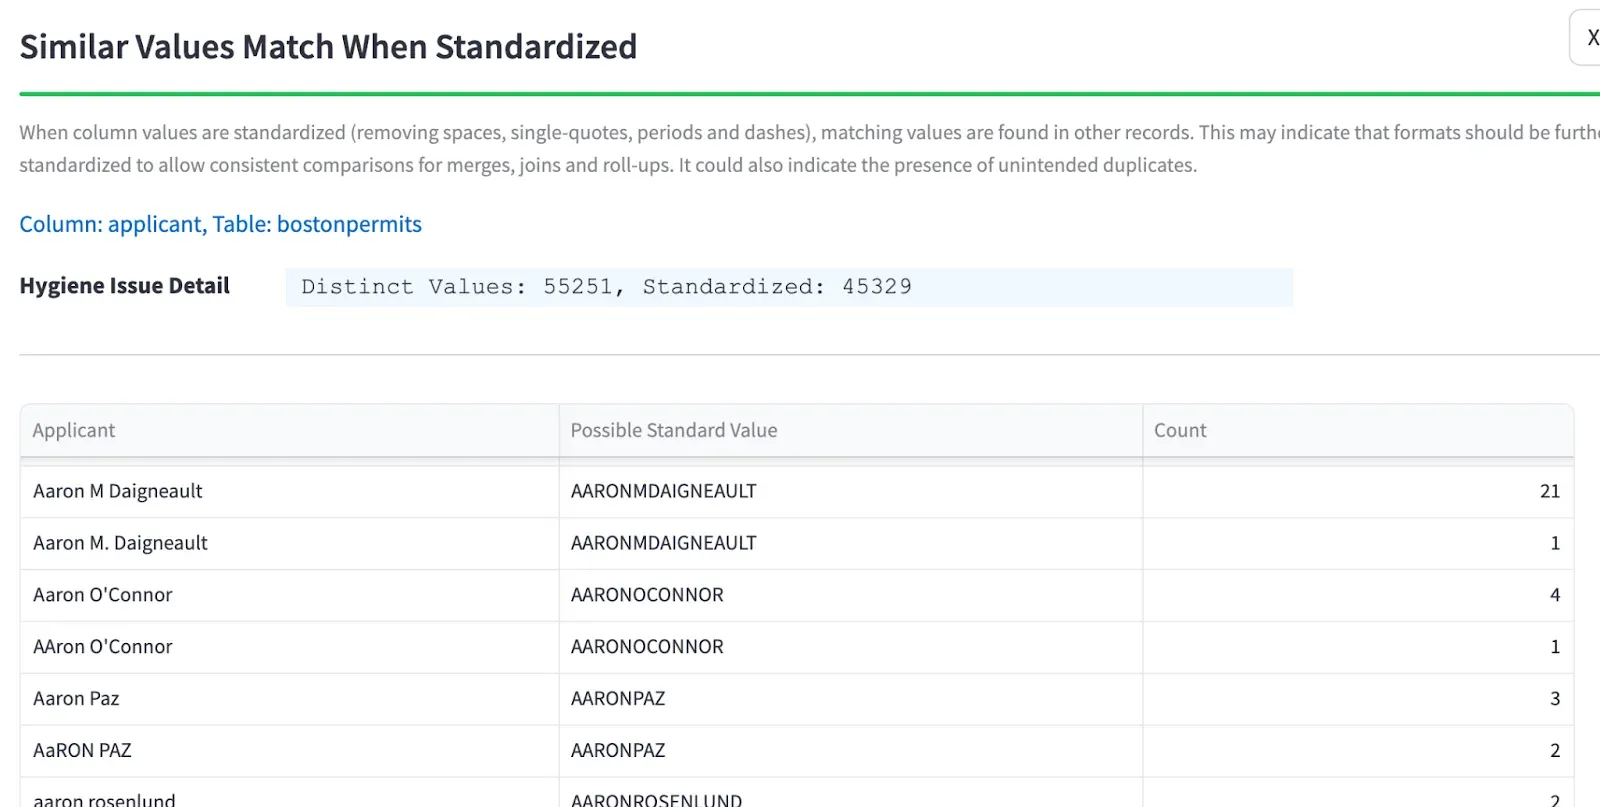
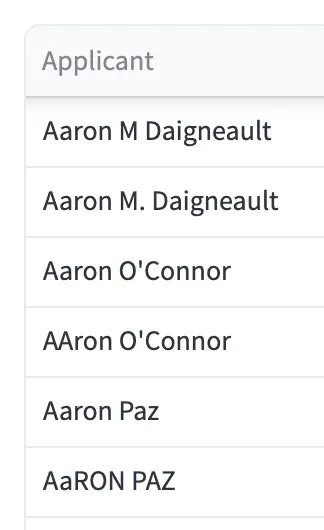
The applicant column shows the same shape at larger scale: 55,251 distinct values collapse to 45,329 when standardized. Aaron M Daigneault and Aaron M. Daigneault are the same person, as are Aaron O'Connor and AAron O'Connor, and Aaron Paz and AaRON PAZ.
TIP
Try TestGen on your data to have your data suppliers improve their data and alert your users to potential issues. Here are TestGen’s install instructions.
The one “Definite” finding was non-standard blank values in the comment column. It turns out that in this data set, there were four ways to indicate no comment for the permit: [NULL], ”?”, “none”, and “tbd”. You can see the frequencies from this screenshot:
What else did TestGen find? It seems like the city should be known for a permit, so I took at the findings on the city column:

Good news: Only 0.03% of the records had no city. Bad news: 185 permits were missing the city. This could be an issue for a quality circle or a data steward to fix.
Looking further at the city column and pressing the “Source Data” button for the “Similar Values Match When Standardized” Hygiene Issue, I see that some names have an initial capital and others are all uppercase. Are two systems feeding this dataset? There are a few slashes that worked their way into the data, too:
Zooming in on some values:
A little more scrolling shows that a stray quote worked its way in there three times.

Zooming in on the values:
Switching to the profiling results on the city column and looking at the “Value Analysis” section, I observed that while the Maximum Text looked good, “WEST ROXBURY”, I did not recognize the city with the Minimum Text, ”/”.
A quick query revealed that there were 8 records with a city of ”/”
select * from bostonpermits where length(city) < 5;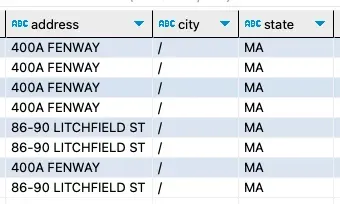
The applicant field had similar issues:

Shouldn’t every permit have an applicant? 1.47% blank is low, but that is still 9,365 permits with no applicant. Also, if one wanted to analyze applicants, the field would benefit from some standardization.
Zooming in on the values:
Twelve other data hygiene issues were flagged and are not discussed in this article. You can try this experiment on your computer and see what you think. Better yet, try it on your own data.
My next steps were to generate data quality tests (this took about 2 seconds). These tests can be run in production to quickly catch errors on new batches of Boston permit data. To benchmark the testing operation, I ran the tests on the existing dataset, which took 23 seconds.
Here was my setup:
- Data Quality Tool: DataKitchen DataOps TestGen v2.7.0 open-source edition
- Superset running in docker
- Postres SQL running in docker
- SQL Editor: DBeaver
- Hardware: MacBook Pro, Processor 2.2 GHz 6-Core Intel Core i7, Memory 16 GB
Software cost: $0
TIP
I invite you to try TestGen on your data to have your data suppliers improve their data and alert your users to potential issues. Here are TestGen’s install instructions.
FAQ
What are the key points in this blog?
Profiling a public dataset of 646,899 approved building permit records from data.boston.gov took 3 minutes and 16 seconds with open-source DataOps TestGen and returned 18 potential data hygiene issues: 1 definite, 9 likely, 8 possible, 0 dismissed. The definite finding was non-standard blank values in the comments column. The city and applicant columns both held values that collapse when standardized. Software cost was zero.
How long does it take TestGen to find data quality issues?
Profiling finished in 3 minutes and 16 seconds across 646,899 records, 23 columns and 14,878,677 data points, and the 18 potential hygiene issues came out of that profiling run rather than from hand-written tests. Installing TestGen beforehand took a few minutes. Generating data quality tests from the profile took about 2 seconds, and running those tests took 23 seconds.
What was the one definite data quality issue in the Boston building permit data?
Non-standard blank values in the comments column. That column used four different ways to indicate no comment: a null marker 216 times, a question mark twice, none twice, and tbd once. TestGen rates each hygiene issue by likelihood, and this was the only one of the 18 rated definite, alongside 9 rated likely and 8 rated possible.
What does the Similar Values Match When Standardized finding mean?
It flags a column where distinct values collapse once case, spacing and punctuation are normalized, which usually means one real-world value is stored several ways. In this dataset the city column held 132 distinct values that standardize to 98, and the applicant column 55,251 that standardize to 45,329, where the same applicant name appears with and without a middle initial period.
How many permits were missing a city or an applicant?
185 of 646,899 permits had no city, a blank rate of 0.03%, and 9,365 had no applicant, a blank rate of 1.47%. A separate query found 8 records where the city field held a single slash character. Twelve further hygiene issues were flagged in the same profiling run. Fixes like these are work for a quality circle or a data steward.
What did this experiment cost and what was the setup?
Software cost was zero. The run used DataOps TestGen v2.7.0 open-source edition with Superset and Postgres in Docker, DBeaver as the SQL editor, on a MacBook Pro with a 2.2 GHz 6-core Intel Core i7 and 16 GB of memory. A later run on 2,964,624 New York City taxi trip records followed the same approach.