One table, two verdicts
Picture a prescription table. TRx and NRx counts by prescriber and territory, loaded every morning. This is an invented example, but if you work in pharma you’ve lived some version of it.
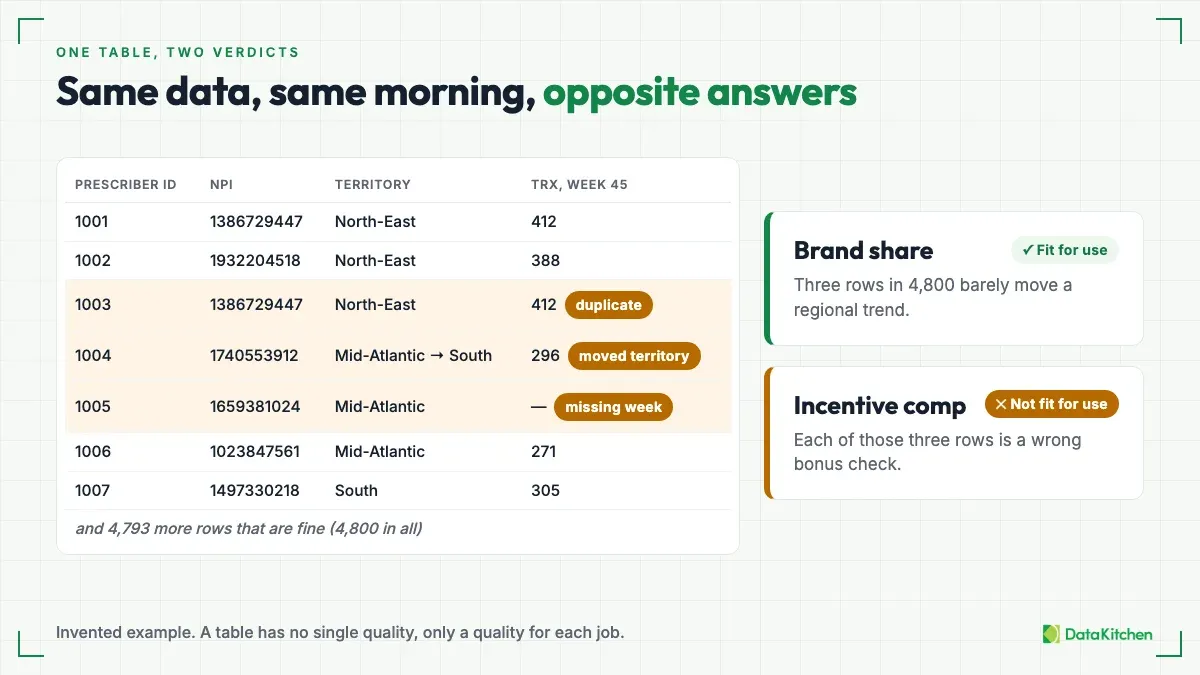
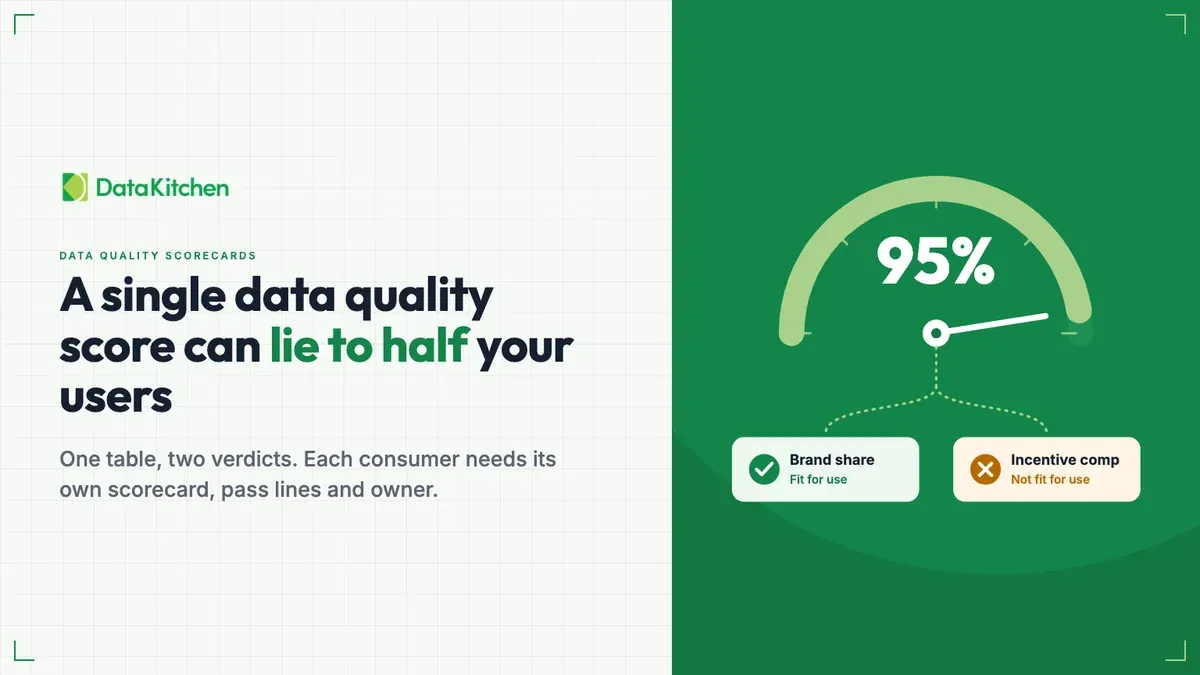
The brand team uses the table for market share. They roll prescribers up by region and watch the trend. A few prescribers that didn’t match to a territory barely move the line. A load that lands a day late doesn’t change the story. For that team, the table is fine.
Incentive comp reads the same rows. It pays reps from them.
One prescriber in the wrong territory moves credit from one rep to another. A prescriber who shows up twice pays double. A missing week means somebody’s bonus check comes up short. For that team, the same table on the same morning is wrong.
So is the table good or bad? That’s the wrong question. A table has no single quality. It has a quality for each job someone gives it.
Why one score hides it
Wang and Strong named this in 1996. Their paper “Beyond Accuracy: What Data Quality Means to Data Consumers” defines quality as fitness for use. Data is good when the person using it can do their job with it. Fitness belongs to the consumer, not to the table.
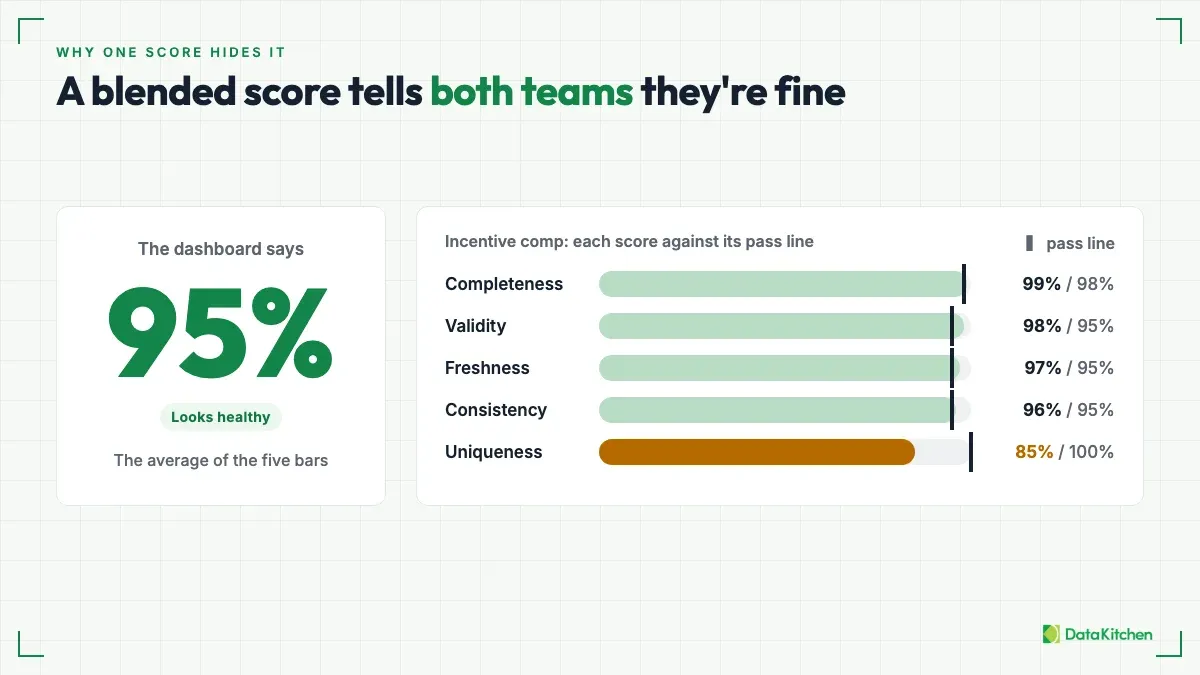
Now put a blended score on the pharma table. Say it comes out at 95%, the average of the five dimension scores. The brand team sees a healthy number and carries on, correctly. The incentive comp team sees the same healthy number and carries on, incorrectly. The uniqueness score is the one dragged down by the duplicated prescriber, and that duplicate is the one defect that decides their use case.
Averaging fails in three ways. It treats dimensions as interchangeable, so a perfect completeness score cancels a bad uniqueness score. It mixes units: freshness is measured in hours and the other dimensions in percentages, so the average means nothing. And it buries the single breach that decides whether the data can be used at all.
Vertex Frontier’s guide to data quality dimensions makes the same point with a 20-row customer table that passes for marketing and fails for billing. It argues for reporting the worst dimension and the breach count instead of an average. That’s the right instinct. The next step is to report them per consumer.
Thresholds belong to consumers, not tables
Give each consumer its own scorecard. A scorecard has three parts: the columns that consumer depends on, a pass line for each column, and a named owner who can accept or change those lines.
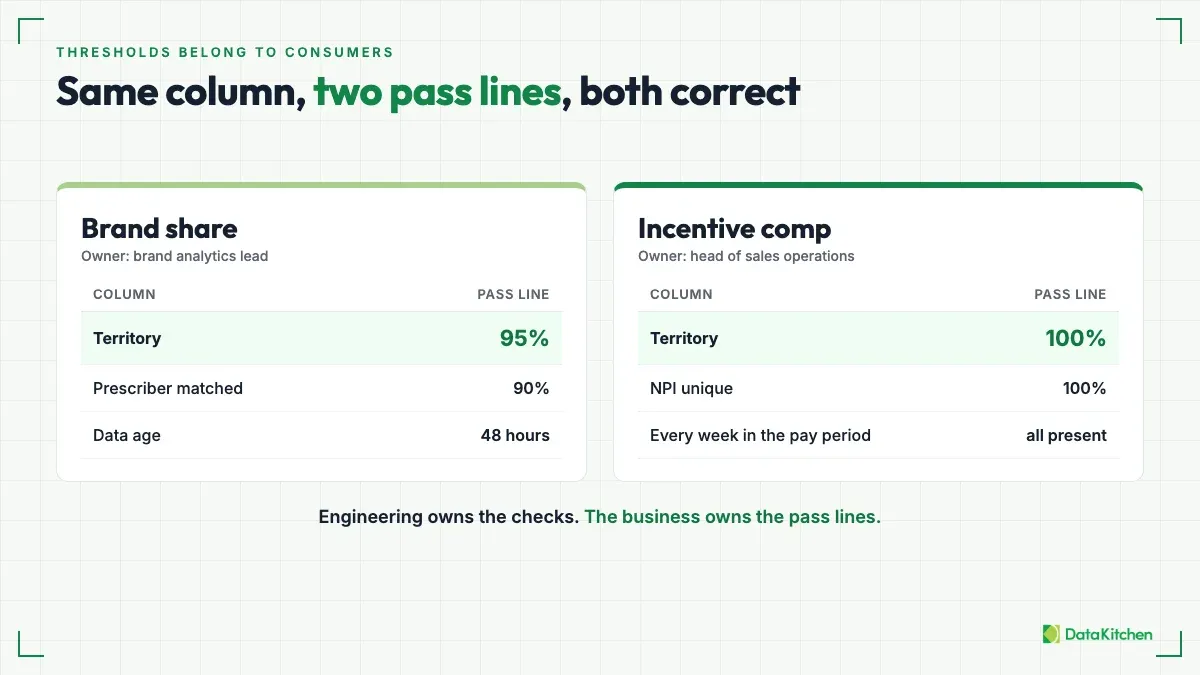
The columns are that consumer’s critical data elements. Incentive comp depends on the prescriber key, the territory assignment, and every week in the pay period. Brand share depends on territory too, but it can live with gaps. Our post on critical data elements covers how to pick them.
The pass lines differ. Brand share tolerates a few unmatched prescribers. Incentive comp tolerates none. Same column, two lines, and both are correct.
The owner matters more than people expect. Engineering owns the checks. The business owns the thresholds. Your engineers know how to detect a duplicate prescriber. They don’t know how many duplicates the comp plan can absorb. The head of sales operations does, and that person should sign the line.
When you have more breaches than time, rank them by consequence instead of by count. Our post on impact dimensions shows how.
The part nobody budgets for
Per-consumer thresholds need coverage underneath them. A pass line on a column only means something if enough tests touch that column.
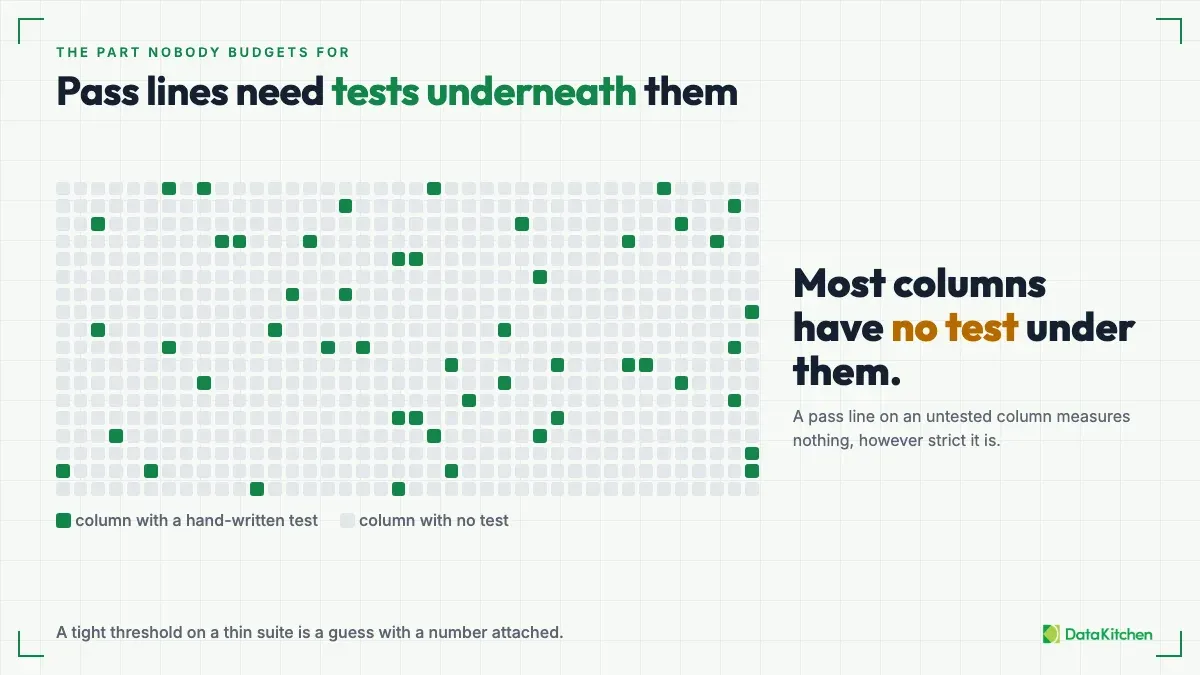
Most teams don’t have that. A few dozen hand-written tests, on the columns somebody remembered, can’t support ten consumer scorecards across hundreds of tables. So teams write the obvious not_null and unique tests and stop. Then the incentive comp scorecard reads 100% on the columns it depends on, and the number measures almost nothing.
A tight threshold on a thin suite is a guess with a number attached.
Generate the tests, then scope them
The fix is to stop writing the suite by hand. Profile every table. Generate the tests from the profile. Then build one scorecard per consumer from the generated results.
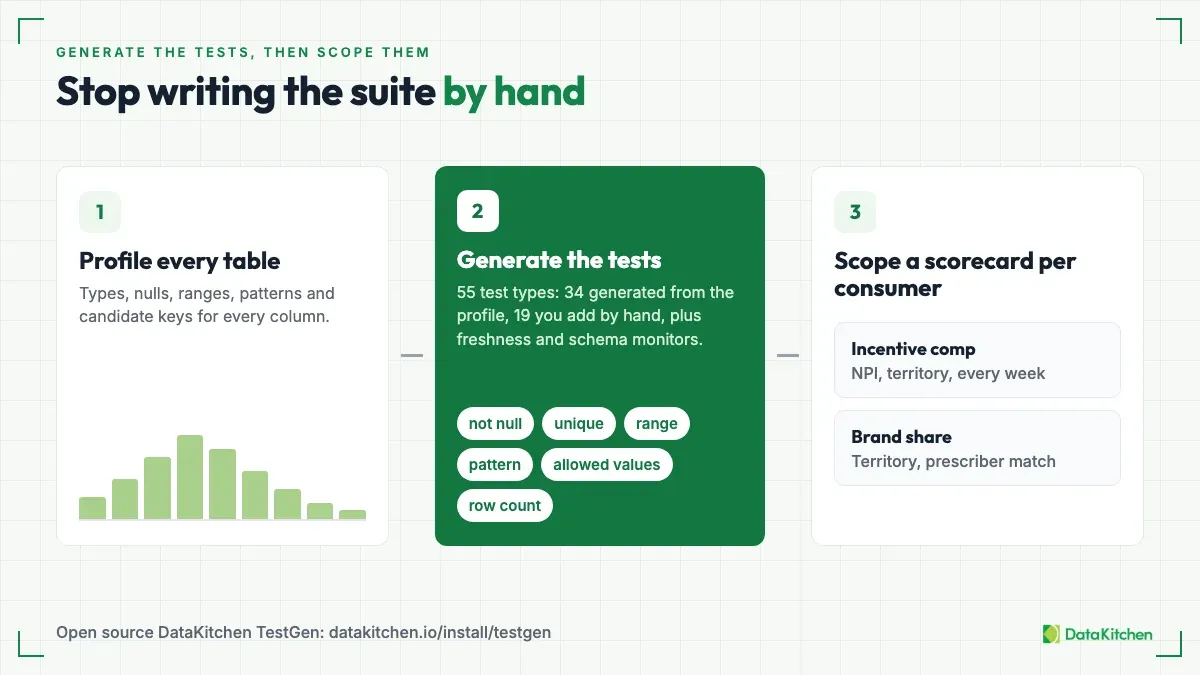
Open source DataKitchen TestGen works this way. It profiles each column and generates tests from what it finds. A profile that finds zero nulls in a column generates a not-null test on it. The 55 test types include the freshness and schema monitors: 34 are generated automatically from the profile, 19 you add by hand (business rules, custom SQL, and set-bound tests), and the monitors make up the rest. It also runs 32 hygiene detectors. Its scorecards can be configured around DAMA categories, critical data elements, specific model requirements, or current business goals.
Scoping a scorecard to a consumer’s critical data elements is the scoping step. The incentive comp scorecard is the same generated results, cut down to the columns that consumer depends on. The pass line for each column is the consumer’s decision, recorded with its owner. Your team records each consumer’s pass lines and reads each scorecard against them.
Generation covers one of the example’s three defects. The duplicate prescriber is caught by a uniqueness test on the business key. The territory assignment rule and the check that every week of the pay period is present are business rules you add by hand.
A score is a summary, and a summary without a way in is the 95% problem again. Put each consumer’s score on a data quality dashboard where people can click from the number down to each failing test and the rows behind it. That means many dashboards, one per consumer, not one for the whole warehouse. We cover the options in six types of data quality dashboards.
The pass lines and the owner are your decision. Record them next to the scorecard, in your repo or your wiki or wherever your team looks. Write them down as a decision, with a name and a date, so the next person knows who to ask.
Trap one: a unique test on the surrogate ID
A unique test on prescriber_id passes while the same doctor sits in the table twice under two IDs. The system generates the surrogate ID, so the system makes every row unique, duplicates included.
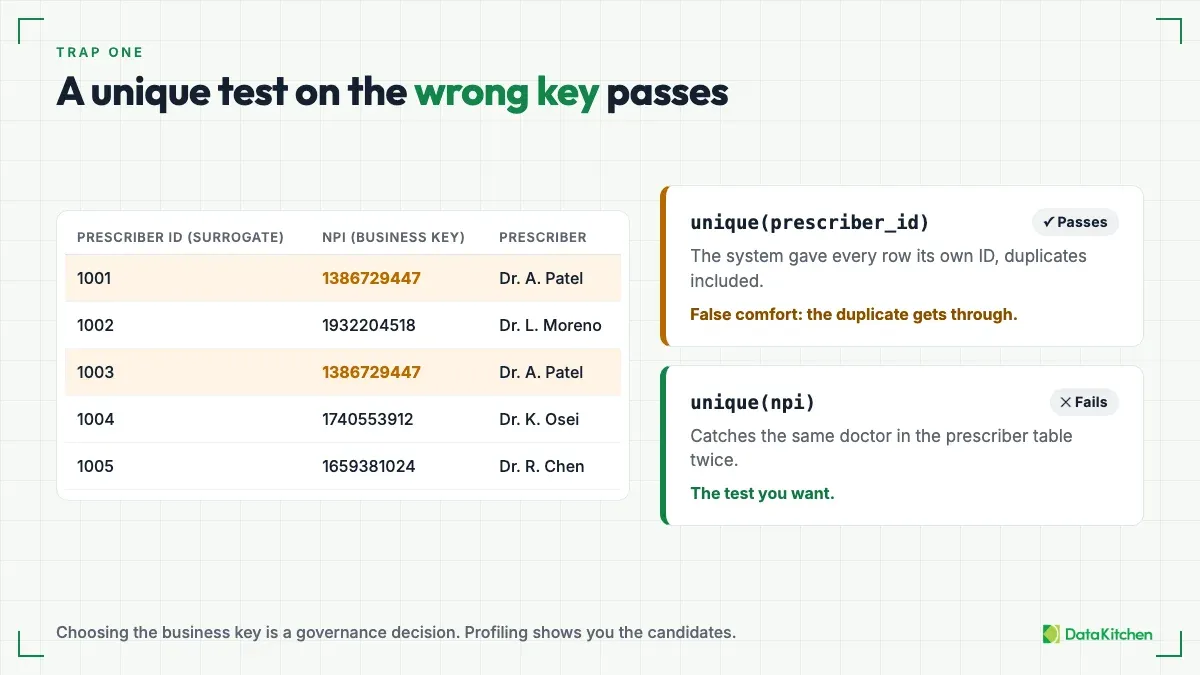
Test the business key instead. In pharma, that’s the NPI. Put the uniqueness test on the prescriber dimension, where there’s one row per NPI. On the prescription fact table, test the grain instead: NPI plus territory, product, and week. NPI alone repeats legitimately there, once for each territory, product, and week.
Choosing the business key is a governance decision, and it’s easy to put off because it sounds like paperwork. It isn’t. It decides what “the same prescriber” means. Profiling gives you the candidates and the evidence: which columns come close to unique, and which values repeat. Someone with authority still has to pick one.
Trap two: living with lots of warnings
A test can pass, fail, or warn. Warn is the comfortable one. The duplicate-prescriber check on the incentive comp table trips a warning, the run finishes, and nobody gets paged. The next morning it trips again.
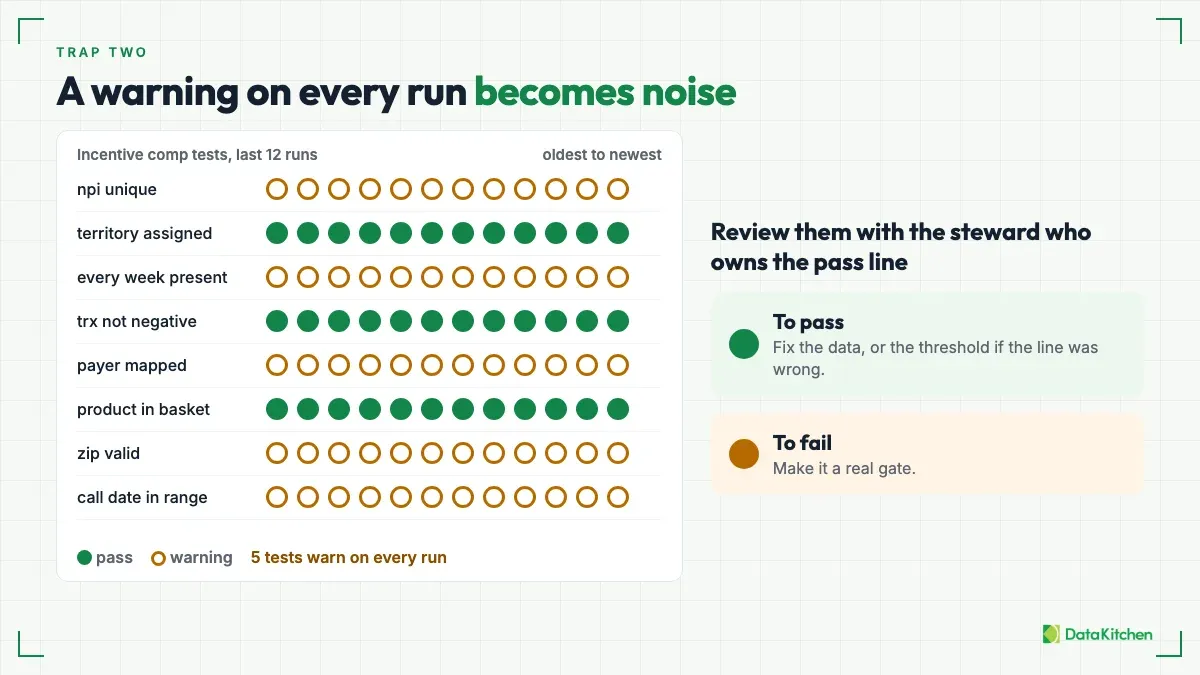
A warning is fine for a while. It buys you time to find out whether the data is wrong or the threshold is. The trap is leaving it there. A warning that fires every run stops being information and becomes noise, and nobody reads noise. Eventually the one that matters scrolls past with the rest.
Some teams live with dozens of warnings and do fine, because they keep working them down. The teams that get hurt are the ones that stop looking.
So review the results on a schedule, with the business sponsor or data steward. That’s the owner who set the pass line. Move each warning one of two ways. Move it to pass: fix the data, or change the threshold if the line was wrong. Or move it to fail: make it a real gate. For incentive comp, a duplicate prescriber against a pass line of zero should fail, and the owner should be the one who says so.
Where to start
One consumer, one scorecard, one owner.
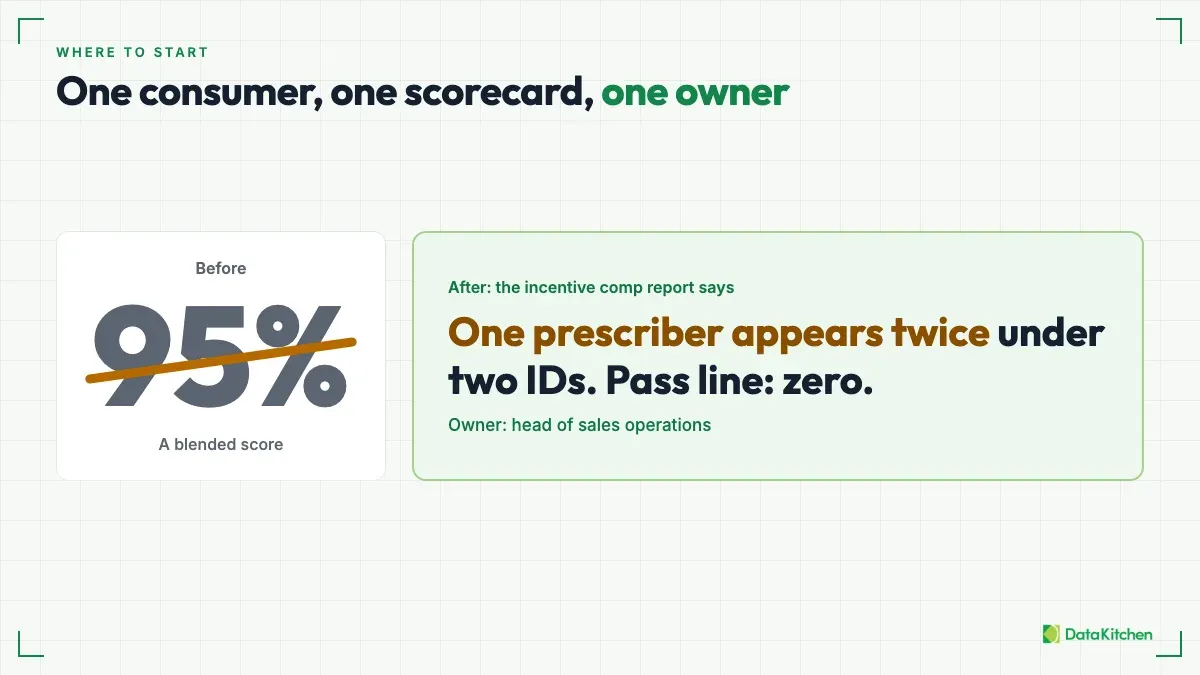
Start Monday with the tests. Profile your tables and generate the tests first, so there is coverage under whatever pass lines you set. Then pick the consumer whose numbers move money. In pharma, that’s incentive comp. List the columns it depends on. Sit down with its owner and set a pass line for each one. Then report breaches against those lines instead of a blended score.
The report stops saying “95%.” It says one prescriber appears twice under two IDs, and the pass line is zero. Somebody can act on that sentence.
Why we built TestGen
That’s why we built TestGen. We wanted to drive down the marginal cost of creating lots of data quality tests. Per-consumer scorecards and pass lines only work when the tests under them cost almost nothing. If every test takes an engineer an afternoon, you end up with a few dozen and a scorecard that measures almost nothing. If a profile generates them, you get coverage on every table, and the pass lines mean something. You can try it with open source TestGen.
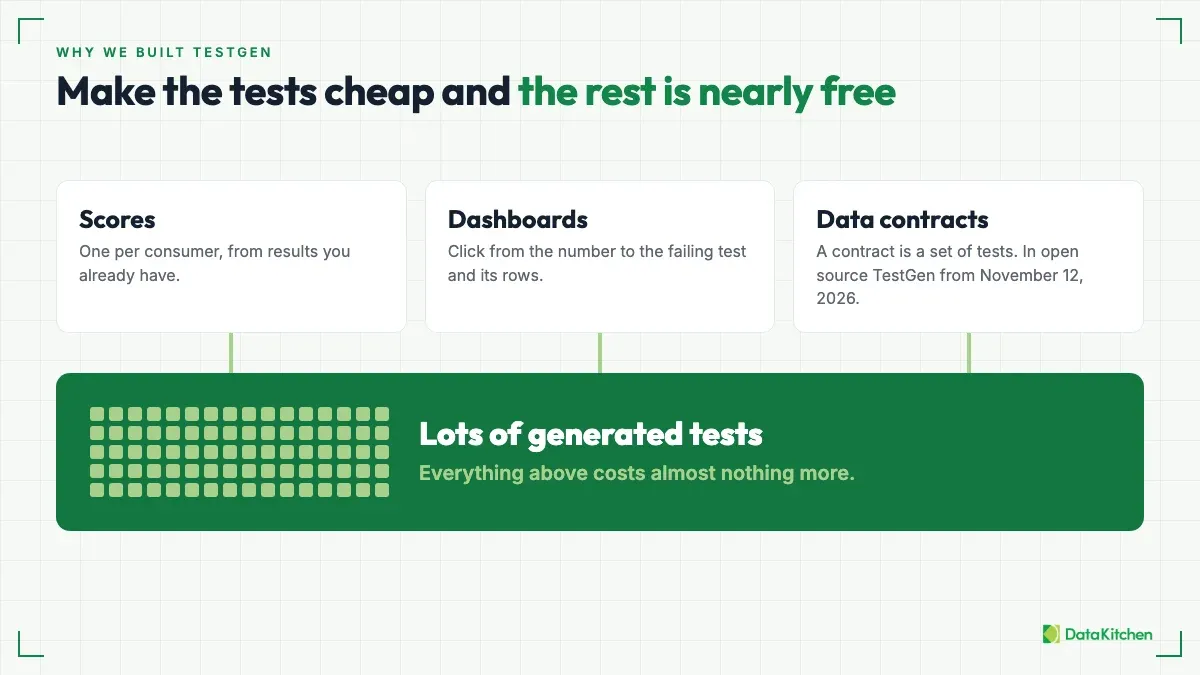
Once tests are cheap, everything built on top of them gets cheap too. A score is a summary of test results. A dashboard is a view of them. With the tests already there, one more scorecard per consumer costs almost nothing, and so does one more dashboard. The marginal cost of each is close to zero.
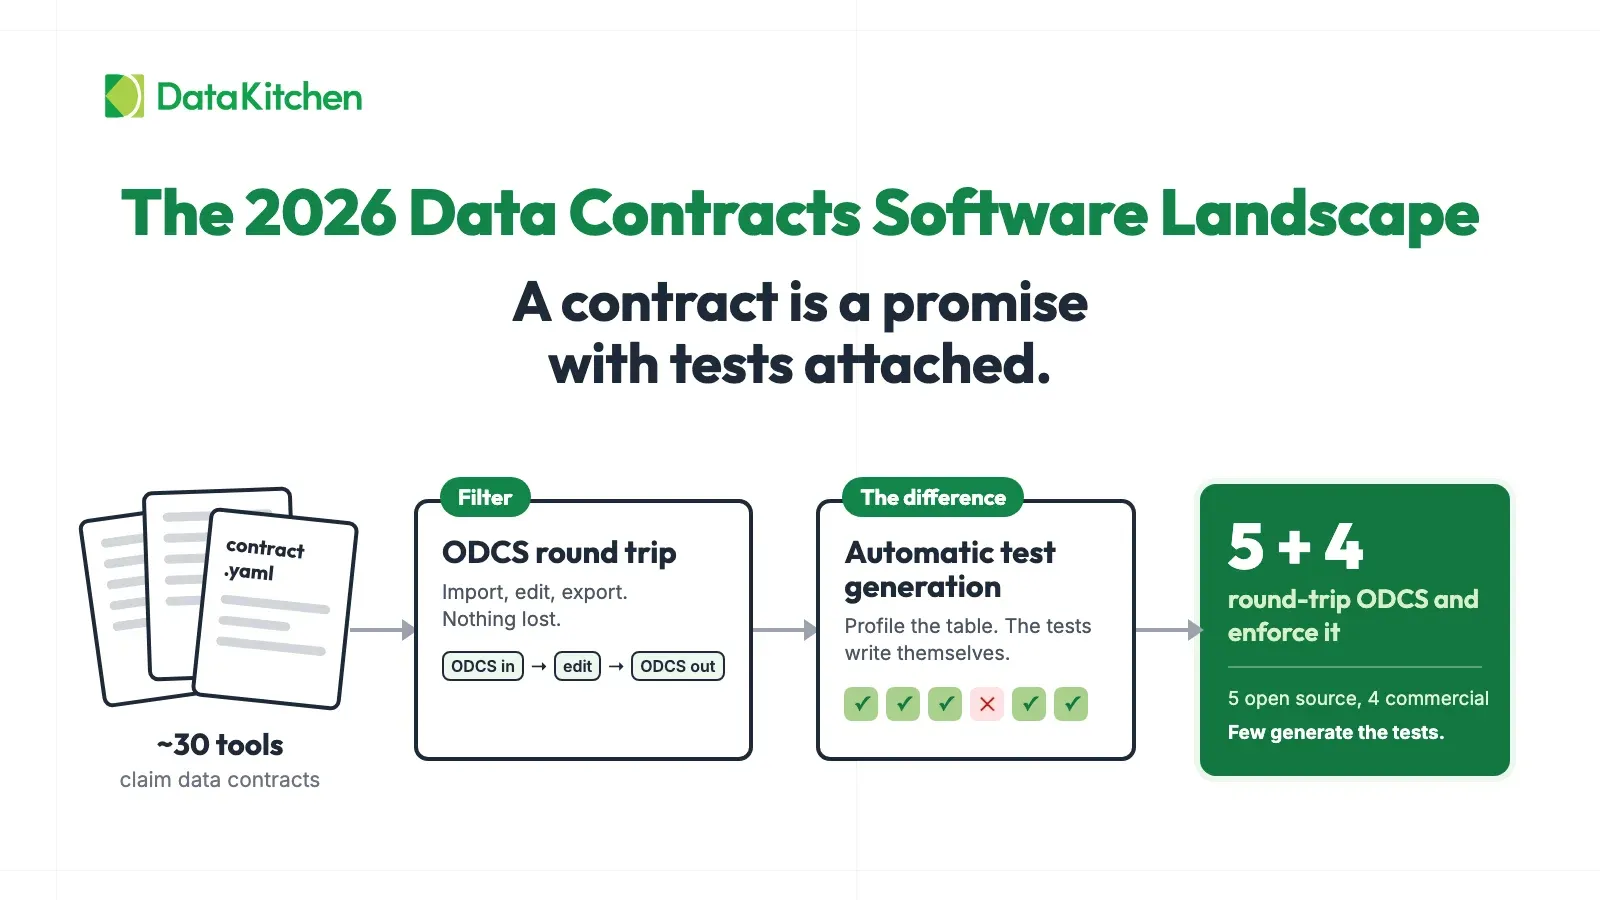
Data contracts work the same way. A contract is a set of tests, so the new data contracts feature in open source TestGen, which ships November 12, 2026, costs almost nothing to add once the tests exist. We walk through it in the data contracts webinar. Make the tests cheap, and the rest comes nearly free.
FAQ
What are the key points in this blog?
A single blended data quality score hides that one table can be fit for one consumer and unfit for another. Give each consumer its own scorecard, with the columns it depends on, a pass line for each, and a named owner. Generate the tests from a profile so those pass lines measure something, then give each consumer a drill-down dashboard. Avoid two traps: unique tests on surrogate IDs and warnings left to pile up.
Can a table have a single data quality score?
No. A table has no single quality score, because quality depends on the job. Wang and Strong defined data quality as fitness for use in 1996. The same prescription table can be fit for brand market share and unfit for incentive comp on the same morning. A blended score hides that split, so each consumer needs its own scorecard.
Who should set data quality thresholds?
The business owner of each consumer sets the thresholds. Engineering owns the checks. The owner of the incentive comp process knows how many duplicate prescribers the comp plan can absorb, and your engineers don’t. Record the pass lines and the owner’s name next to the scorecard.
Why isn’t a unique test on the surrogate ID enough?
Because the system generates surrogate IDs, so every row is unique even when it’s a duplicate. A unique test on prescriber_id passes while the same doctor sits in the table twice under two IDs. Test the business key instead. In pharma, that’s the NPI: one row per NPI in the prescriber dimension, or NPI plus territory, product, and week on the prescription fact table.
What should I do with data quality tests that only warn?
A warning is fine for a while, because it buys you time to learn whether the data or the threshold is wrong. A warning that fires every run turns into noise. Review the results on a schedule with the business sponsor or data steward who owns the pass line, and move each warning to pass, by fixing the data or the threshold, or to fail, so it becomes a real gate.
How does TestGen support per-consumer scorecards?
TestGen profiles each column and generates tests from the profile. It has 55 test types, including the freshness and schema monitors: 34 generated automatically and 19 added by hand. It also runs 32 hygiene detectors. Its scorecards can be configured around DAMA categories, critical data elements, specific model requirements, or current business goals. You decide the thresholds and the owner, and record them next to the scorecard.