Eckerson Group published Best Practices in DataOps: How to Create Robust, Automated Data Pipelines in June 2019. Wayne Eckerson wrote it. DataKitchen sponsored it, alongside Infoworks, Unravel, and StreamSets.
The whole report is on this page, which is why the byline above is his and not ours. DataKitchen’s commentary on it comes first, so that our opinions and Eckerson’s research never sit in the same paragraph: every section between here and the horizontal rule is DataKitchen’s, and everything from the heading Best Practices in DataOps: How to Create Robust, Automated Data Pipelines down to the end of About DataKitchen is Eckerson’s text, reproduced as written.
What this page is, and who wrote what
Eckerson Group researched, wrote, and owns Best Practices in DataOps. Wayne Eckerson is its author, and he published it in June 2019. DataKitchen is one of four sponsors of the research, and the report’s own second page records what that sponsorship grants: DataKitchen, Infoworks, Unravel, and StreamSets “have exclusive permission to syndicate its content.” That permission is why the full text is here rather than behind a form.
Eckerson Group’s copyright notice, from the report’s cover page, verbatim:
This publication may not be reproduced or distributed without Eckerson Group’s prior permission.
Three things this page does not do. It does not rewrite Eckerson’s prose into DataKitchen’s voice. It does not present his conclusions as ours. And it does not present our commentary as his — the three sections below are DataKitchen’s argument about the report, and they are labelled that way.
Two notes on the transcription. The PDF’s centred pull-quotes are typographic repeats of sentences in the paragraph beside them, so each of those sentences appears once here rather than twice. The table of contents is dropped, its page numbers having no meaning in HTML. Everything else, including the report’s spelling of Celgene as “Celegne”, is as printed.
How Eckerson researched the report
Twenty-five pages, and no survey panel. Eckerson built the report from interviews with DataOps practitioners at both user and vendor organizations, and five of them carry most of its length.
| Practitioner | Role in 2019 | What they described to Eckerson |
|---|---|---|
| Shakeeb Akhter | Director of enterprise data warehousing, Northwestern Medicine | Cross-functional teams assigned to individual business groups, 30 parallel development projects, and separate development, test, pre-production, and production environments |
| Greg Martinez | Enterprise analytics engineer manager, Intel | A petabyte-scale data lake drawing on more than 150 sources, 30 development teams, more than 1,000 tests in the automation framework, and a framework that detects source schema changes and updates targets without human intervention |
| Harvinder Atwal | Head of data strategy and advanced analytics, MoneySuperMarket | A data team created outside IT, bonuses shared across the team, and model build time falling from weeks to hours |
| James Royster | Senior director of commercial analytics, Celgene | A data department whose mission is data rather than infrastructure, and business logic placed in whichever architectural layer suits it |
| Jeff Magnusson | Vice president of data platform, Stitch Fix | Engineers building tools and abstractions so data scientists own their pipelines from acquisition to production |
Every number in that table is Eckerson reporting what those practitioners told him in 2019, not a DataKitchen measurement. One disclosure: Royster later co-wrote Recipes for DataOps Success with us, so weigh his quotes accordingly.
Three recommendations we would still underline
Measure before you start
The first recommendation is to benchmark the environment you have: cycle times for pulling a new source, adding a column, deploying a model, standing up a sandbox. It is the least glamorous step in the report and the one most often skipped, and skipping it means every later claim of improvement is an anecdote. Our own version of that exercise is the DataOps Maturity Model assessment.
Attack the biggest bottleneck, not the most annoying one
Step 2 is to start small, and specifically to start at the single worst constraint on delivery rather than wherever the loudest complaint is. That is the Theory of Constraints applied to a data team, and it is the same argument we make at length in Eliminate Your Analytics Development Bottlenecks.
Tests are not a phase
Step 9 is where the report is at its best. It puts tests in production as well as in development, to catch data drift and schema changes rather than only code defects, and it frames them as the thing that makes automation survivable:
Tests are the bedrock of automation. Without tests, automation is a runaway freight train that inevitably crashes.
— Wayne Eckerson, Best Practices in DataOps, Eckerson Group, 2019
That is still the sentence we would put on the wall. What has changed is the starting point. In 2019 a team assembled its own test suite one test at a time, which is how Intel got to more than 1,000 of them. Today that work starts from a generated baseline: DataOps TestGen profiles the data and writes the first several hundred tests, so the team’s effort goes into the business rules a profiler cannot infer.
The one we argue with
Step 10, create an enterprise data platform, is where we part company with the report.
The reasoning behind it is sound: one platform makes reuse, lineage, and governance easier because everything runs in one place. The problem is the timeline. Consolidating an enterprise onto a single data platform is a multi-year program with its own political weather, and a team that treats it as step 10 has just made the other nine wait on it. Eckerson notes DataKitchen’s alternative in the report’s own tooling section, and it remains our position: orchestrate the flow of data through the systems a team already runs, and put tests around it, rather than replacing the stack first. The gains in steps 1 through 9 do not require permission from a platform decision.
The second thing we would add is not in the report at all, and could not have been in 2019. The twelve tool categories in step 8 are the DevOps toolchain plus a catalog and a glossary. Not one of them watches the data itself moving from source to dashboard, which is the layer where the errors those fourteen symptoms describe actually surface. That gap is what DataOps Observability exists to close.
Numbers people misattribute to this report
One correction worth making, because we see the citation go wrong. The 2019 figures about error rates are not in this report: 300 respondents, 30% of them seeing more than 11 data errors a month. They come from the joint DataKitchen and Eckerson survey published separately as Key Findings of the 2019 DataOps Survey, with the first phase of results written up in 2019 DataOps Survey: Errors and Slow Innovation Abound. Best Practices in DataOps is interview-based and contains no survey tables.
Where the original PDF lives
TIP
The report as Eckerson Group laid it out: Best Practices in DataOps: How to Create Robust, Automated Data Pipelines (PDF, 25 pages, June 2019). Wayne Eckerson’s current research is at eckerson.com.
IMPORTANT
Everything below, from the report’s title through About DataKitchen, is Eckerson Group’s text. Wayne Eckerson wrote it and Eckerson Group owns it. It is reproduced here under the syndication permission the report grants its four sponsors. DataKitchen’s commentary is above, and there is none inside it.
Best Practices in DataOps: How to Create Robust, Automated Data Pipelines
By Wayne Eckerson. June 2019. Research sponsored by DataKitchen, Infoworks, Unravel, and StreamSets.
About the Author
Wayne W. Eckerson has been a thought leader in the data analytics field since the early 1990s. He is a sought-after consultant, noted speaker, and expert educator who thinks critically, writes clearly, and presents persuasively about complex topics. Eckerson has conducted many groundbreaking research studies, chaired numerous conferences, written two widely read books on performance dashboards and analytics, and consulted on BI, analytics, and data management topics for numerous organizations. Eckerson is the founder and principal consultant of Eckerson Group.
About This Report
To conduct research for this report, Eckerson Group interviewed numerous DataOps practitioners from both user and vendor organizations. This report is sponsored by DataKitchen, Infoworks, Unravel, and StreamSets who have exclusive permission to syndicate its content.
Executive Summary
DataOps promises to take the pain out of managing data for reporting and analytics. In most companies, data travels a tortuous route from source systems to business users. Behind the scenes, data professionals go through gyrations to extract, ingest, move, clean, format, integrate, transform, calculate, and aggregate data before releasing it to the business community.
These “data pipelines” are inefficient and error prone: data hops across multiple systems and is processed by various software programs. Humans intervene to apply manual workarounds to fix recalcitrant transaction data that was never designed to be combined, aggregated, and analyzed by knowledge workers. Reuse and automation are scarce. Business users wait months for data sets or reports. The hidden costs of data operations are immense.
DataOps promises to streamline the process of building, changing, and managing data pipelines. Its primary goal is to maximize the business value of data and improve customer satisfaction. It does this by speeding up the delivery of data and analytic output, while simultaneously reducing data defects—essentially fulfilling the mantra “better, faster, cheaper.”
DataOps emphasizes collaboration, reuse, and automation, along with a heavy dose of testing and monitoring. It employs team-based development tools for creating, deploying, and managing data pipelines. This report explains what DataOps is, where it came from, what it promises, and how to apply it successfully.
Key Takeaways
- DataOps applies the rigor of software engineering to data development.
- DataOps practices borrow from DevOps, Agile, Lean, and Total Quality Management (TQM) methodologies.
- DataOps makes it possible to scale development and increase the output of data teams while simultaneously improving the quality of data output.
- The core mantras of DataOps are: faster, better, cheaper; collaborate, iterate, automate; and standardize, reuse, refine.
- DataOps requires a culture of continuous improvement.
Recommendations
This report recommends 10 steps to DataOps success. On the surface, most of these recommendations seem obvious but collectively they provide a powerful strategy for maximizing the value of data in an organization.
- Assess your data environment
- Start small
- Create a data operations department
- Align with the organization
- Educate your team
- Create cross-functional teams
- Build for reuse and automation
- Implement data development tools
- Apply quality checks
- Create an enterprise data platform
BONUS: Continuously improve
Understanding DataOps
Shakeeb Akhter’s data warehousing and analytics team was mired down in a continuous flood of request tickets. Most “new” requests were nearly identical to prior tickets, just tweaks to existing reports or data extracts. The volume of these requests made it impossible for the team to focus on higher-value projects, such as self-service and predictive analytics, much to their dismay. Customers, too, were frustrated by the slow delivery and lack of transparency about their requests.
“We wanted to flip the model and look at different ways of delivering value to our customers,” says Akhter, director of enterprise data warehousing at Northwestern Medicine, a leading academic medical center based in Chicago. “DataOps gave us a streamlined, customer-centric process that we needed.”
DataOps defined. Short for data operations, DataOps is a set of practices, processes, and technologies for building analytic solutions, including reports, dashboards, self-service analytics, and machine learning models. It applies the rigor of software engineering to the development and execution of data pipelines, which govern the flow of data from source to consumption. The purpose is to accelerate the delivery of data and analytics while simultaneously improving quality and lowering costs. By delivering data “faster, better, cheaper,” data teams increase the business value of data and customer satisfaction.
DataOps is inspired by the DevOps movement in software engineering that uses code repositories, testing frameworks, and collaborative development tools to scale development, increase code reuse, and automate deployments. DevOps bridges the gap between development, QA, and operations teams so organizations can shrink cycle times while reducing defects. Likewise, DataOps brings together data stakeholders—data architects, data engineers, data scientists, data analysts, application developers, and product owners (i.e., business people)—to build end-to-end solutions in an agile, collaborative fashion.
DataOps also borrows heavily from Agile, Lean, and Total Quality Management. Like Agile, DataOps emphasizes the use of self-organizing teams with business involvement, short development sprints that deliver fully tested code, and regular process reviews. Like Lean, DataOps requires a laser-like focus on the customer and the creation of simple, standardized, automated processes that eliminate waste, redundancy, and cost. And, like Total Quality Management, DataOps espouses continuous testing, monitoring, and benchmarking to detect issues before they turn into major problems. All three methodologies espouse a culture of continuous improvement. (See figure 1.)
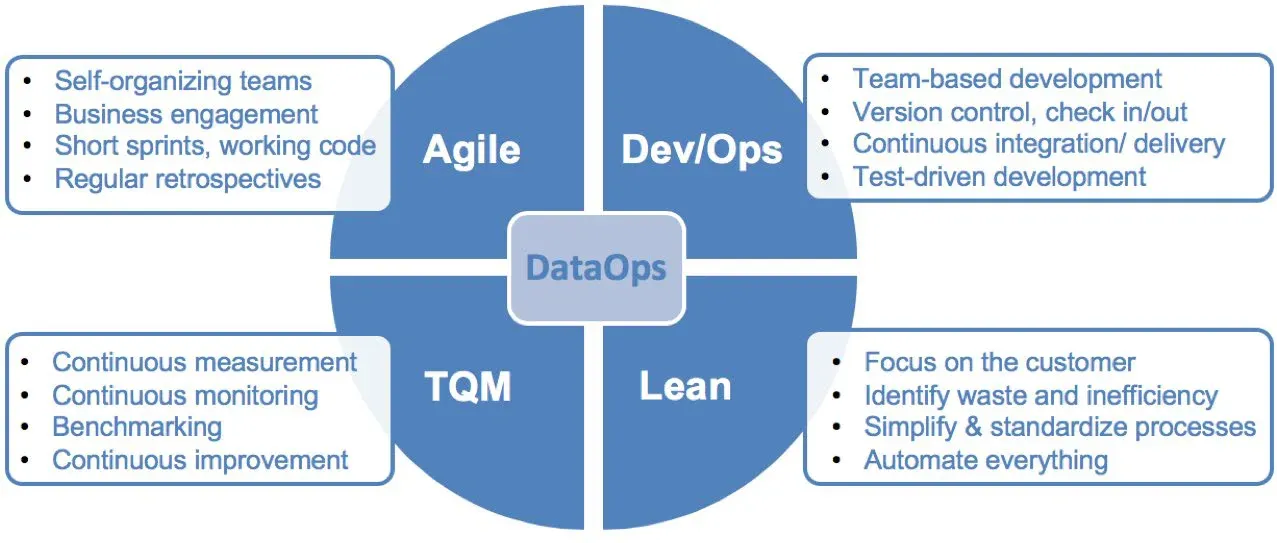
Figure 1. Dimensions of DataOps. Source: Wayne Eckerson, Best Practices in DataOps, Eckerson Group, June 2019.
The same figure as text:
| Methodology | What DataOps takes from it |
|---|---|
| Agile | Self-organizing teams; business engagement; short sprints, working code; regular retrospectives |
| Dev/Ops | Team-based development; version control, check in/out; continuous integration/delivery; test-driven development |
| TQM | Continuous measurement; continuous monitoring; benchmarking; continuous improvement |
| Lean | Focus on the customer; identify waste and inefficiency; simplify and standardize processes; automate everything |
To each his own. DataOps means different things to different teams. Some embrace agile concepts and methods, while others implement DevOps tools to better streamline and govern development processes. Others focus on testing to improve quality and create a “lights out” data operating environment. However, once teams experience the benefits of DataOps, they often embrace the complete package of DataOps techniques and tools to deliver faster, better, cheaper data products.
For the data team at Northwestern Medicine, DataOps first meant creating agile, cross-functional teams dedicated to individual business groups. Each agile team consists of a data architect, a data engineer, a report developer, and a business representative (i.e., product manager), who are cross-trained in each other’s skills (except the business person). The team consolidates and prioritizes requests and building end-to-end solutions for their client in an incremental fashion. Says Akhter, “This approach has improved customer satisfaction. There is greater communication and transparency, and the teams have delivered a series of quick wins.”
To increase team productivity, Northwestern Medicine invested in a number of tools to foster collaboration and automation. The data teams now use Git as a source control repository for data integration code; Jira to coordinate Scrum processes and manage user stories; TeamCity to facilitate code integration in a team-based development environment; and Octopus to deploy code from test into production. “Historically, data teams have been loose in how they build things,” says Akhter. “We now follow DataOps principles where we segregate duties and environments and apply automation wherever possible.”
DataOps Use Cases
Data warehousing is just one area where DataOps can make an impact. It can be applied to any business process or analytic solution that involves extracting, ingesting, cleaning, moving, storing, transforming, integrating, or aggregating data. DataOps first arose in the big data space to address the complexity and scale of those environments. Since many big data environments promote self-service and data science applications, companies now apply DataOps to those use cases as well. (See figure 2).
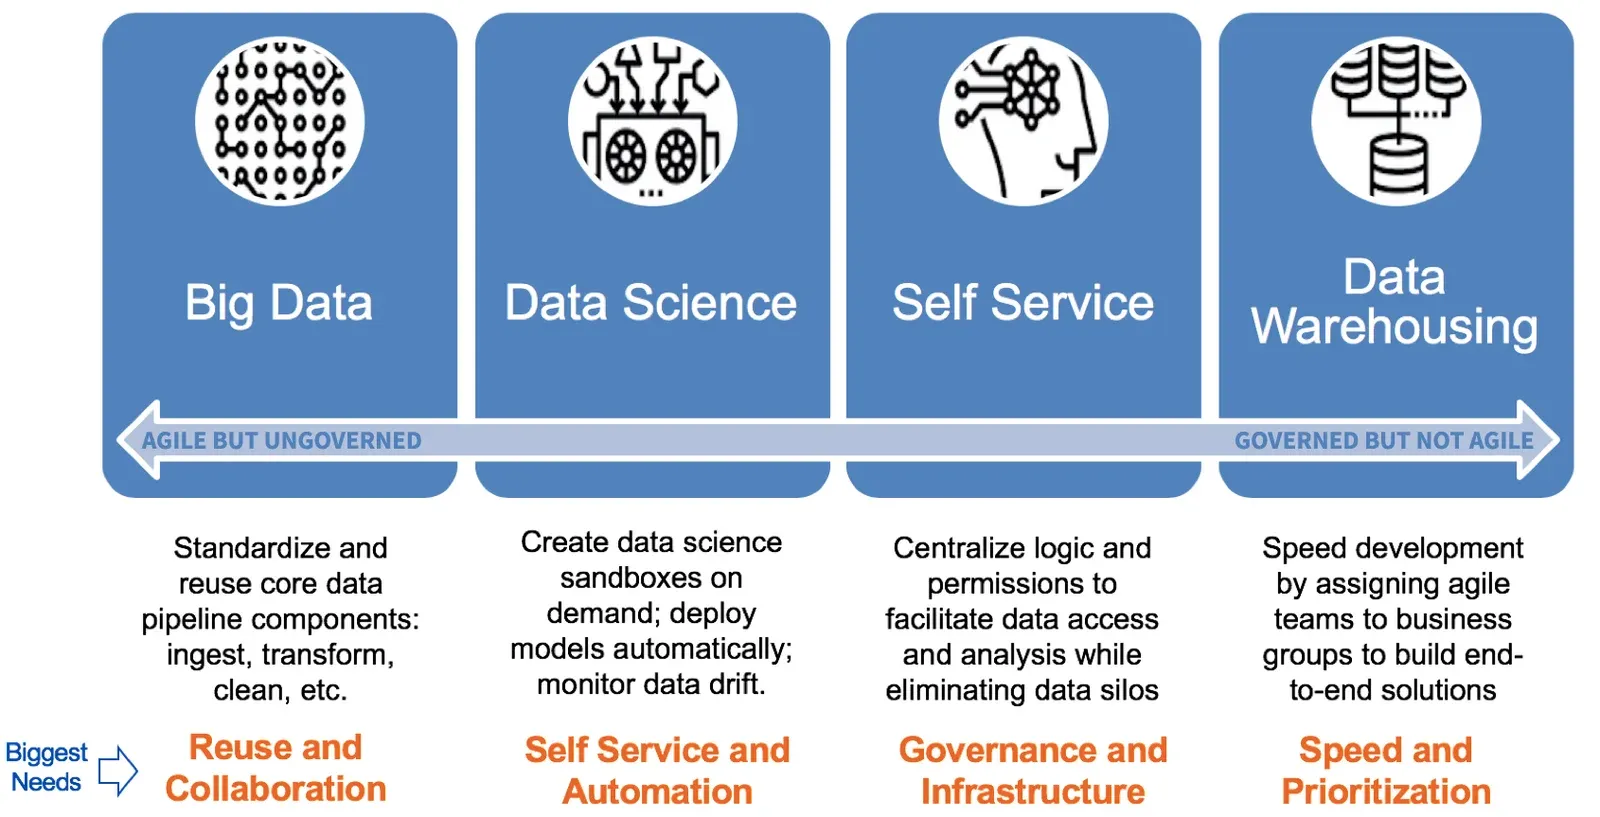
Figure 2. Primary DataOps Use Cases. The arrow beneath the four panels runs from “agile but ungoverned” on the left to “governed but not agile” on the right. Source: Wayne Eckerson, Best Practices in DataOps, Eckerson Group, June 2019.
The same figure as text:
| Use case | What DataOps does here | Biggest need |
|---|---|---|
| Big Data | Standardize and reuse core data pipeline components: ingest, transform, clean, etc. | Reuse and Collaboration |
| Data Science | Create data science sandboxes on demand; deploy models automatically; monitor data drift. | Self Service and Automation |
| Self Service | Centralize logic and permissions to facilitate data access and analysis while eliminating data silos | Governance and Infrastructure |
| Data Warehousing | Speed development by assigning agile teams to business groups to build end-to-end solutions | Speed and Prioritization |
Other areas for DataOps include artificial intelligence (“AIOps”), cloud migration (“CloudOps”), digital transformation, and Customer 360 projects—essentially, any business activity that requires agile manipulation of complex data to support or create business applications.
Big data. A data lake will turn into a data swamp without robust controls around data or an easy way to operationalize and manage applications built there. DataOps helps big data teams create reusable components, automate data pipelines, and monitor operations. The DataOps mantra here is: “standardize, reuse, collaborate.” For example, Intel applies DataOps to its multi-petabyte data lake to create a “lights out” data processing environment that “minimizes waste and redundancy and fosters a culture of continuous improvement,” according to Greg Martinez, enterprise analytics engineer manager at the company.
Data science. Data scientists are often hamstrung by a lack of access to production data and sufficient computational processing to run their models; they are forced to work with sample data on laptop computers. Conversely, many have become dependent on data engineers to create working data sets and application engineers to deploy their models in operational environments. DataOps enables data scientists to provision temporary data sandboxes and create simple data pipelines as well as deploy models with minimal IT or engineering assistance.
Self-service reporting. Data analysts armed with self-service visualization tools have an endless appetite for data sets to feed their analytical inquiries. DataOps enables data analysts to service their own data needs within a curated data environment facilitated by a data catalog and data preparation tools. The data department creates a self-service data infrastructure that balances speed and standards and fosters a culture of governance that accelerates the delivery of data without spawning data silos.
Data warehousing. Data warehouses provide the underpinning for standard reports and dashboards, but are notoriously slow and costly to build and change. Many companies have implemented data warehousing automation tools to reduce the time required to create and change schema and rules. Others, like Northwestern Medicine, apply DataOps principles to better partner with the business and accelerate delivery cycles.
Signs That You Need DataOps
Most data teams can benefit from DataOps, some more than others. If there is “data pain,” DataOps can help. Following is a list of symptoms that indicate whether your data team is a good candidate for DataOps.
- Your data team is flooded with minor request tickets and is burning out.
- Business users don’t trust the data because it contains too many errors.
- You are too busy putting out “data fires” to implement predictive analytics.
- Source system changes keep breaking your data integration jobs and data pipelines.
- Business users don’t understand why it takes so long to get a new data set.
- You have difficulty meeting service level agreements (SLAs) for critical applications.
- It takes months to deploy a new analytics use case.
- You rely on business users to debug data quality issues, much to their dismay.
- Data analysts recreate existing data pipelines with minor variations.
- Data scientists wait for months for data and computing resources.
- It is difficult to migrate to the cloud because your data environment is too complex.
- Your self-service initiative has spawned hundreds of data silos.
- Your data lake is more of a data swamp.
- It takes months to deploy a single predictive model.
Best Practices
DataOps represents a broad set of principles, practices, and technologies. The DataOps Manifesto describes core DataOps principles, many of which are pulled directly from Agile, Lean, DevOps, and TQM methodologies. It includes principles such as the following:
- Continually satisfy your customer
- Self-organize
- Reduce heroism
- Reuse
- Monitor quality and performance
To put some meat on these principles, we talked to a number of DataOps practitioners from user and vendor organizations. Following is a compilation of best practices gleaned from these conversations.
1. Assess Your Data Environment
You can’t manage what you don’t measure. Before starting a DataOps initiative, it’s best to conduct an inventory of your existing data environment and processes. The goal is to create a benchmark that you can use to evaluate the impact of DataOps practices. For example, you might want to measure the cycle times for key data processes, such as pulling data from a new source, adding a new column to a database table, populating an OLAP cube, deploying a machine learning model, or creating a sandbox for an individual data scientist.
Identify gaps. Then, you should identify inefficiencies, manual workarounds, and error-prone jobs that prevent the free flow of data from source to target. Also, evaluate how efficiently code moves through each step in the development lifecycle, from development to test and production. “We apply Lean techniques to measure bottlenecks, then we adjust our processes to remove constraints and minimize or eliminate the waste,” says Martinez from Intel. Another data leader adds: “It’s important to recognize where you are wasting time, effort, and money.”
Map processes. It may not be feasible to map all your data pipelines if they are overly complex and messy. But a process map of data flows is a powerful tool to display the waste and inefficiency in a data operation. A picture is worth a thousand words. The map can create a visceral or emotional response that convinces recalcitrant executives to invest more in data operations.
2. Start Small
DataOps is a broad discipline for optimizing the interplay of people, process, and technology to generate data and analytic solutions. Consequently, most experts recommend starting small to avoid getting overwhelmed by possibilities. As they say, a journey starts with a single step. Most recommend starting with the single biggest bottleneck choking the delivery of analytic output, gleaned from your data operations assessment (above).
There are many types of bottlenecks. Most require individuals to serve as “data heroes” sacrificing nights and weekends to avoid delays or embarrassing errors. Without heroes, data teams simply hope and pray when they deploy new functionality that it doesn’t implode or break something downstream. The most common types of bottlenecks are the following:
- Changes to database schema
- Data errors that create unplanned work and disrupt schedules
- Adding a data feed from a new data source
- Deployment processes that frequently break downstream systems
- A slow-moving impact review board
- Provisioning new development environments
- Long test cycles spanning unit, integration, and system testing
- Manual data flows that require human intervention
- Overly cautious development and testing cycles
- Lack of teamwork among data engineers, scientists, analysts, and business users
Report footnote, attached to the list above: See the online article, “Eliminate Your Data Analytics Bottlenecks,” May 16, 2019.
A process is only as fast as its slowest link. Therefore, focus on the biggest bottleneck in your data operations and devise plans to break the logjam. This may involve reengineering processes or applying new technology to automate steps. Measure the improvement from your actions and then tackle the next bottleneck. Establish a regular cadence (i.e., process) for identifying, addressing, and monitoring the elimination of key bottlenecks.
3. Create a Data Operations Department
It’s much easier to address process and systems bottlenecks if all data and analytics professionals work together in the same department. A key to DataOps success is to create a data team, ideally outside of the IT department and headed by a chief data officer (CDO).
The IT department excels at managing infrastructure, but is less skilled with data. “IT has technology experts, not data experts,” says James Royster, senior director of commercial analytics at Celegne, a global biopharmaceutical company. Royster is creating a data department whose mission is to “structure data and unlock its value.”
But even if data operations remain within IT, it’s best to carve out a separate identity for the team and populate it with data specialists: data architects, business analysts, data engineers, data scientists, and business intelligence (BI) developers. Most companies have already done this in the data warehousing space, but not in areas such as big data and data science, where the IT department oversees the Hadoop infrastructure or cloud environment.
Carving out a separate data team can be difficult without executive support. MoneySuperMarket, a British price comparison web site, created a data team outside of IT to accelerate the company’s data science initiatives, which were stalled in a cloud migration project. “IT was in charge of the data infrastructure, and we were just one of their competing priorities,” says Harvinder Atwal, head of data strategy and advanced analytics. “We told IT, ‘We can’t continue like this. We have to start from scratch.’” Subsequently, the company’s CDO orchestrated a reorganization that pulled in data specialists from IT and other areas to create a team dedicated to data science. This “massively reduced friction” for getting things done, says Atwal.
4. Align with the Organization
Scrum. The primary caveat of DataOps is to align with the business. This means putting the customer first and continuously delivering value. (See DataOps Manifesto #1: Continually satisfy your customer.) There are many ways to align with the business. Scrum bakes business engagement into the methodology. Scrum teams, for example, must have a business representative (i.e., product manager) who reprioritizes user stories after every sprint.
Quarterly consolidation. Some companies go a step further and regularly gather Scrum teams with their business counterparts to identify, consolidate, and prioritize cross-functional requirements for analytic solutions. For example, each month, Northwestern Medicine brings together business, IT, and analytics representatives to discuss and prioritize requirements for a particular operational area. The beauty of this approach, according to Akhter, is that “we prioritize work in the line of business as well as across lines of business to ensure we are working on the right things.”
According to the Scrum methodology, a business group must provide a “product owner” to the Scrum team to review output and reshuffle priorities. But many businesses balk at this requirement, endangering their Scrum initiatives. Northwestern Medicine draws a line: “If [the business] doesn’t assign a certain percentage of a business user’s time to the Scrum process, we won’t give them bandwidth,” Akhter says.
Cascading alignment. Atwal from MoneySuperMarket goes a step further. He says data teams need to align at the strategic level and then cascade requirements to individual projects. “Agile maps really well to business strategy.” He says that business objectives should map to agile themes, business strategies to agile initiatives, business tactics to epics, and business actions to user stories. “Every business has a hypothesis of what creates value, and that’s their strategy. That’s all we work on and nothing else.”
ROI metrics. DataOps practitioners say it’s critical for data teams to measure business outcomes, not just output. Data teams get so focused on measuring cycle times for producing data sets or data models that they neglect the business impact. Did their efforts move the needle for the business? Did it add revenues, lower costs, or minimize risks? Business metrics that calculate the return on data investment should ultimately guide the data team’s work.
5. Educate Your Team
Expect resistance to DataOps initiatives from data and analytics professionals. Most have worked independently without much structure, process, or controls. They will predict that DataOps will “slow us down” and that the new regimen is “better suited for software development, not data development.” Says Akhter, “The controls we put in place felt burdensome because we were the wild west before and people could do whatever they wanted.”
To overcome resistance, it’s important to educate the team about DataOps. Bring in a consultant or vendor to train the team about DataOps concepts or build an internal curriculum and reading list that explains DataOps principles, practices, and technologies. This gives everyone baseline knowledge and shared terminology that helps the team decide how best to apply DataOps practices.
After learning about DataOps, the data team at Northwestern Medicine decided to create distinct development, test, pre-production, and production environments and implement controls around the creation and promotion of code and data from one environment to another. It also implemented a suite of DataOps tools, including a code repository and continuous integration, continuous delivery, and collaboration products. These tools helped enforce the segregation of environments and enabled the team to scale up development capacity. “If you are building 30 data marts at a time with 30 data architects, you need a streamlined, automated process to protect the production environment and save you from making mistakes,” says Akhter.
After the shock of adjustment, the data teams at Northwestern Medicine embraced DataOps. “Our data architects now love DataOps because it provides a framework to deploy code without worrying about breaking things in production. They now say, ‘I can’t believe we lived without this process.’ And it frees them up to tackle other things, such as predictive analytics, non-relational data, and the cloud.”
6. Create Collaborative, Cross-Functional Teams
To scale up operations—deliver more output with fewer people—data teams often think they need to create an assembly line of specialists. This approach is baked into the waterfall method of developing software and does not work well in the analytic world where business users often don’t know what they want until they see it.
End-to-end. To better serve its customers, Northwestern Medicine creates cross-functional development teams dedicated to individual business groups. Their task is to build complete end-to-end solutions—currently, dimensional data marts and associated dashboards. Each team has a senior data architect, a data engineer, a BI developer, and a product manager from the business. “DataOps helped us bring resources together across our separate [data and analytics] teams and dedicate them to a particular customer,” says Akhter. The data team now runs 30 parallel development projects serving nearly every group in the organization, he adds.
Cross-training. To strengthen teams, Northwestern Medicine cross-trains each team member so when one person is out, another can pick up those tasks. That means a BI developer needs to learn how to architect a system, which can be a tad scary and vice versa, says Akhter. The company uses a buddy system to cross-train individuals, who also take courses to beef up their skills in different areas. As a result, each team now has the skills to “support the customer end to end and provide real value and quick wins,” Akhter says.
Incentives. Likewise, MoneySuperMarket brings together data scientists, data engineers, BI developers, and software engineers to deliver end-to-end data science solutions for the business. There are no hand-offs to specialists since teams are organized around the complete data science lifecycle. Team members also share bonuses, which encourages collaboration and helps optimize solutions. “It used to take us a few weeks to create a model, now it takes hours,” says Atwal.
7. Build for Reuse and Automation
The best way to improve operational efficiency is to maximize reuse. Unfortunately, most data developers build things in isolation and duplicate efforts. Before long, a company has multiple, redundant ingest mechanisms, data extracts, tests, and data transformations. Without collaboration tools and a shared repository, data architects, engineers, analysts, and data scientists continually reinvent each other’s work.
Reuse is critical in a large data environment. Intel has 30 development teams working in a petabyte-scale Hadoop environment that pulls data from more than 150 sources. To operate efficiently at that scale, the team has standardized numerous data constructs and components that developers can reuse or tweak to accelerate the development of new data pipelines. “We create reusable design patterns that enable us to create a data pipeline quickly, change it as needed, and maintain reliability and consistency of the data output,” says Martinez.
Intel’s big data team also has worked hard to automate every aspect of its data operations, from ingest to deployment. In fact, it has developed a “Schema Evolution Framework” that detects changes in source systems and automatically updates target schema and transformations to handle the changes without manual intervention. “We use metadata to automate our data pipelines; we want to focus our engineering resources on innovation rather than rudimentary tasks, such as adjusting data models and transforms every time there is a schema change,” says Martinez. Intel plans to offer its framework, along with its automated build and test framework, as an open source project next year.
8. Implement Collaborative Data Development Tools
DataOps tools foster collaboration that is critical for maximizing reuse and automating processes. They enable DataOps teams to scale, increase development capacity, accelerate cycle times, reduce errors, and improve data quality. In fact, DataOps, like its DevOps cousin, is often most associated with a portfolio of tools that can be used either for application or data development.
Figure 3 depicts a DataOps framework that presents a list of DataOps components and technologies. (For the complete description, see “DataOps Explained: A Remedy for Ailing Data Pipelines.”)
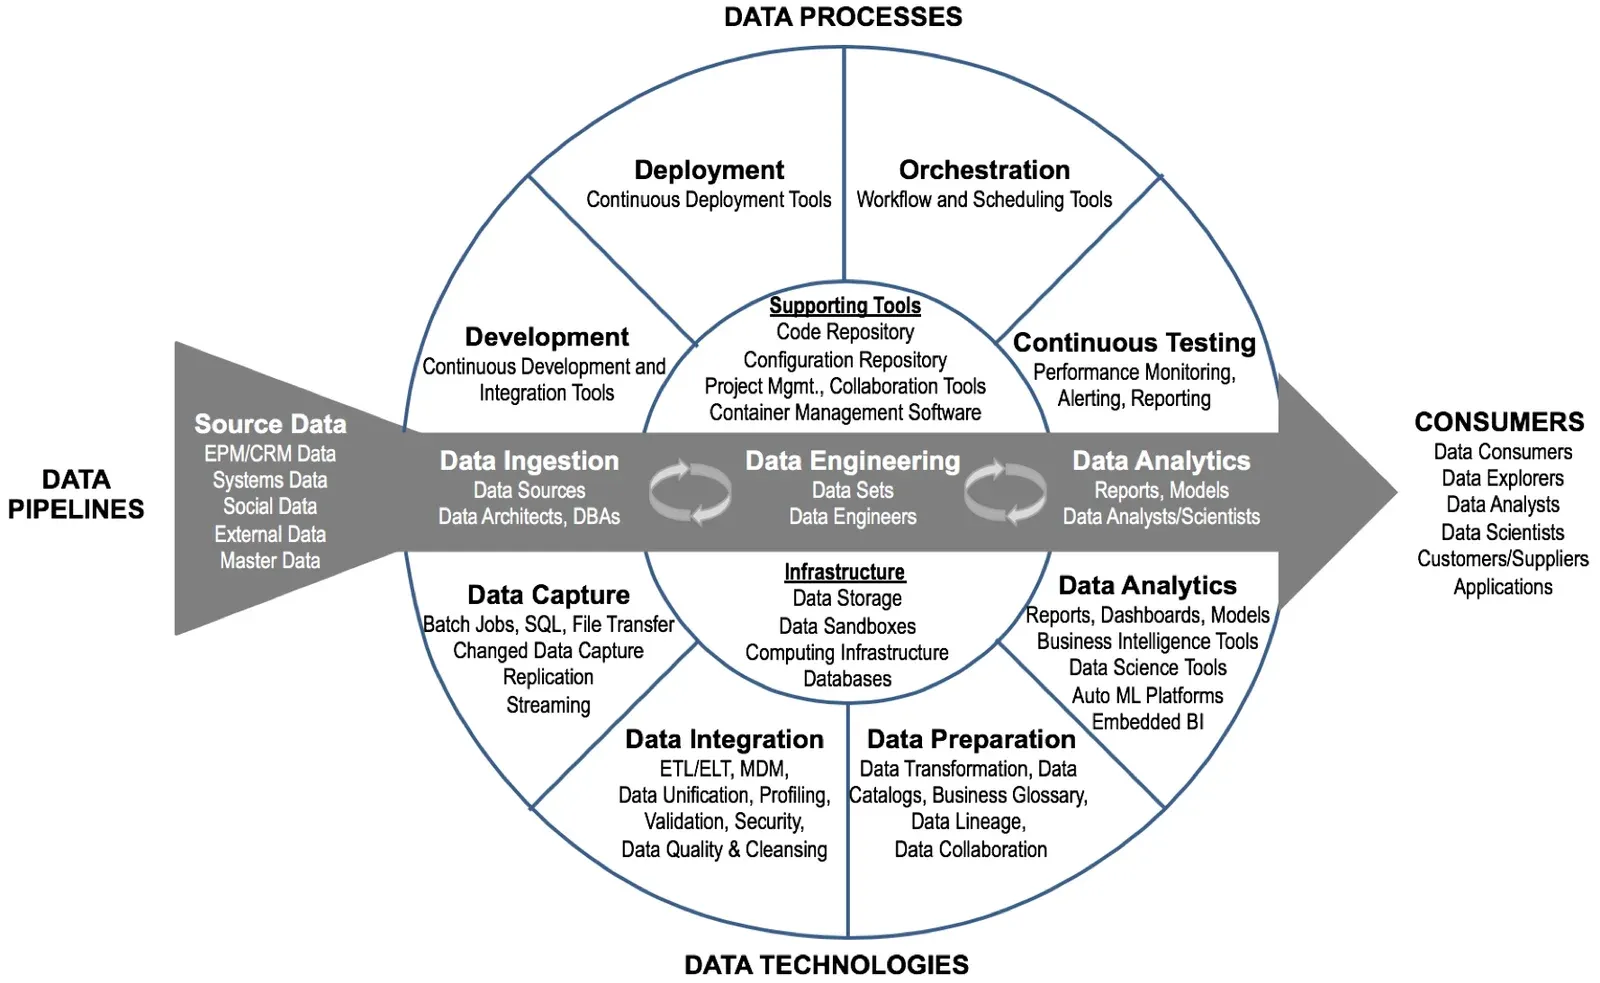
Figure 3. DataOps Technical Framework. Source: Wayne Eckerson, Best Practices in DataOps, Eckerson Group, June 2019.
The same figure as text. The arrow across the middle of the diagram, from data sources to data consumers:
| Stage | What sits there |
|---|---|
| Source Data | EPM/CRM data, systems data, social data, external data, master data |
| Data Ingestion | Data sources; data architects, DBAs |
| Data Engineering | Data sets; data engineers |
| Data Analytics | Reports, models; data analysts and scientists |
| Consumers | Data consumers, data explorers, data analysts, data scientists, customers and suppliers, applications |
The eight segments of the ring, plus the two groups at the centre:
| Segment | Technologies |
|---|---|
| Development | Continuous development and integration tools |
| Deployment | Continuous deployment tools |
| Orchestration | Workflow and scheduling tools |
| Continuous Testing | Performance monitoring, alerting, reporting |
| Data Analytics | Reports, dashboards, models; business intelligence tools; data science tools; auto ML platforms; embedded BI |
| Data Preparation | Data transformation, data catalogs, business glossary, data lineage, data collaboration |
| Data Integration | ETL/ELT, MDM, data unification, profiling, validation, security, data quality and cleansing |
| Data Capture | Batch jobs, SQL, file transfer; changed data capture; replication; streaming |
| Supporting Tools (centre) | Code repository, configuration repository, project management and collaboration tools, container management software |
| Infrastructure (centre) | Data storage, data sandboxes, computing infrastructure, databases |
Case-driven solutions. Some DataOps tools are geared to specific use cases. For instance, data warehouse automation tools are geared to creating small data warehouses and data marts. AIOps tools focus on data science implementations, and CloudOps tools help organizations migrate from on-premises to cloud platforms or support hybrid and multi-cloud environments.
Specialized DataOps solutions. DataOps startups, such as Infoworks, now offer end-to-end solutions for creating, operationalizing, and managing complex data pipelines that span both on-premises and cloud platforms. In contrast, DataKitchen, another DataOps startup, takes a best-of-breed approach, orchestrating the flow of data through existing systems rather than providing an all-in-one solution. Another DataOps vendor, StreamSets, provides a GUI-based tool that makes it easy for data scientists and data engineers to leverage codeless design and manage batch and streaming data pipelines running on-premises, in the cloud, or in edge environments, while adhering to data privacy policies.
Component solutions. Other DataOps tools focus on a single component of the data lifecycle. For instance, Unravel offers a performance management and monitoring tool (see below) geared explicitly to DataOps. It uses machine learning to automatically troubleshoot performance issues afflicting business applications and automatically recommends or executes fixes to comply with SLAs.
Horizontal tools. The bulk of DataOps tools, however, are horizontal in nature and are borrowed directly from the DevOps world. Together, they create a development platform that unites all contributors, fostering reuse and collaboration. The most common categories of DataOps tools are the following:
- Data preparation tools enable data engineers to build data pipelines to query, clean, transform, and enrich data to support a specific analytic solution.
- A code repository provides one place for data engineers to store their code, such as Spark or ETL code. Most code repositories, such as GitHub, offer check in/out and version control and integrate with most types of development tools on this list.
- A configuration repository that stores configurations and settings for all systems in the data environment, spanning development, test, and production systems. A configuration repository manages software releases and ensures error-free deployments.
- Agile project management tools, such as Jira, enable agile teams to plan, track, and report on their activities and collaborate around user stories.
- Continuous integration tools, such as Jenkins and TeamCity, automatically branch and merge code from multiple developers to support large team-based development environments.
- Continuous delivery tools deploy finished code to production environments in a secure, error-free manner. Most continuous integration tools now support continuous delivery and vice versa.
- Automated testing software supports test-first development methods, helping developers create and run tests in all phases of the data lifecycle, including production environments, and manage the results, alerting users when failures occur.
- Orchestration software, such as AirFlow, coordinates the execution of jobs throughout a data pipeline to automate the flow of data.
- Performance management tools monitor underlying systems and pinpoint the cause of performance issues and outages affecting business applications. The tools notify administrators of issues and recommend actions to ensure compliance with SLAs.
- Data catalogs create a marketplace of data assets, making it easy for data analysts, data engineers, and data scientists to find and profile relevant data assets prior to creating new data pipelines or data sets.
- Business glossary is a data dictionary that contains business descriptions of data entities and attributes. Data glossaries make it easy for business users to discover data definitions, data owners, and data lineage, building greater trust in the data.
- Containers virtualize the minimum code required to run a service, making it easy for software engineers to build applications from component parts without worrying about underlying hardware and software configurations, making applications portable. Containers are often used to embed predictive models in operational applications
The heart of DataOps applies the listed tools in a governed environment to support large-scale development in complex, distributed computing environments. Organizations should allocate plenty of training hours to get team members up to speed on the tools as well as the processes governing their use.
9. Apply Quality Checks
It’s one thing to speed up delivery, it’s another to maintain quality. As Atwal says, “A car needs brakes to go fast.” In the world of DataOps, tests are the brakes that developers create when building code. Those tests are applied not just in unit and integration tests during the development phase, but also during production to ensure that data drift hasn’t altered the accuracy of analytic output, and that changes to software configurations and data schema don’t break production jobs.
Tests are the bedrock of automation. Without tests, automation is a runaway freight train that inevitably crashes. With tests, data teams can sleep well at night knowing they have built all the safeguards necessary to keep the train on the track. And if the train starts to deviate, they are proactively notified and can take action before business users experience problems.
“Test automation is a huge part of what we do,” says Intel’s Martinez. “Without it, we can’t maintain a high level of quality at the scale and speed with which we operate. We have more than 1,000 tests in our test automation framework, and we keep adding tests all the time. We continually measure our progress over time, both individually and as a group. We are only as good as our test practices, and we strive to improve here.”
Developer tests are supplemented by performance management tools (see above) that monitor system performance and its effect on business applications and users. These systems-level tests enable administrators to optimize performance and ensure compliance with SLAs. For example, a performance management tool will identify “noisy neighbors” on a cluster and detect long-running queries and improperly configured virtual machines.
10. Create an Enterprise Data Platform
DataOps requires a robust, enterprise data platform to succeed. The platform should serve the enterprise, not an individual department or line of business. An enterprise data platform makes it easier to build reusable components and automate data pipelines. It also simplifies governance, security, lineage, auditing, and monitoring because everything runs in one place.
Portability. Ideally, the platform abstracts underlying components, enabling data administrators to swap pieces of the infrastructure or change providers without affecting business applications. This is required for hybrid and multi-cloud strategies where data pipelines span multiple data platforms from different vendors.
Security. DataOps practitioners emphasize the need for an enterprise data platform that simplifies data access while securing data from unauthorized use. Users should be given access to different points of the data environment based on their roles and skill sets. (See my 2016 report titled “A Reference Architecture for Self-Service Analytics: Balancing Agility and Governance.”) The infrastructure should automatically detect and mask sensitive data, such as social security numbers.
Centralized logic. A data infrastructure should also centralize business logic used in multiple applications. This removes the temptation for individual developers to embed custom logic into their own reports and data preparation jobs. Business logic can be many things: calculations for core metrics, such as net sales; statistical models for key measures, such as customer attrition; definitions of key business entities, such as “active” and “lost” customers; master data that uniquely defines each product, customer, supplier, and partner; and reference data that defines things like corporate hierarchies, regions, and currency conversions.
“We persist business logic in our data marts so when our BI developers write reports, they don’t have to recreate that logic which otherwise would vary from report to report,” says Akhter of Northwestern Medicine. Royster of Celegne agrees. His teams select the best layer in the architecture for each type of business logic. Sometimes it goes in the data model, other times in the data integration code, and occasionally in a report, especially when it’s a local calculation that isn’t shared widely. The company also uses a DataOps tool to track and automatically propagate rule changes to dozens of dashboards that use various rules.
Data catalogs. Many companies use a data catalog to store business logic, including data pipelines, queries, metric calculations, reports, and workflows. This makes it easy for data developers to find and reuse logic instead of starting from scratch, which would lead to a proliferation of data silos and conflicting data. A data catalog is fast becoming a required component in a modern data architecture because it can be used to consolidate and curate business logic for analytic applications.
Self-service. Data scientists also benefit from a data platform that centralizes logic and abstracts the underlying complexity of data. Rather than rely on data engineers to fetch data for them, data scientists should be able to build their own data pipelines, according to Jeff Magnusson, vice president of data platform at Stitch Fix. They should also be able to deploy predictive models without engineering assistance. The only way to accomplish this is to create a robust data platform that simplifies these tasks.
“I’d rather focus good, strong engineers on building tools and abstractions to make ETL, data movement, and data science easier versus having those folks engineering each specific data pipeline that needs to get developed. And so, by creating those tools, that in turn empowers data scientists to take full ownership of their pipelines from data acquisition to production, and then they can control their iteration cycles, and that often increases velocity.”
An enterprise data infrastructure with centralized rules and permissions makes it possible to support self-service without creating data silos and spreadmarts. A good data infrastructure builds governance into the fabric of the data environment, balancing governance and self-service, agility and architecture, and speed and standards.
Buy, don’t build. Rather than build a data platform for internal use like Stitch Fix, Atwal from MoneySuperMarket prefers to buy it from a dedicated platform vendor. “It’s silly to build your own data platform today,” he says, especially when vendors specialize in building scalable, elastic, open, and services-oriented data platforms. MoneySuperMarket selected Google as its analytics cloud provider and Domino Data Lab as its data science platform. “We just bring our data and code; there is nothing for us to manage. We run everything on the same platform, which makes it easy to govern.”
Bonus: Continuously Improve
DataOps is a journey. The goal is to create a culture of continuous improvement where every team member works to identify and eliminate waste, maximize reuse and automation, and accelerate cycle times to deliver greater value to the business. “We are on a journey of continuous innovation,” says Intel’s Martinez. “We focus on business outcomes and continually experiment with new approaches to optimize data operations.”
To make progress, it’s important to periodically stop and review what you’ve done. Scrum teams finish each sprint with a half-day “retrospective” where the team reviews what went well, what didn’t, and how it can improve. Intel goes a step further and dedicates every third or fourth sprint to examining ways it can improve data operations. The team learns and applies new techniques so that it might work faster and more efficiently.
Stopping midstream to review and reflect when there are so many pressing business requirements to deliver takes courage and vision. But Intel’s commitment to continuous improvement and buy-in from top executives makes this possible. The results are impressive: Intel has doubled development capacity and tripled its output without adding new people or overhead.
Conclusion
As data pipelines become more complex and development teams grow, organizations need to apply standard processes to govern the flow of data from source to consumption. The goal is to improve agility and cycle times while reducing data defects, giving business users greater confidence in data and analytic output. This is the vision of DataOps.
Most people associate DataOps with either agile principles or team-based development tools. But it’s much more than that. DataOps is a full-throated strategy for maximizing the business value of data. New development tools and processes won’t deliver much value unless they are backed by enlightened leadership that recognizes the power of data to transform organizations and fuel new data-centric strategies, such as digitalization, Customer 360, artificial intelligence, and the Internet of things.
Strong leaders build new organizations to match their vision. DataOps requires a dedicated data organization that spans all data-related activity: data warehousing, data lakes, data science, and self-service analytics. Finally, DataOps requires a data-driven culture that validates decisions with facts and seeks to continuously improve the processes by which it delivers data to business users.
About Eckerson Group
Wayne Eckerson, a globally known author, speaker, and advisor, formed Eckerson Group to provide data-driven leaders like you a cocoon of support during every step of your journey toward data analytics excellence.
Today, Eckerson Group has three main divisions:
- Eckerson Research publishes insights so you and your team can stay abreast of the latest tools, techniques, and technologies in the field.
- Eckerson Consulting provides strategy, design, and implementation assistance to meet your organization’s current and future needs.
- Eckerson Education keeps your data analytics team current on the latest developments in the field through three- and six-hour workshops and public seminars.
Unlike other firms, Eckerson Group focuses solely on data analytics. Our veteran practitioners each have more than 25 years of experience in the field. They specialize in every facet of data analytics—from data architecture and data governance to business intelligence and artificial intelligence. Their primary mission is to share their hard-won lessons with you.
Our clients say we are hard-working, insightful, and humble. We take the compliment! It all stems from our love of data and desire to serve—we see ourselves as a family of continuous learners, interpreting the world of data for you and others.
Accelerate your data journey. Put an expert on your side. Learn what Eckerson Group can do for you!
About DataKitchen
Automatically deliver and operate all your analytic data pipelines — simply, collaboratively, and at enterprise scale — with DataKitchen’s DataOps Platform.
DataKitchen provides the world’s first DataOps platform for data-driven enterprises, enabling them to support data analytics that can be quickly and robustly adapted to meet evolving requirements utilizing their existing tools. DataKitchen is leading the DataOps movement to incorporate Agile Development, DevOps, and manufacturing based statistical process control into analytics and data management. DataKitchen is headquartered in Cambridge, Massachusetts. Learn more at www.datakitchen.io
NOTE
End of Eckerson Group’s report. One naming pointer on the sponsor blurb above, which is ours and not Eckerson’s: the “DataOps Platform” it names is today DataOps Automation, and its Kitchens work the same way they did in 2019. Two products joined it since: DataOps TestGen and DataOps Observability.
FAQ
What are the key points in this blog?
This page carries the full text of Eckerson Group’s June 2019 report Best Practices in DataOps, written by Wayne Eckerson and sponsored by DataKitchen, Infoworks, Unravel, and StreamSets. The report recommends ten steps to DataOps success, drawn from interviews with practitioners at Intel, Northwestern Medicine, MoneySuperMarket, Celgene, and Stitch Fix. DataKitchen’s own commentary sits above it, separately headed.
Who wrote Best Practices in DataOps, and who sponsored it?
Wayne Eckerson, founder and principal consultant of Eckerson Group, wrote the report and published it in June 2019. Four vendors sponsored it: DataKitchen, Infoworks, Unravel, and StreamSets. Eckerson Group holds the copyright, and the report states that those four sponsors have exclusive permission to syndicate its content.
Why is the whole report on a DataKitchen page?
Because the report grants it. Its second page states that DataKitchen, Infoworks, Unravel, and StreamSets have exclusive permission to syndicate its content, and DataKitchen is one of the four. Eckerson Group remains the author and copyright holder, its notice is reproduced with the text, and nothing in the report has been rewritten.
What are the ten steps to DataOps success in the Eckerson report?
Assess your data environment, start small, create a data operations department, align with the organization, educate your team, create cross-functional teams, build for reuse and automation, implement data development tools, apply quality checks, and create an enterprise data platform. A bonus eleventh practice is to continuously improve.
What does the Eckerson report say about testing?
Testing is the ninth recommendation, and the report treats it as the precondition for automation rather than a development phase. Its line is that tests are the bedrock of automation and that without them automation is a runaway freight train that inevitably crashes. Tests run in production too, to catch data drift and schema changes.
Which of the report’s recommendations does DataKitchen disagree with?
The tenth, create an enterprise data platform. Consolidating onto one platform is a multi-year program, and the report itself notes that DataKitchen orchestrates data through a team’s existing systems instead of replacing them. Waiting for a single platform postpones the tests and the orchestration that produce the gains in the other nine steps.
Does the Eckerson report contain the 2019 DataOps survey numbers?
No. The report is interview-based and carries no survey tables. The figures often attributed to it, including 30% of teams reporting more than 11 data errors a month, come from the joint DataKitchen and Eckerson survey of 300 data professionals published separately in 2019 as Key Findings of the 2019 DataOps Survey.