TL;DR: A star schema organizes analytics data into one central fact table and several dimension tables connected by keys. It saves storage, supports Master Data Management, maps cleanly to every major BI tool, and uses business language instead of technical abbreviations. In 2026 there is a fourth reason to care: AI agents querying your data through text-to-SQL get dramatically more accurate results when the schema is a star. Simpler structure plus business-language naming equals fewer wrong answers from the AI.
When analyzing data, people talk about a star schema. This post answers two questions: what is a star schema, and why do you need one? In 2026 there is a third question worth answering: why do AI agents work better when your data lives in a star schema?
Background and Context
Data typically lives in database tables that have relationships with each other. A schema is a group of related tables in a database. Schemas fall into two categories: operational and reporting.
The operational schema stores data as it is being collected and updated. Take a point-of-sale application at a pharmacy. The pharmacy records and updates customer and physician records. The point-of-sale system creates transaction records as prescriptions are filled. That operational schema optimizes for inserts and updates. The data in it is geared for machines, not people, and it does not support analysis well.
For Business Intelligence (BI) and analytics, you use a reporting schema optimized for reads and aggregations. The database engine itself can be tuned for this (Amazon Redshift, Snowflake, Databricks SQL, and BigQuery are all built for it), but the schema design matters just as much as the engine. One of the most popular ways to organize a reporting schema is with a star schema.
The Star Schema
Star schemas organize data into fact and dimension tables. Using pharmaceutical sales as an example:
- Facts are measurable data about the event, such as quantity and price.
- Dimensions are the actors or attributes related to the sale: Product, Patient, Prescriber (doctor), Payer (insurance company), Period (date).
The dimension tables typically contain far fewer records than the fact table. The two connect through record identifiers. The resulting diagram looks like a star with the fact table at the center and dimension tables radiating out, which is where the name comes from.
Here is the SQL to create a simple version of this schema in a modern cloud warehouse:
CREATE TABLE fact_sales (
  sale_id        INTEGER NOT NULL,
  product_id     INTEGER NOT NULL,
  patient_id     INTEGER NOT NULL,
  prescriber_id  INTEGER NOT NULL,
  payer_id       INTEGER NOT NULL,
  period_id      INTEGER NOT NULL,
  quantity       INTEGER NOT NULL,
  price          DECIMAL(10,2) NOT NULL
);

CREATE TABLE dim_product (
  product_id   INTEGER NOT NULL,
  product_name VARCHAR(100),
  drug_class   VARCHAR(50),
  ndc_code     CHAR(11)
);

CREATE TABLE dim_patient (
  patient_id    INTEGER NOT NULL,
  date_of_birth DATE,
  zip_code      CHAR(5),
  gender        CHAR(1)
);

CREATE TABLE dim_prescriber (
  prescriber_id  INTEGER NOT NULL,
  first_name     VARCHAR(50),
  last_name      VARCHAR(50),
  npi            CHAR(10),
  specialty      VARCHAR(100)
);

CREATE TABLE dim_payer (
  payer_id   INTEGER NOT NULL,
  payer_name VARCHAR(100),
  payer_type VARCHAR(50)
);

CREATE TABLE dim_period (
  period_id    INTEGER NOT NULL,
  full_date    DATE,
  month_number INTEGER,
  quarter      INTEGER,
  year         INTEGER
);
Why Do You Need a Star Schema?
You could store everything in a single flat table where all the attributes repeat on every row, the way a raw export for an Excel pivot table works. That approach consumes far more space and makes managing dimension data much harder.
Master Data Management is the discipline of keeping dimension data accurate, such as ensuring a prescriber’s NPI number is correct and that name variations (“Smith, John” vs. “John Smith”) resolve to the same record. A star schema supports that discipline by centralizing each dimension in one place. When you need to correct a prescriber record, you correct it once.
Visualization tools map naturally to the star schema structure. Whether you use Tableau, Power BI, Looker, or any modern BI platform, these tools expect a fact table with dimension lookups. Connecting them to a well-designed star schema takes minutes. Connecting them to a tangled operational schema takes weeks.
Business language matches the schema structure. Your analysts speak about patients, prescribers, products, and time periods. A star schema names its tables and columns in that same language, not in the cryptic abbreviations that operational systems accumulate over years.
AI Agents Understand a Star Schema
Here is the reason star schemas matter more in 2026 than they did in 2017 when I first wrote this post: AI agents query your data through text-to-SQL, and they perform dramatically better on a star schema than on a complex operational database.
The MIT BEAVER study (2024) demonstrated this in a way that should make every data team uncomfortable. LLMs that scored above 85% accuracy on standard SQL benchmarks collapsed to near-zero accuracy on real enterprise databases, not because the models got dumber, but because real schemas are too complex to navigate. The models had no reliable way to identify which of 150 tables to join, which join path was correct, or what a cryptic column name like TX_PROC_CD_4 actually means.
A star schema eliminates most of that complexity by design. When an AI agent looks at a star schema for pharmaceutical sales, it sees seven tables with names like fact_sales, dim_prescriber, and dim_product. It sees column names like npi, specialty, and drug_class that map directly to the business question a user might ask. The join paths are unambiguous: every dimension connects to the fact table through a single key. That structure matches the way humans and AI alike parse a question like “show me quarterly sales by drug class for each prescriber specialty.”
Put another way, a star schema speaks business language. AI agents are trained on business language. When your schema speaks the same language as your users and your AI agents, all three get the right answer.
Data quality matters here too. An AI agent reading a well-structured star schema still fails if the underlying data has untested nulls in the prescriber dimension, duplicates in the product table, or stale records in the period dimension. Schema design and data quality are not separate problems. They are the same problem. A star schema gives you the structure to test each dimension independently and catch quality failures before they reach the fact table and corrupt your analysis.
Star Schema Gallery
Below are several ways to look at a star schema in practice.
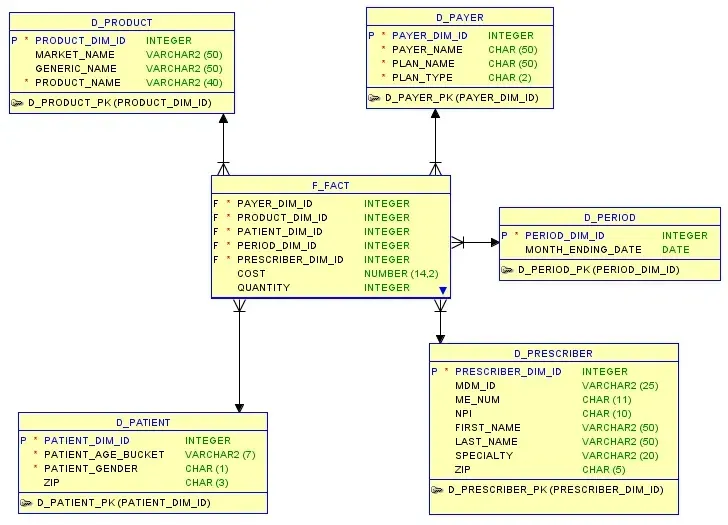
Entity Relationship (ER) diagram in a data modeling tool:
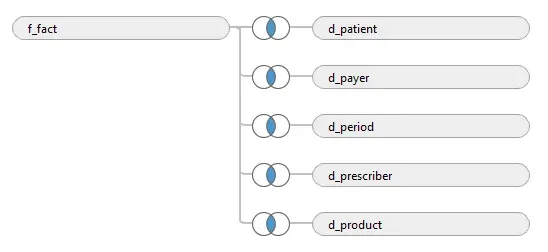
Defining the data source in Tableau:
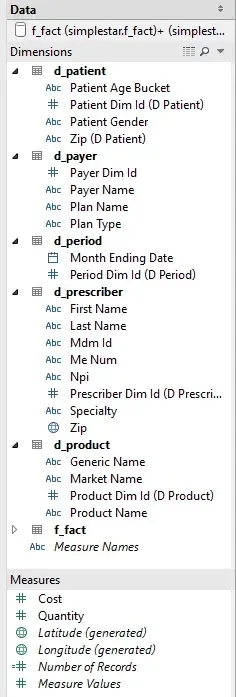
Selecting measures and dimensions in Tableau’s visualization UI:
Summary
A star schema organizes your reporting data into one central fact table and several dimension tables connected by keys. It saves space, supports Master Data Management, maps cleanly to BI tools, and uses business language in its naming. In 2026, add one more reason to the list: a well-designed star schema makes your AI-driven data analysis more accurate, because AI agents navigate simple, business-language schemas far better than complex operational ones. The organization of your data determines the quality of every answer your team gets, whether that answer comes from a human analyst or an AI agent.