The Ultimate Guide to DataOps is a 20-page analyst report by Wayne W. Eckerson, founder and principal consultant of Eckerson Group, dated October 2019, with the research sponsored by DataKitchen. It argues that building data pipelines should stop being an artisanal craft and become an industrial process, sets out what technology that takes, sorts the DataOps products then on the market into five categories, and closes with 18 criteria for evaluating one.
Eckerson Group wrote the report and holds the copyright. We paid for the research and we distribute the PDF free of charge, which is a different thing from owning the words. So what follows is our summary and our commentary, not a reprint.
TIP
Read the full report: The Ultimate Guide to DataOps (PDF, 20 pages, no form). More of the firm’s research is at Eckerson Group.
What the guide covers
The report moves in five steps. Why a data team should adopt DataOps at all. What a data pipeline is, and the four kinds of work that run through one: big data, data science, self-service analytics, and data warehousing. Why tests are what make speed safe. What technology a DataOps practice needs, split between the processes that manage pipeline development and the components that act on the data itself. And then how to tell one product from another.
The idea from the middle of it that has aged best is the report’s own conclusion: DataOps is not the tools. What you are building is a culture of continuous improvement, which is to say find the bottleneck, attack it, repeat.
The number the report is built on
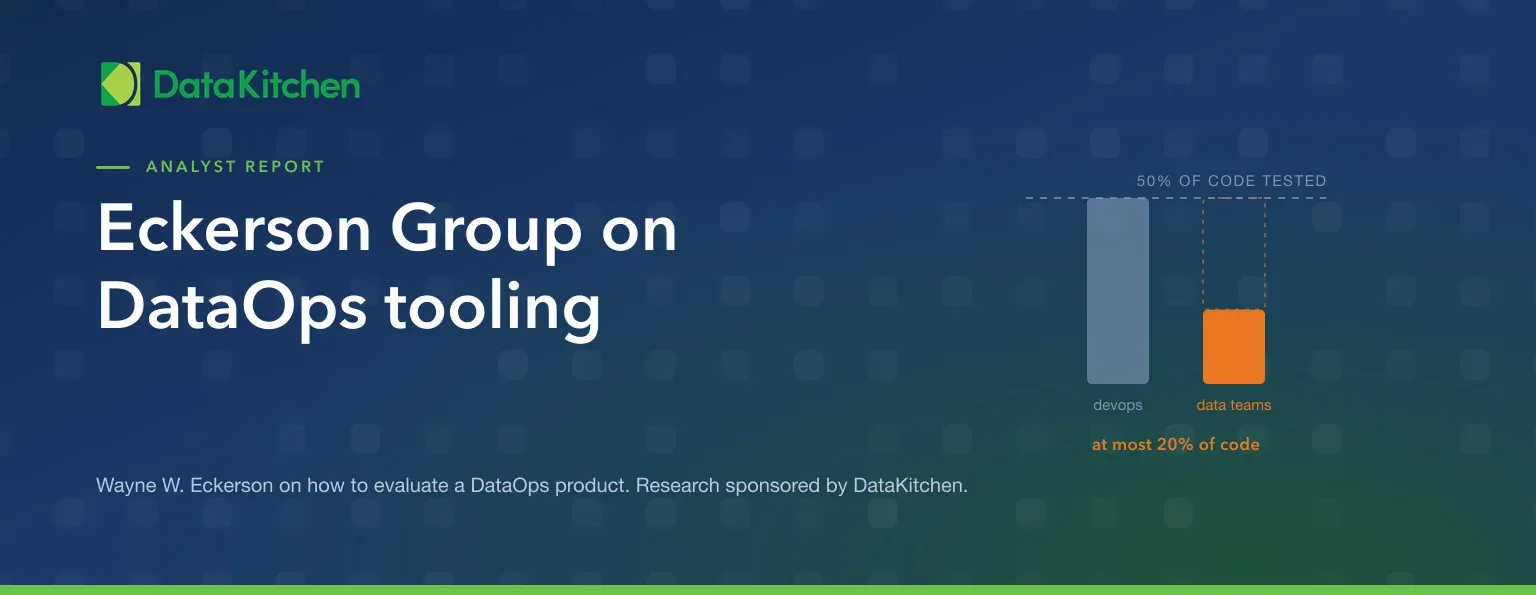
Eckerson’s comparison between software teams and data teams is the claim the rest of the guide rests on, and the vintage belongs in the sentence. In his 2019 reading, DevOps teams devoted 50 percent of their code to tests and 50 percent of their staff to quality, security, and deployment. Data analytics teams devoted at most 20 percent of their code to testing and staffed one or two QA engineers, who tested during development and rarely once anything reached production.
His recommendation followed: put 50 percent of your code and staff behind testing, quality, and development velocity. The reason that is not overhead is the line he took from Harvinder Atwal, then head of data strategy and advanced analytics at MoneySuperMarket:
A car needs brakes to go fast.
His worked example is Intel, where Greg Martinez, then enterprise analytics engineer manager, described a test automation framework holding more than 1,000 tests that the team kept adding to and measured itself against, across 30 development teams pulling from more than 150 sources.
Two pipelines, and what each one tests
The distinction we still use in our own guide to DataOps tests is stated cleanly here. A development pipeline builds code; an execution pipeline runs it in production. In development the data is fixed and the code varies, so the tests test the code. In production the code is fixed and the data varies, so the tests test the data. Both need them, and the same team should own both: a team that can change code without owning the downstream consequences will keep breaking things downstream.
Eckerson names three kinds of test in a pipeline: data input tests that stop bad data entering a stage, business logic tests that check data against what the business believes about it, and data output tests that confirm a stage did what it was supposed to. The figure laying those out is credited in the report to a DataKitchen post from September 2018, which tells you how long this argument has been running.
Five categories of DataOps product
The market section is where a 2019 report shows its age most, and it still names the shape of a decision buyers face. Eckerson’s five categories:
- All-in-one tools: one environment for building, testing, running, and monitoring pipelines. His caution was that few products covered everything they claimed to.
- Orchestration tools: a DataOps layer over the stack a team already owns, adding continuous testing and monitoring without replacing what is underneath. This is the category the report puts DataKitchen in.
- Component tools: one product per job. The report cites a DataKitchen article tracking 62 of them across 10 categories.
- Case-specific tools: aimed at one domain, such as data science workflow or data warehouse automation.
- Open source tools: the CI, repository, and orchestration projects most of this was assembled from anyway.
What the evaluation criteria are, and what they are not
The guide ends with 18 numbered evaluation criteria. Each names a single capability and defines it in one sentence: what a product has to do to claim it. They are scoped to all-in-one DataOps platforms rather than point tools, and they span the whole job, from how much of the pipeline a product touches, through what it tests, controls, and records, to how far it travels between environments. Instrumented, Traceable, and Portable are three of the eighteen, which gives you the flavor of the vocabulary.
That list is the commercial core of Eckerson Group’s report, and it is theirs. We are not reprinting it as a checklist here, because a checklist is the thing you would otherwise have to buy their research to get. Download the report and it is on page 17.
What we will say is how to use one. A criteria list is a way of writing down what you decided to care about before a vendor tells you what to care about. Its value comes from being fixed in advance, scored the same way for every product, and short enough that you actually apply it. Eighteen items is about the upper limit of what a team will really score.
What we would change seven years on
We paid for this research and we still hand it to people, so the honest version includes what has moved.
The all-in-one suite lost
The criteria were written to evaluate one product that did everything, and Eckerson was already skeptical any of them did. Most teams now assemble a stack, so the question is no longer “does this cover all 18” but “what is this for, and does it play well with the ten tools I am keeping.”
Testing became measurable
In 2019 the recommendation was to test more. The useful question now is how much of your data is actually asserted on, and that is a number you can produce: tests per column and per table, tracked over time. That is what DataOps TestGen does, and it is open source, so the coverage argument no longer needs a purchase order.
Monitoring got wider
The report’s performance-management section is about systems: servers, engines, SLAs. What has broken teams since is not usually a slow server but a silent one: a job that ran, a table that arrived, and nothing that noticed the numbers were wrong. Watching the whole path from source to dashboard is what DataOps Observability is for.
Comparison shopping moved on-site
If you are running this evaluation now, our comparison pages hold head-to-head capability matrices against the current field, plus roundups of modern data quality tools, traditional data quality tools, and data governance tools. Those are our reading of the market, and they are meant to be argued with.
Where to read it
The PDF is ungated: The Ultimate Guide to DataOps, by Wayne W. Eckerson, Eckerson Group. The copy we distribute carries an October 2019 date, a few months after this post first went up. It cites a companion study, Best Practices in DataOps from June 2019, and the same firm’s survey of DataOps adoption is covered in Trends in DataOps. For the rest of their work, go to Eckerson Group.
NOTE
Eckerson Group holds the copyright in this report and asks that it not be reproduced or distributed without their permission. DataKitchen sponsored the research and distributes the PDF as its sponsor. The summary and the commentary above are ours; the findings, the framework, and the evaluation criteria are Wayne Eckerson’s.
FAQ
What are the key points in this blog?
The Ultimate Guide to DataOps is an analyst report by Wayne W. Eckerson of Eckerson Group, dated October 2019, with research sponsored by DataKitchen. It argues that data teams should industrialize how they build pipelines, and it makes testing the mechanism: Eckerson found DevOps teams put 50 percent of their code into tests while data teams put in at most 20 percent. It sorts the market into five product categories and ends with 18 criteria for evaluating a DataOps product.
Who wrote The Ultimate Guide to DataOps?
Wayne W. Eckerson, founder and principal consultant of Eckerson Group, wrote it. DataKitchen sponsored the research and distributes the PDF, which is why the report carries our name on the cover, but the analysis and the copyright are Eckerson Group’s. Eckerson has covered data and analytics since the early 1990s and has written two books on performance dashboards and analytics.
What does the Eckerson guide say about testing?
That testing is the whole point. Eckerson reported DevOps teams devote 50 percent of their code to tests and 50 percent of their staff to quality, security, and deployment, while data analytics teams devote at most 20 percent of code and employ one or two QA engineers who rarely test after deployment. His recommendation was to close that gap and to test in production as well as in development.
What are the five categories of DataOps tools?
Eckerson named all-in-one tools that bundle everything into one environment, orchestration tools that add DataOps process on top of the data stack a team already runs, component tools that each do one job, case-specific tools aimed at one domain such as data science or data warehouse automation, and open source tools. He placed DataKitchen in the orchestration category.
What evaluation criteria does the report use?
Eighteen of them, numbered, each naming one capability and defining it in a single sentence: what a product must do to claim it. They are scoped to all-in-one DataOps platforms rather than to point tools, and they run from how much of the pipeline a product covers through what it tests and controls to how far it travels between clouds. The criteria are Eckerson Group’s intellectual property and are printed in their report.
Is a 2019 DataOps report still worth reading?
The argument holds up better than the product taxonomy. Eckerson’s case for continuous testing and for separating development pipelines from execution pipelines is what most data teams are still working through in 2026. The vendor examples are dated, several have been acquired, and the all-in-one suite he evaluated has largely given way to teams assembling a stack from parts.