NOTE
First published on Medium in March 2017 and republished here in August 2026.
What could data analytics professionals possibly learn from car manufacturers? It turns out, a lot. Automotive giant Toyota pioneered a set of methods, later folded into a discipline called lean manufacturing, in which employees focus relentlessly on improving quality and reducing non-value-add activities. This culture enabled Toyota to grow into one of the world’s leading car companies. The Agile and DevOps methods that led to stellar improvements in coding velocity are really just an example of lean manufacturing principles applied to software development.
A pipeline is a factory floor
Conceptually, manufacturing is a pipeline process. Raw materials enter the manufacturing floor through the stock room, flow to different work stations as work-in-progress, and exit as finished goods. In data analytics, data progresses through a series of steps and exits in the form of reports, models and visualizations. Each step takes an input from the previous step, executes a complex procedure or set of instructions, and creates output for the subsequent step.
At an abstract level, the data analytics pipeline is analogous to a manufacturing process. Like manufacturing, data analytics executes a set of operations and attempts to produce a consistent output at a high level of quality. In addition to lean-manufacturing-inspired methods like Agile and DevOps, there is one more useful tool that can be taken from manufacturing and applied to data analytics process improvement.
Statistical process control
W. Edwards Deming championed statistical process control as a method to improve manufacturing quality. It uses real-time product or process measurements to monitor and control quality during manufacturing. If the process measurements are maintained within specific limits, then the manufacturing process is deemed to be functioning properly. When statistical process control is applied to the data analytics pipeline, it leads to remarkable improvements in efficiency and quality. For example, Google executes over one hundred million automated test scripts per day to validate any new code released by software developers. In the Google consumer surveys group, code is deployed to customers eight minutes after a software engineer finishes writing and testing it.
In data analytics, tests should verify that the results of each intermediate step in the production of analytics match expectations. Even very simple tests can be useful. A simple row-count test could catch an error in a join that inadvertently produces a Cartesian product. Tests can also detect unexpected trends in data, which might be flagged as warnings. Imagine that the number of customer transactions exceeds its historical average by 50 percent. Perhaps that is an anomaly which, upon investigation, would lead to insight about business seasonality.
Where the tests go
Tests in data analytics can be applied to data or models either at the input or the output of a phase in the analytics pipeline. Tests can also verify business logic.
Business logic tests validate assumptions about the data:
- Customer validation. Each customer should exist in a dimension table.
- Data validation. At least 90 percent of data should match entries in a dimension table.
Input tests check data prior to each stage in the analytics pipeline:
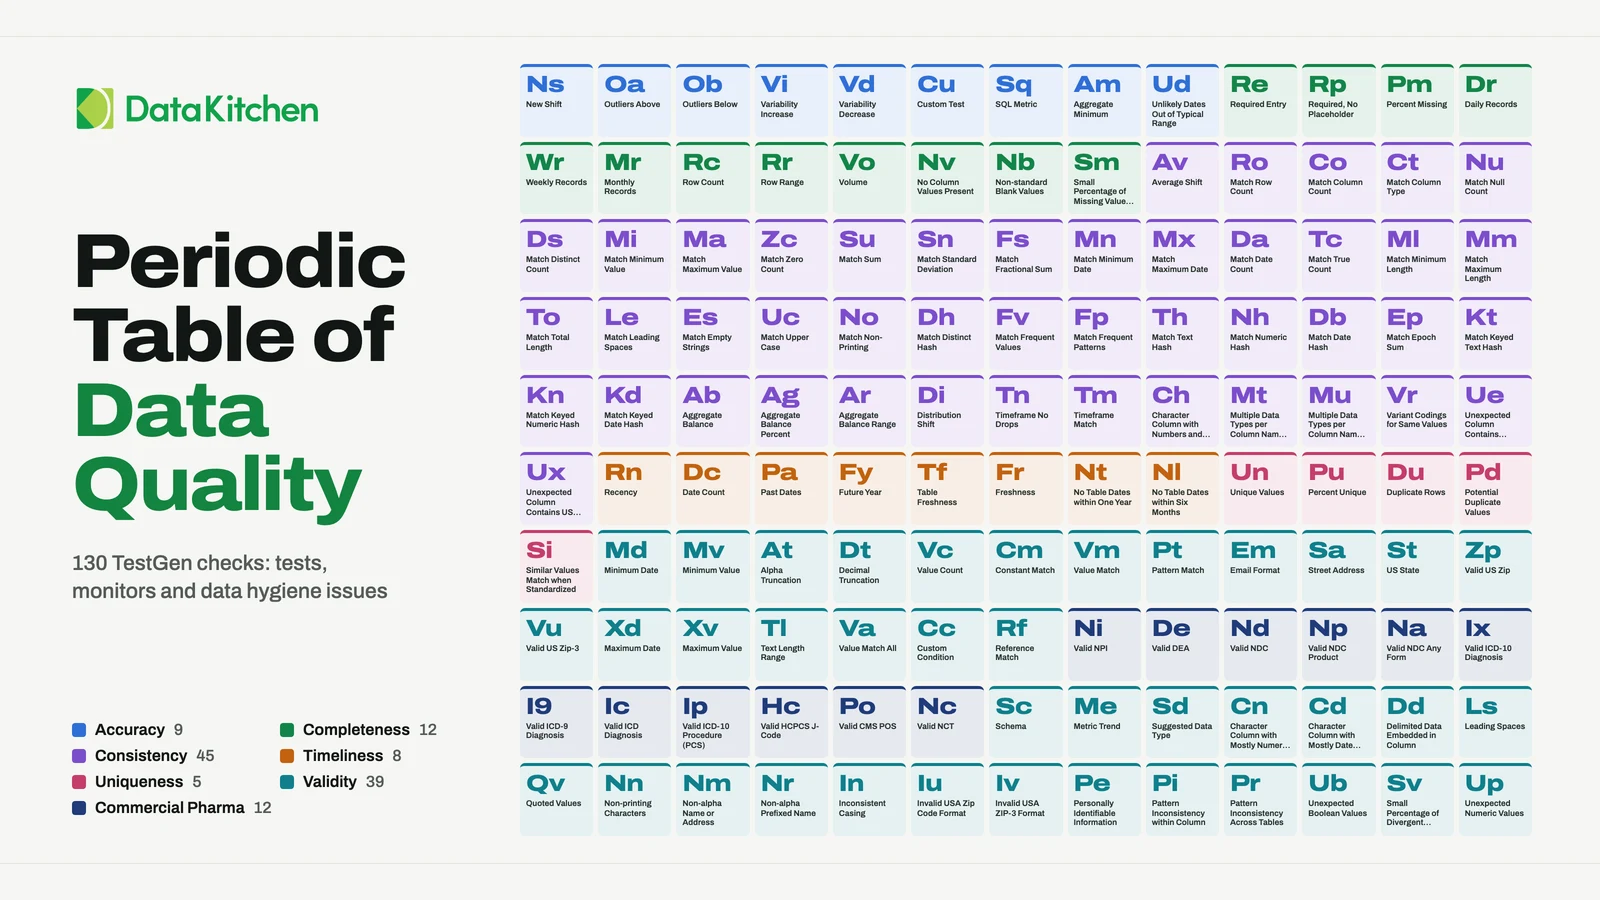
- Count verification. Check that row counts are in the right range.
- Conformity. US Zip5 codes are five digits, US phone numbers are 10 digits.
- History. The number of prospects always increases.
- Balance. Week over week, sales should not vary by more than 10 percent.
- Temporal consistency. Transaction dates are in the past, end dates are later than start dates.
- Application consistency. Body temperature is within a range around 98.6F/37C.
- Field validation. All required fields are present and correctly entered.
Output tests check the results of an operation, like a Cartesian join:
- Completeness. Number of customer prospects should increase with time.
- Range verification. Number of physicians in the US is less than 1.5 million.
Why it pays
The data analytics pipeline is a complex process with steps often too numerous to be monitored manually. Statistical process control allows the data analytics team to monitor the pipeline end to end from a big-picture perspective, confirming that everything is operating as expected. As an automated test suite grows and matures, the quality of the analytics is assured without adding cost. That is what makes it possible for the data analytics team to move quickly, enhancing analytics to address new challenges and queries, without sacrificing quality.
Adaptive and robust data analytics has its roots in lean manufacturing. At DataKitchen, we call this DataOps.
TIP
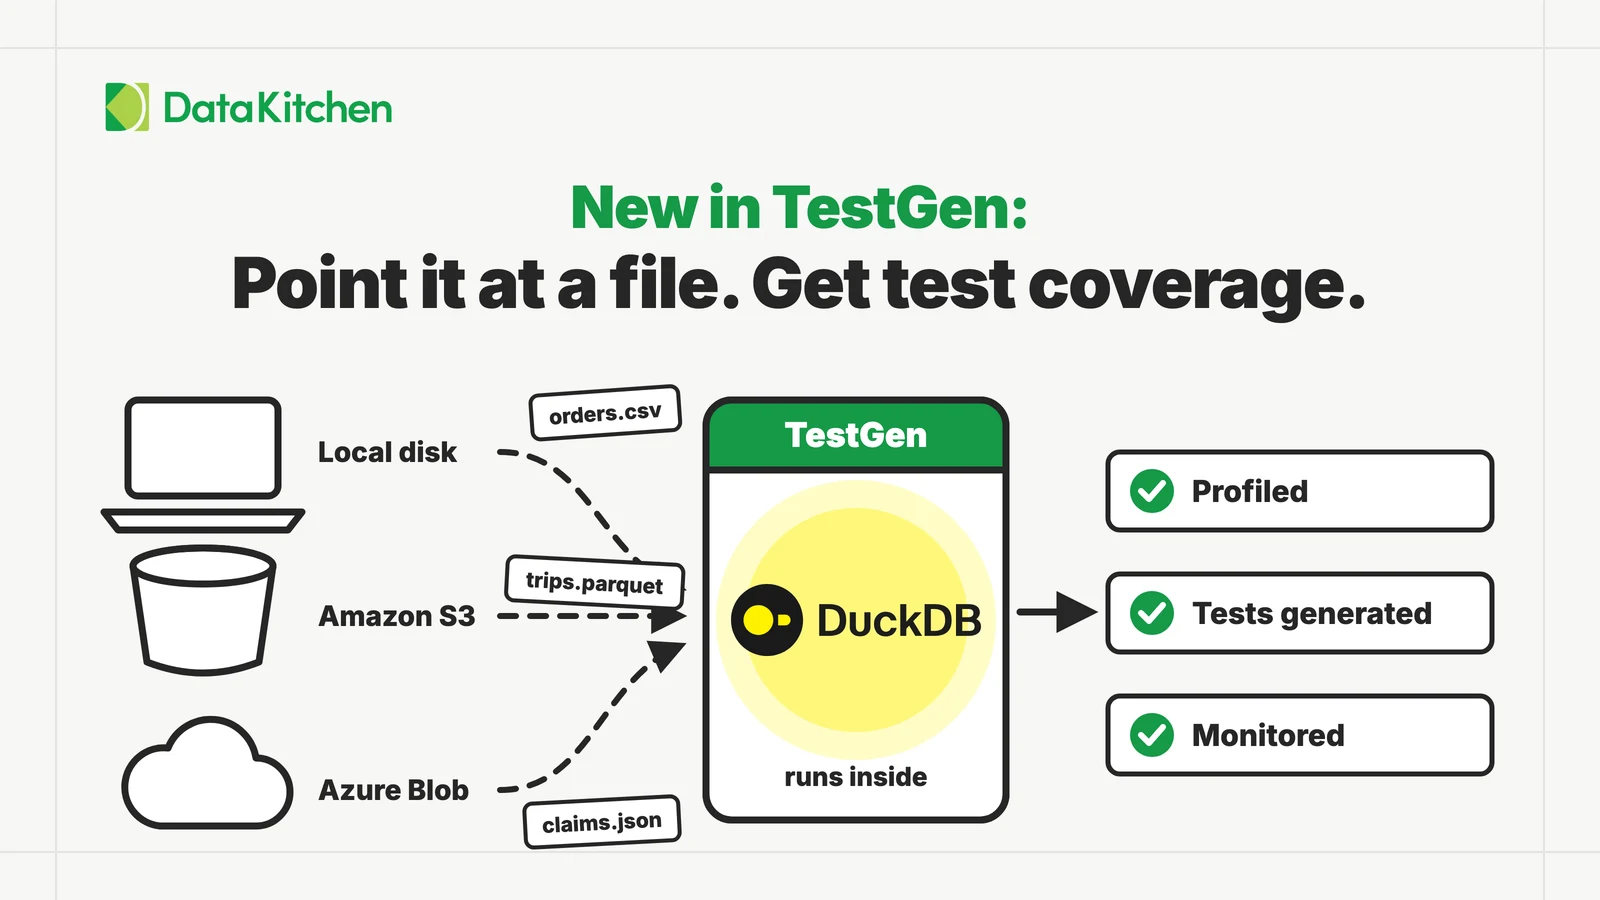
These tests do not have to be hand-written any more. Install open source TestGen and it generates them from your data’s own profile.