Every year, drug and device companies must report the money they give to doctors: meals, consulting fees, speaker honoraria, travel, royalties, grants. The Centers for Medicare & Medicaid Services (CMS) publishes the whole thing as one public file, called Open Payments. The 2024 file has 15.5 million rows worth $3.42 billion, with 91 columns per row: who paid, who got paid, how much, when, in what form, for what purpose, and which drug or device it was about. It is the most detailed public record of an industry’s marketing spend that exists anywhere.
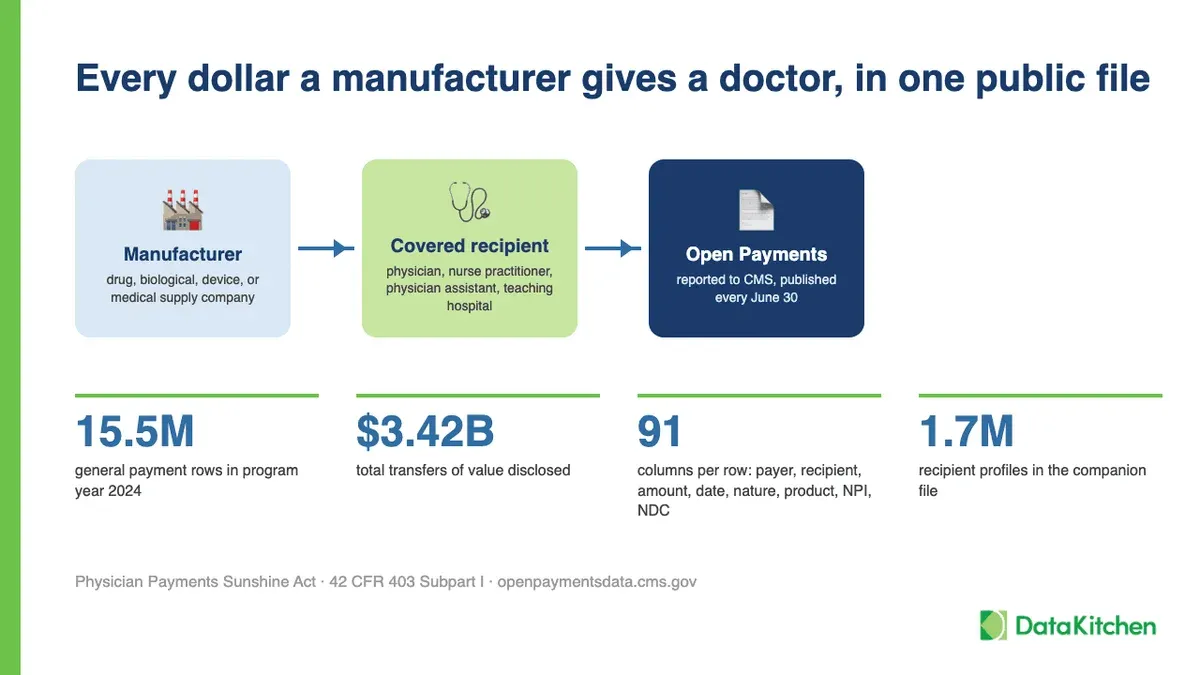
If you work in data, you already know the shape of this file. Hundreds of manufacturers each assemble their piece from expense systems, CRM, and vendor feeds, then submit it on one template. The rules for what a row must contain, and what a payment may be, are written down in federal regulation, state law, and industry codes. The payments themselves are mostly legal, since companies are allowed to pay physicians to consult, speak, and advise. The question is whether the file that says so is any good.
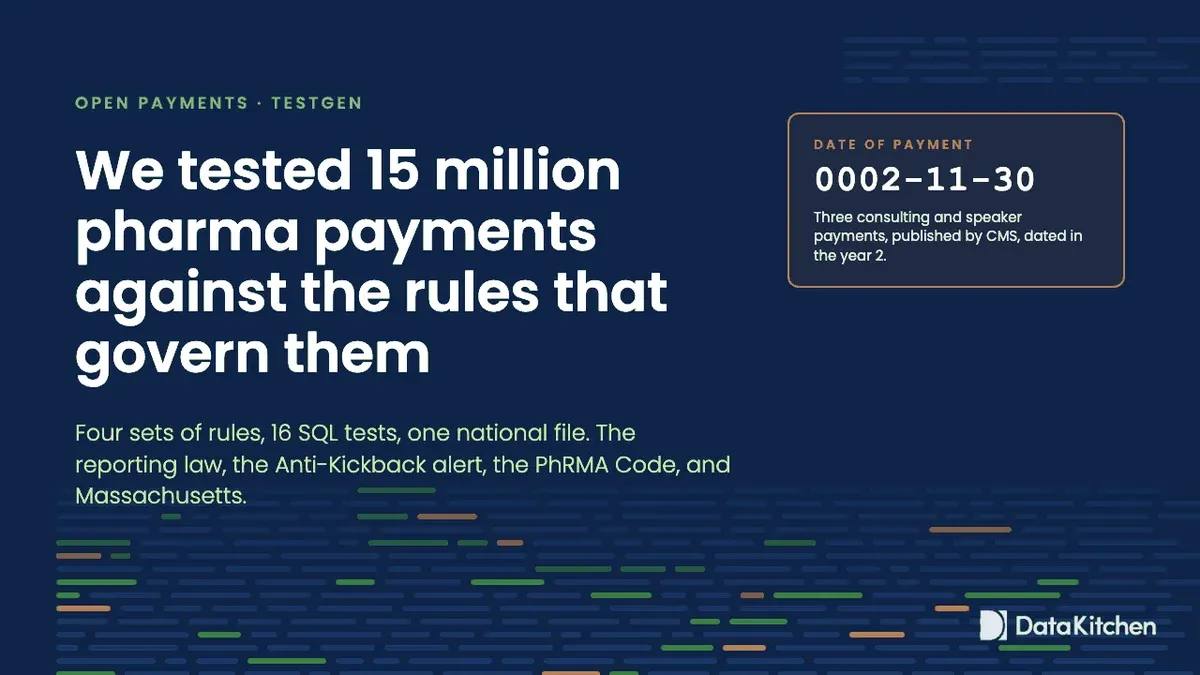
Seventy-five payments in the CMS Open Payments file are dated before the year 1900. Three of them, to a physician in Massachusetts, are dated November 30 in the year 2. Not 2002. The year 2. A device company paid $1,250, $3,000, and $5,000 for consulting and speaking, and the disclosure says it happened two thousand years ago.
Nobody caught it. The file went through CMS validation, got published on June 30, and sat on a public website. The date is well-formed. It parses. A schema check passes it. And it’s wrong in a way that only a rule about what a payment date can be would catch.
Record_ID,Date_of_Payment,Total_Amount_of_Payment_USDollars,Manufacturer,Nature_of_Payment,Recipient_State,Program_Year,Payment_Publication_Date,Change_Type,Dispute_Status
1154967631,11/30/0002,1250.00,Vektor Medical Inc.,Compensation for services other than consulting...,MA,2024,06/30/2026,UNCHANGED,No
1154967677,11/30/0002,5000.00,Vektor Medical Inc.,Consulting
That’s the whole problem with public disclosure data in one row. The data is there. The rules are written down. Nobody has connected the two.
So we did. Working from Claude Code with TestGen’s MCP server connected (the same setup we used on 3 million NYC taxi rides), we pulled the Open Payments data into TestGen, profiled it, let TestGen generate a test suite, then read the actual regulations and wrote 16 more tests based on them. First on Massachusetts, then on the full national file. Here’s what we found.
A note on the data first. Open Payments is the Physician Payments Sunshine Act, passed as part of the Affordable Care Act in 2010 and reported since 2013. CMS publishes each program year on June 30 and refreshes it the following January with corrections and dispute resolutions, so the numbers in this post come from the PY2024 general payments file as pulled on Sept 25, 2026, plus its companion file of 1.7 million recipient profiles. Column definitions are in the CMS methodology and data dictionary. Each row carries an NPI (the national ID number for a provider) for the doctor, an NDC (the national drug code) for the drug, a device identifier for the device, and a free-text field where the manufacturer can explain itself.
Four sets of rules for pharma
The Sunshine Act itself lives at 42 CFR 403.904. It says what must be reported and how. Every payment record needs the recipient’s NPI, name, license state, and specialty. It needs an amount, a date, one of four forms of payment, and one of 18 payment natures. If the payment relates to a product, the record needs the product’s NDC or device identifier. Payments under a de minimis amount can be skipped, unless the recipient’s annual total from that manufacturer crosses an aggregate ceiling. For 2024, those numbers were $13.07 per transfer and $130.66 per year, and CMS adjusts both for inflation every January.
That’s the reporting law. It says nothing about whether the payment was allowed.
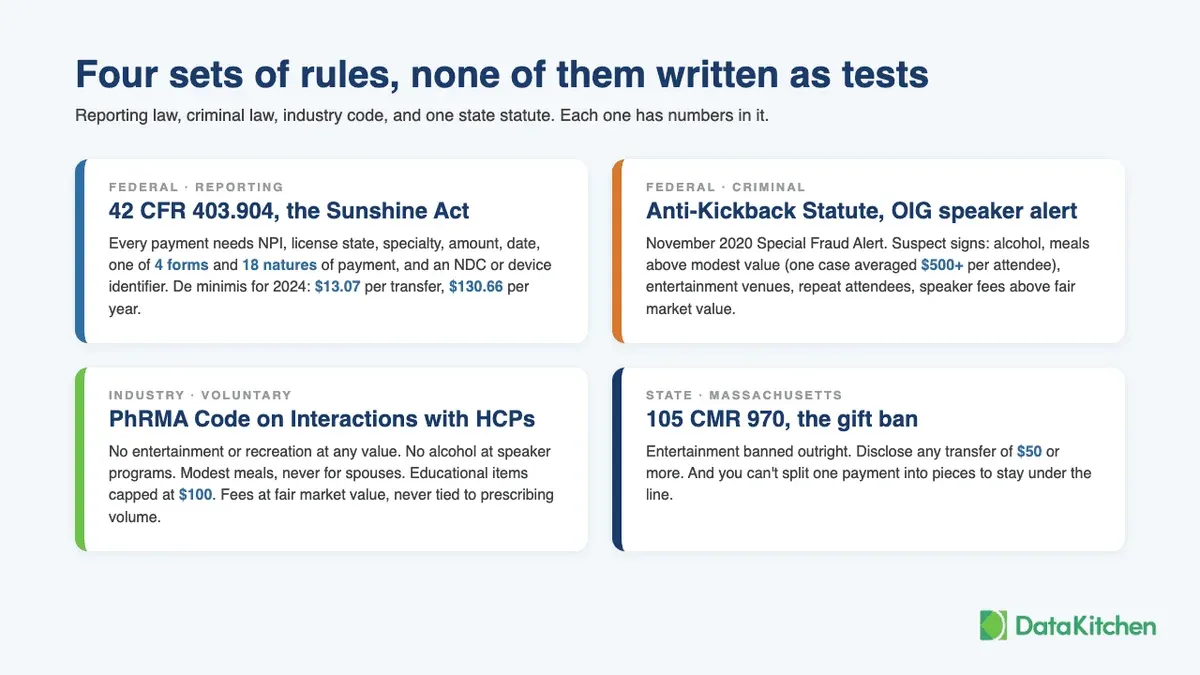
The Anti-Kickback Statute does. It’s a felony to pay a doctor to induce prescriptions, and in November 2020 the HHS Office of Inspector General published a Special Fraud Alert on speaker programs that reads like a list of things they’d seen in court. Programs at wineries and sports stadiums. Meals with free alcohol. The same doctors attend the same talk over and over. One case where food and drink averaged over $500 per attendee. Speakers paid above fair market value, or paid in proportion to how much they prescribed. OIG had said something similar about device companies seven years earlier in its alert on physician-owned distributorships, which matters later in this post.
The PhRMA Code is the pharmaceutical industry’s own answer to that. It’s voluntary, and PhRMA member companies commit to it in public. No entertainment or recreation, at any value. No alcohol at speaker programs. Meals modest by local standards, never for spouses or guests. Educational items capped at $100. Consulting and speaking fees at fair market value and never tied to volume.
And then there’s Massachusetts, which has its own law, 105 CMR 970. It bans entertainment outright. It requires disclosure of any transfer worth $50 or more. And it says, in plain language, that you can’t split a payment into pieces to stay under $50.
NOTE
Medical device companies aren’t PhRMA members. They have their own code, the AdvaMed Code of Ethics, which draws the same lines: no entertainment or recreation; modest, occasional meals tied to a real business or educational purpose; and consulting and royalty arrangements at fair market value. That matters because, as you’ll see, most of the entertainment payments in this file come from device and dental companies, and the AdvaMed Code is the standard they signed up to.
Four sets of rules. All of them written in the language of lawyers, not the language of tests. That’s the gap.
Loading Massachusetts and letting TestGen go first
We started small. The CMS datastore API lets you filter the national file by recipient state, so we pulled all 2024 general payments to Massachusetts recipients: 220,865 rows and $230 million. Plus 40,832 Massachusetts recipient profiles from the companion file. Into Postgres, into a TestGen table group, and into a profile.
Profiling took 3 minutes 24 seconds. It returned 82 hygiene issues and 41 potential PII flags across 123 columns.
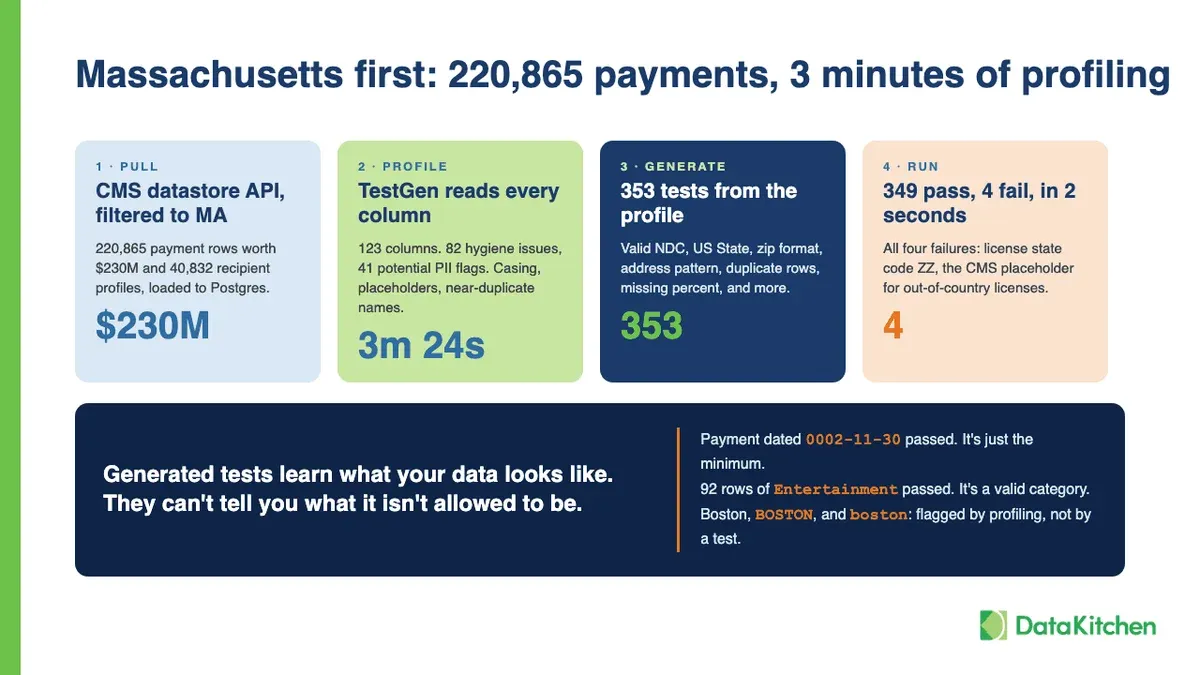
Some of the issues were what you’d expect from a file assembled by hundreds of different manufacturers. Boston appears as BOSTON, Boston, and boston. Recipient names are 96% in uppercase, with a stubborn minority in mixed case, indicating that a few submitters are using a different template. The recipient city has 740 distinct values, which collapse to 445 after stripping punctuation and spaces. Teaching hospital names have 69 variants that collapse to 37.
Some were placeholders masquerading as data. Drug names of NA, N/A, NONE, None, and OTHER. Street addresses of “unknown.” A recipient whose last name is NA. And one was the year 2.
Then we let TestGen generate tests. It produced 353 of them from the profile, including the pharma-specific set: Valid NDC on all five drug columns, US State on every license column, zip-format checks, street-address patterns, and duplicate rows. We ran them. Two seconds. 349 passed, 4 failed. The four failures were the same defect: license state codes of ZZ, which CMS uses for out-of-country licenses.
That’s a clean result, and it’s also a warning. Tests generated from your data learn what your data looks like. They will never tell you a payment date in the year 2 is impossible, because to them it’s just the minimum value. They will never tell you 92 entertainment payments are prohibited, because Entertainment is a valid category and the file has it. Generated tests find data that’s internally inconsistent. They can’t find data that’s inconsistent with the law.
Sixteen tests from the regulations
So we went back to the rules and wrote tests for the things they actually say. Each one is a SQL query that returns the rows that break the rule. TestGen runs it, counts the rows, and fails the test when the count crosses a threshold.
Three things about how the tests are scoped, because they change the numbers. First, the product identifier test only counts rows where CMS’s Covered_or_Noncovered_Indicator says the product is covered; non-covered products don’t need an NDC or device identifier, and counting them would inflate the gap. Second, “one payer” means one Applicable_Manufacturer_or_Applicable_GPO_Making_Payment_ID. Large companies submit under several registered entities, so the repeat-attendee and speaker-volume counts are conservative. Third, rows with a set Dispute_Status_for_Publication are counted separately because a disputed record may already be under correction.
Per the reporting law, physician records must include the NPI, state of licensure, and specialty. Teaching hospital records must carry a CCN (CMS certification number) and no physician fields. Covered drugs need an NDC, and covered devices need a device identifier. Travel records must state where the travel took place. Nature and form of payment must be one of the defined values. And a de minimis check that reads the year’s thresholds from a small reference table rather than hard-coding them, since CMS changes the numbers every year.
From the OIG alert and the industry codes: any Entertainment payment fails. Meals over $150 per person are warnings, and meals over $500 per person are failures. A recipient who has been fed by the same manufacturer 24 or more times in a year is flagged as a repeat attendee. A recipient paid 20 or more speaker fees, or $100,000 or more, by one manufacturer gets flagged for volume. A single consulting or speaking fee over $25,000 gets flagged for fair market value. Gifts and educational items over $100 are flagged as a warning.
The dollar and count thresholds in that paragraph are ours, not the regulators’. The OIG alert cites a $500 average it observed in one case; the PhRMA and AdvaMed codes use the terms “modest” and “fair market value” and leave the number to the company. We picked screening thresholds that would surface the top of the distribution. Change them, and the counts change. The rules underneath don’t.
From Massachusetts: two or more sub-$50 gifts to the same doctor from the same company on the same day that total $50 or more constitute the structuring pattern the state law names.
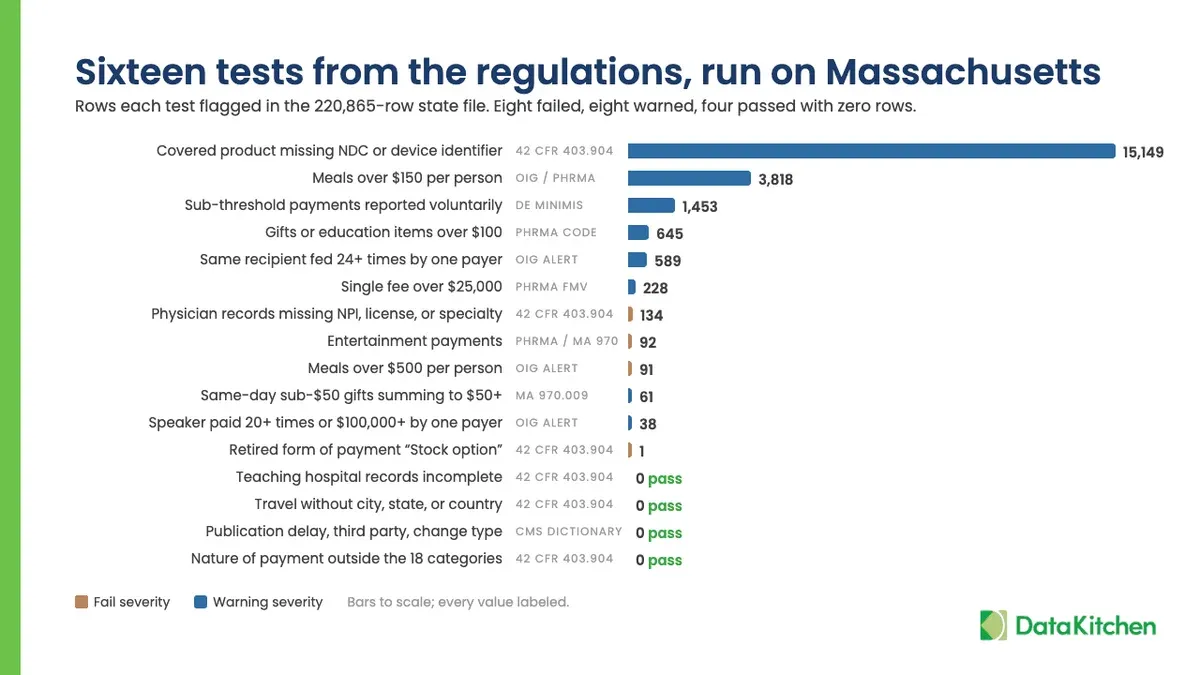
In the Massachusetts data, 12 of the 16 tests returned rows. Four returned nothing: teaching hospital completeness, travel destination, nature-of-payment category, and the publication delay, change type, and third-party checks.
| Test | Rule | Rows flagged |
|---|---|---|
| Entertainment payments | PhRMA Code, AdvaMed Code, MA gift ban | 92 |
| Meals over $500 per person | OIG alert | 91 |
| Physician records missing NPI, license state, or specialty | 42 CFR 403.904 | 134 |
| Retired form of payment “Stock option” | 42 CFR 403.904 | 1 |
| Covered product missing NDC or device identifier | 42 CFR 403.904 | 15,149 |
| Meals over $150 per person | OIG alert, PhRMA Code, AdvaMed Code | 3,818 |
| Sub-threshold payments reported voluntarily | De minimis rule | 1,453 |
| Gifts or education items over $100 | PhRMA Code | 645 |
| Same recipient fed 24 or more times by one payer | OIG alert | 589 |
| Single fee over $25,000 | PhRMA and AdvaMed fair market value | 228 |
| Same-day sub-$50 gifts summing to $50 or more | MA anti-structuring | 61 |
| Speaker paid 20 or more times or $100,000 or more by one payer | OIG alert | 38 |
The 92 entertainment payments came from eight device and dental manufacturers, all to physicians, in a state that bans them. One dental company accounted for 55. The largest single-speaker relationship in the state involved 39 payments totaling $192,562 from one manufacturer to one practitioner.
Two of the numbers need context before anyone quotes them. The 15,149 product identifier gap is 87% of devices, and the device identifier field only recently became mandatory, so it’s a backlog rather than a scandal. And the 1,453 sub-threshold payments are legal. Manufacturers can voluntarily report below the threshold. What the number tells you is that 100 different companies aren’t applying the threshold logic, which is a data pipeline observation, not a compliance one.
Then we ran it on the whole country
The national file is 15,498,687 rows and 8.9 gigabytes. The CMS download server throttles a single connection to about 2 megabytes a second, so Claude Code split the file into eight byte ranges, pulled them in parallel in seven minutes, and loaded them into Postgres in four. Byte ranges don’t respect row boundaries, and the free-text fields in this file can contain commas and newlines inside quotes, so each chunk was realigned to the next complete record before loading, and the total row count was checked against the CMS-published figure.
Then the same steps. A new table group. Profile, this time on a 10% sample of the big table, which took 29 minutes and found 126 hygiene issues and 45 PII flags. Copy all 369 tests from the Massachusetts suite, generated and custom alike, into a suite on the national table group. Run.
On my Mac M1: 15 minutes 50 seconds. 323 passed, 27 failed, 19 warnings.
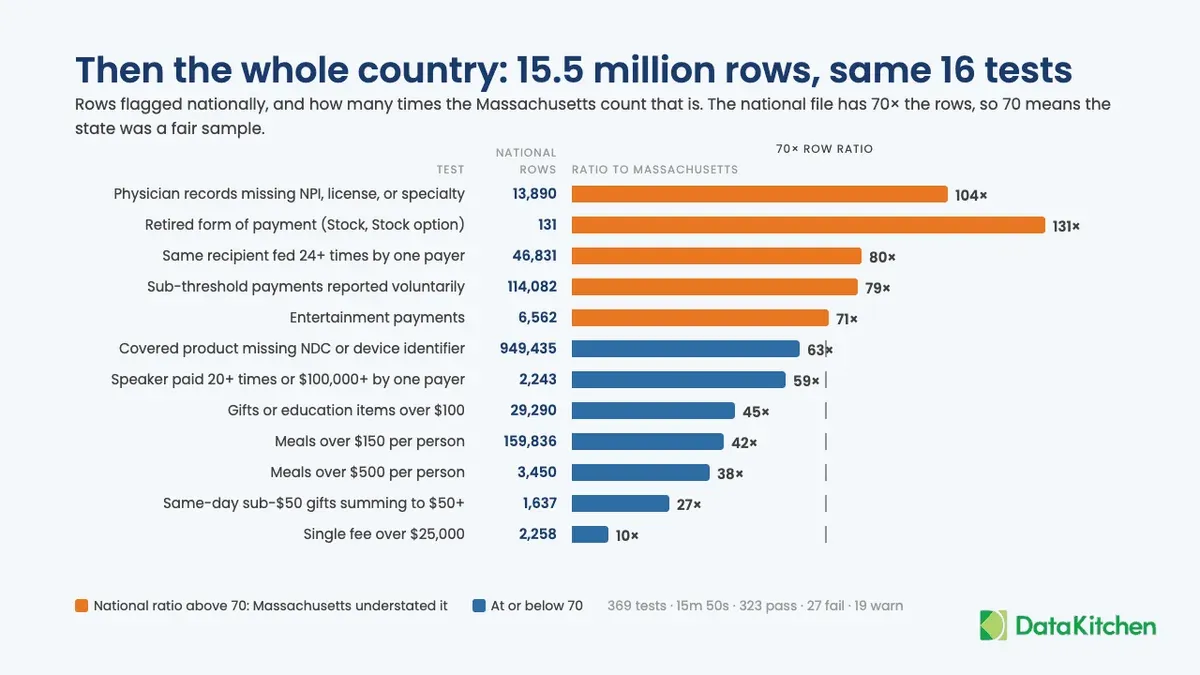
Here’s what the 16 rule tests found nationally, next to the Massachusetts numbers. The national file has 70 times as many rows as the Massachusetts file, so the ratio column shows how each finding scales. Massachusetts is not a random sample of the country. It has a gift ban, an unusual concentration of teaching hospitals, and a lot of academic medicine, so a ratio far from 70 says as much about Massachusetts as about the test.
| Test | Massachusetts | National | Ratio |
|---|---|---|---|
| Covered product missing NDC or device identifier | 15,149 | 949,435 | 63 |
| Meals over $150 per person | 3,818 | 159,836 | 42 |
| Sub-threshold payments reported voluntarily | 1,453 | 114,082 | 79 |
| Same recipient fed 24 or more times by one payer | 589 | 46,831 | 80 |
| Gifts or education items over $100 | 645 | 29,290 | 45 |
| Physician records missing NPI, license state, or specialty | 134 | 13,890 | 104 |
| Entertainment payments | 92 | 6,562 | 71 |
| Meals over $500 per person | 91 | 3,450 | 38 |
| Single fee over $25,000 | 228 | 2,258 | 10 |
| Speaker paid 20 or more times or $100,000 or more by one payer | 38 | 2,243 | 59 |
| Same-day sub-$50 gifts summing to $50 or more | 61 | 1,637 | 27 |
| Retired form of payment | 1 | 131 | 131 |
| Third-party name present where indicator says none | 0 | 1 | |
| Publication delay indicator valid | 0 | 0 | |
| Change type valid | 0 | 0 | |
| Teaching hospital records incomplete | 0 | 0 | |
| Travel without city, state, or country | 0 | 0 | |
| Nature of payment outside the 18 categories | 0 | 0 |
Some of what’s behind those numbers.
6,562 entertainment payments, from 84 manufacturers to physicians in 53 states and territories, worth $634,978. Four of the top five payers are dental companies. The top ophthalmic imaging company reported 2,876 of them on its own. The PhRMA Code says zero. The AdvaMed Code says zero. Massachusetts, Vermont, and Minnesota say zero in state law, and most other states say nothing at all. The interesting number is the Massachusetts ratio: 71, right at the population baseline, in the one state with a statutory ban. If a ban worked, that number would be near zero.
3,450 meals over $500 per person. The most expensive single meal in the file costs $40,300 per attendee. That’s not a rounding error in the attendee count, because the attendee count is one.
The largest “speaker” relationship in the country consists of three payments from a single device company to a single practitioner, totaling $7,851,645. Three payments that size are almost never speaking fees. The next two are $1.31 million over 17 payments and $1.3 million over four. Speaker compensation across the whole file is $706 million over 241,927 payments.
The most-fed practitioner received 237 meals from one orthopedics manufacturer in a year. Second place is 232. Third is 223. Those are working days. Anyone in orthopedics will tell you why: device reps are in the operating room most days of the week, and a sandwich in the surgeon’s lounge is a reportable transfer of value. That’s routine, and it’s also exactly the pattern the OIG alert says to watch, because routine is how a relationship stops being noticed.
13,890 physician and practitioner records are missing an NPI, a license state, or a specialty required by the reporting rule. 7,729 of them are nurse practitioners and physician assistants, who only became covered recipients in 2021. Most manufacturers’ HCP (health care professional) master data was built around physicians, and four years later, much of it still doesn’t cleanly accommodate NPs and PAs. That’s a master data problem before it’s a compliance problem.
131 payments use the payment forms “Stock” and “Stock option,” which CMS retired into a single category. They’re royalties, consulting fees, and acquisition payouts from physician-owned distributors, and they’re the only place in the file where ownership interest shows up in the form field. In 2013, the OIG called physician-owned distributors “inherently suspect” under the Anti-Kickback Statute. These 131 rows are what that looks like in a disclosure file.
And one row where the third-party indicator says no third party was paid, but the third-party name field contains a person’s name. One row out of 15 million. That is a personal name in a public file in a field that’s supposed to be empty, and no generated test would ever look for it.
The 75 pre-1900 dates aren’t in the table because we didn’t write that test. Profiling caught them as an Unlikely Dates hygiene issue on the Massachusetts run and on the 10% national sample; the count of 75 comes from a direct query against the full national table.
Then there’s the other 353 tests, the generated ones. In Massachusetts, they went 349 for 353. Nationally, 33 of them failed or were warned, and most of those failures are due to the test suite being wrong, not the data. A Value Count test showed that the recipient state has one value because Massachusetts does. Nationally, it has 59 postal codes, including the military postal codes AA, AE, and AP, as well as five territories. A Minimum Value test on NPI learned the lowest NPI in Massachusetts and flagged 369 doctors nationally for having a smaller number. The US State tests flagged 205 license codes of ZZ. Generated tests carry their baseline with them. Move them to a bigger table, and the baseline is the first thing that breaks.
The rule tests didn’t break. Their thresholds came from the law, not from the sample.
Run it yourself: the prompts
Everything above came from five prompts typed into Claude Code with TestGen’s MCP server connected. Here they are, with the typos fixed and nothing else changed. The first one picked the dataset. The rest did the work.
❯ What’s another popular, high-interest open dataset for us to analyze?
<… Claude suggested this dataset …>
❯ Yes, Open Payments is good. Load it into TestGen, profile it, and find hygiene issues. Generate a test suite and run the tests. Return to me what the hygiene issues are and any test failures. Suggest some new tests.
<… Claude chugs away and gives a list of suggested tests on Massachusetts data …>
❯ Yes, create tests and re-run.
<… Claude summarizes results …>
❯ Go online and read about payments to doctors from pharma companies, the rules and laws, then suggest some tests.
<… Claude chugs away …>
❯ I want you to download the entire Open Payments national data to a new table group, profile it, and run hygiene tests. Then I want you to copy the existing tests over to that new table group and run it.
<… Claude chugs away …>
That’s the whole script. The model chose Massachusetts as the starting subset, found the CMS datastore API, read the rules, wrote and dry-ran the SQL, and moved the suite between table groups. You need a Postgres database to store the files, TestGen running in Docker, and the MCP server turned on. The MCP server docs cover setup, and the one-page cheat sheet lists every tool the model had to work with.
If you want a smaller first run, we did the same thing with 3 million NYC taxi rides in about five minutes: Data quality tests on 3 million NYC taxi rides in five minutes.
Who this is actually for
Journalists and researchers download Open Payments. The people who should be running these tests are the ones who create it. Every manufacturer has a transparency reporting team that assembles this file from expense systems, CRM, and aggregate spend vendors, and submits it to CMS by the end of March. Then comes a 45-day review period where physicians can dispute rows, after which CMS publishes. Every test in this post can run against the file before it goes to CMS. A year-2 date, a missing NPI on a nurse practitioner, an entertainment row from a company that signed the AdvaMed Code: those are cheaper to catch in February than to read about in July.
The same goes for the commercial side. The vendor feeds that drive field reporting have the same shape as this file: many submitters, one template, and no one checking the rows against the rules that govern them. What we did here with public data is what our commercial pharma data teams do every week with IQVIA, specialty pharmacy, and CRM feeds.
Why TestGen
Everything in this post happened via TestGen, and most of it involved an AI model communicating with TestGen’s MCP server. Profile the table group. Read the hygiene issues. Generate the suite. Dry-run a query against the live connection, see the rows it returns, turn it into a test. Export the suite, point it at a bigger table group, run it again.
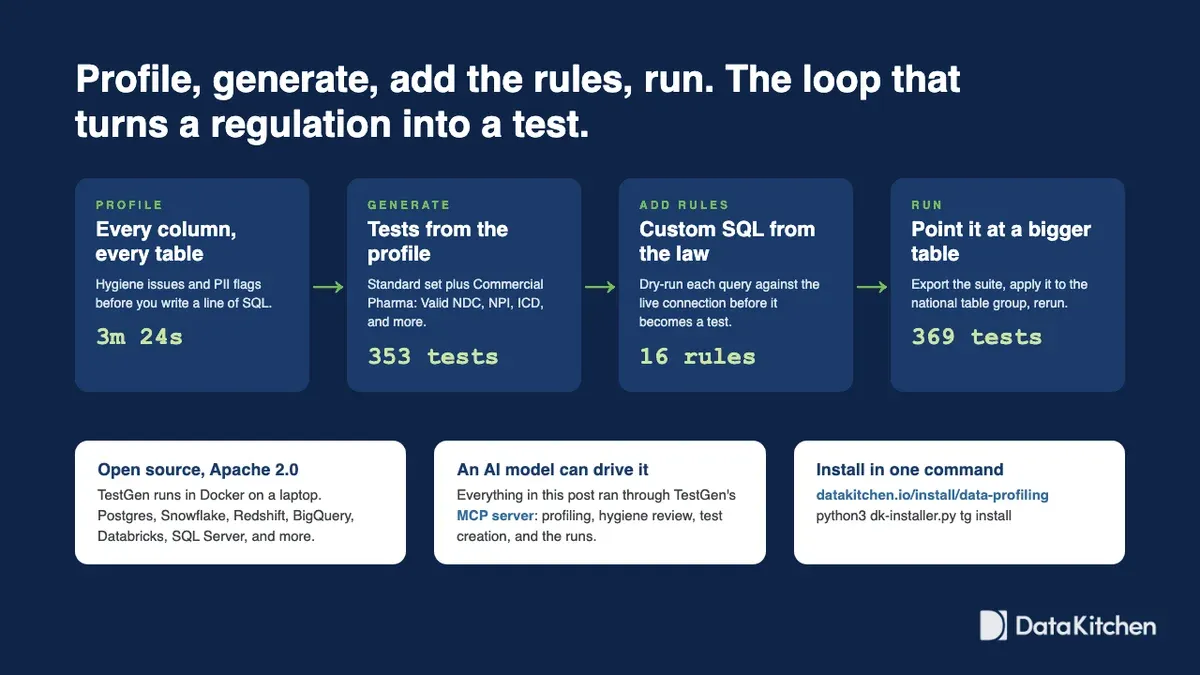
The part that matters is the middle step. TestGen’s generated tests found the ZZ license codes and confirmed every NDC in the file was well-formed. That’s real. But the 92 entertainment payments, the year-2 dates, the doctor fed 237 times by one company, and the 15,149 covered products with no identifier came from rules that somebody had to read and write down. TestGen gave those rules a place to live, a threshold, a severity, a source-data view, and a run history. A SQL query in a notebook has none of that.
TestGen is open source under Apache 2.0. It runs in Docker on a laptop, and on one, it profiled a 10% sample of a 15.5-million-row table and ran 369 tests against the full table. Install it from datakitchen.io/install/data-profiling and point it at the data you trust.
FAQ
What are the key points in this blog?
The CMS 2024 Open Payments file passed validation with 75 payment dates before the year 1900. TestGen’s 353 generated tests caught none of them, because generated tests learn what the data looks like rather than what the law allows. Sixteen SQL tests written from the Sunshine Act, the OIG speaker-program alert, the PhRMA and AdvaMed codes, and Massachusetts law flagged 6,562 entertainment payments, 3,450 meals over $500 a person, and 13,890 records missing a required identifier nationally.
What is CMS Open Payments?
Open Payments is the public database created by the Physician Payments Sunshine Act, passed in the Affordable Care Act in 2010 and reported since 2013. Drug and device manufacturers report every transfer of value to physicians, nurse practitioners, physician assistants, and teaching hospitals, and CMS publishes it each June 30. The 2024 program year file has 15.5 million general payment rows worth $3.42 billion, with 91 columns per row.
What rules govern pharma and device company payments to doctors?
Four sets. The Sunshine Act reporting rule at 42 CFR 403.904 says what must be reported: NPI, license state, specialty, amount, date, form, nature, and a product identifier. The Anti-Kickback Statute makes paying to induce prescriptions a felony, and the HHS OIG’s 2020 speaker-program alert lists the warning signs. The PhRMA and AdvaMed codes ban entertainment and cap gifts. Massachusetts 105 CMR 970 bans entertainment outright and requires disclosure at $50.
Why did TestGen’s generated tests pass data that broke the rules?
Because generated tests learn their thresholds from the data in front of them, so they measure consistency rather than legality. A minimum-date test sees a payment dated in the year 2 as the minimum value. A valid-value test sees Entertainment as one of the 18 nature-of-payment categories CMS defines. In Massachusetts, 349 of 353 generated tests passed, and the four failures were license state codes of ZZ.
What did the 16 rule tests find in Massachusetts?
Twelve of the 16 tests returned rows in the 220,865-row Massachusetts file: 15,149 covered products missing an NDC or device identifier, 3,818 meals over $150 per person, 1,453 sub-threshold payments reported voluntarily, 645 gifts or education items over $100, 589 recipients fed 24 or more times by one payer, 228 single fees over $25,000, 134 physician records missing a required identifier, 92 entertainment payments, and 91 meals over $500 per person.
What did the same tests find across the whole country?
Across 15,498,687 rows: 949,435 covered products missing an NDC or device identifier, 159,836 meals over $150 per person, 46,831 recipients fed 24 or more times by one payer, 13,890 physician records missing an NPI, license state, or specialty, 6,562 entertainment payments from 84 manufacturers worth $634,978, 3,450 meals over $500 per person, and 131 payments using the retired Stock and Stock option forms. The most expensive single meal was $40,300 for one attendee.
Which findings in the Open Payments file are data problems rather than compliance problems?
Two of the biggest counts. The 949,435 covered products with no NDC or device identifier are a backlog rather than a scandal, since the device identifier field only recently became mandatory and the gap covers 87% of devices in Massachusetts. The 114,082 sub-threshold payments are legal, because manufacturers may report below the de minimis amount voluntarily. That number shows around 100 companies are not applying the threshold logic in their pipelines.
How long does it take to profile and test 15 million Open Payments rows with TestGen?
Profiling the 220,865 Massachusetts rows took 3 minutes 24 seconds and running 353 generated tests took two seconds. For the national file, downloading 8.9 GB in eight parallel byte ranges took seven minutes and loading it into Postgres took four. Profiling a 10% sample took 29 minutes, and running all 369 tests against the full 15.5 million rows took 15 minutes 50 seconds on a Mac M1.
How do I run these tests on my own Open Payments submission?
You need a Postgres database for the file, TestGen running in Docker, and the TestGen MCP server turned on, then an AI client such as Claude Code connected to it. The whole analysis in this post came from five prompts. A transparency reporting team can run the same 16 rule tests against the file before it goes to CMS in March, which is cheaper than reading about a year-2 date in July.
What are the sources for the rules and data in this post?
The payment data is the CMS Open Payments program year 2024 general payments file, 15,498,687 rows pulled on September 25, 2026, with column definitions from the CMS methodology and data dictionary. The rules come from the Sunshine Act reporting regulation at 42 CFR 403.904, two HHS OIG Special Fraud Alerts, the PhRMA Code, the AdvaMed Code of Ethics, and Massachusetts regulation 105 CMR 970.
- CMS Open Payments: search tool and dataset downloads, data overview and publication schedule, methodology and data dictionary (June 2025, PY2024)
- Reporting rule: 42 CFR 403.904
- HHS OIG: Special Fraud Alert: Speaker Programs (Nov 2020), Special Fraud Alert: Physician-Owned Entities (Mar 2013)
- Industry codes: PhRMA Code on Interactions with Health Care Professionals, AdvaMed Code of Ethics on Interactions with U.S. Health Care Professionals
- Massachusetts: 105 CMR 970.000, background on the Massachusetts code of conduct
What related reading does DataKitchen have on this topic?
Five pieces. The NYC taxi post is the same method on a smaller file. The TestGen MCP cheat sheet lists all 96 tools the model used, and the MCP server documentation covers setup. Two pharma posts explain why commercial data feeds like IQVIA and specialty pharmacy have the same shape as Open Payments, and how a dedicated commercial data team checks them.
| Resource | What it is | Reach for it when |
|---|---|---|
| Data quality tests on 3 million NYC taxi rides in five minutes | Blog post | You want a smaller first run before an 8.9 GB download |
| TestGen MCP Cheat Sheet: 96 tools, one page | Blog post | You want to see every tool the model had to work with |
| TestGen MCP server documentation | Documentation | You are turning the MCP server on and connecting a client |
| IQVIA, specialty pharmacy, and your own files: the commercial data most likely to be wrong | Blog post | You run commercial feeds and want to know which ones break first |
| The $100 Billion Secret: Why leading pharma companies bring in a dedicated commercial data team | Blog post | You are deciding who should own the commercial data team |
Who are the 15 physicians with the most 2024 Open Payments general-payment dollars nationally, excluding teaching hospitals?
Charles Goodis, an endodontist in Winter Park, Florida, leads at $91,082,706, almost all of it one acquisition payment from Edge Endo. The five largest totals are each dominated by a single Acquisitions payment, a category CMS added in 2021 for buyouts of physician-owned companies. Most of ranks 6 through 15 are royalties on implant and instrument designs from Arthrex, Medtronic, Zimmer Biomet, Alphatec, and AbbVie. Names are as CMS published them.
| Physician | Specialty and location | Total 2024 | Payments | Largest single payment |
|---|---|---|---|---|
| 1. Charles Goodis | Endodontics, Winter Park, FL | $91,082,706 | 1 | $91.1M acquisition, Edge Endo |
| 2. Robert Medoff | Orthopaedic surgery, Kailua, HI | $26,746,121 | 5 | $26.7M acquisition, Henry Schein |
| 3. Charles DeCook | Orthopaedic surgery, Cumming, GA | $26,221,790 | 282 | $25.1M acquisition, DePuy Synthes |
| 4. Andrew Cooper | Orthopaedic surgery, Clearwater, FL | $25,336,322 | 13 | $24.6M acquisition, DePuy Synthes |
| 5. Nitin Goyal | Orthopaedic surgery, Arlington, VA | $25,000,342 | 7 | $25.0M acquisition, Zimmer Biomet |
| 6. Ivan Osorio | Neurology, Kansas City, KS | $17,456,053 | 5 | $4.5M royalty, LivaNova |
| 7. Stephen Burkhart | Orthopaedic surgery, San Antonio, TX | $17,332,176 | 3 | $9.2M royalty, Arthrex |
| 8. Kevin Foley | Neurological surgery, Memphis, TN | $16,529,118 | 61 | $2.8M royalty, Medtronic |
| 9. Roger Jackson | Spine surgery, Kansas City, MO | $10,888,417 | 26 | $2.1M royalty, Alphatec Spine |
| 10. Daniel Schwartz | Ophthalmology, San Francisco, CA | $7,852,269 | 11 | $6.8M speaker fee, RxSight |
| 11. Erik Kubiak | Orthopaedic surgery, Las Vegas, NV | $7,496,960 | 140 | $7.4M acquisition, Zimmer Biomet |
| 12. William Binder | Plastic surgery, Beverly Hills, CA | $7,420,997 | 5 | $2.4M royalty, AbbVie |
| 13. Mark Frankle | Orthopaedic surgery, Temple Terrace, FL | $7,333,021 | 150 | $1.5M royalty, Encore Medical |
| 14. George Maxwell | Plastic surgery, Nashville, TN | $7,220,121 | 4 | $1.9M royalty, AbbVie |
| 15. Neal ElAttrache | Sports medicine, Los Angeles, CA | $6,849,431 | 22 | $2.1M royalty, Arthrex |
A few things the ranking tells you.
- The top of the list is not marketing money. The five largest totals are each dominated by a single Acquisitions payment, a category CMS added in 2021 for buyout payments to physicians who held ownership in a company that was acquired. The number one entry is one payment of $91 million to an endodontist from the company that bought his endodontic file business. That’s a physician-founder cashing out, reported through the same file as sandwiches.
- Most of ranks 6 through 15 are royalties. Orthopaedic surgeons collecting on implant and instrument designs from Arthrex, Medtronic, Zimmer Biomet, and Alphatec, and two plastic surgeons collecting from AbbVie, which owns Allergan’s aesthetics line.