There is a number at this company that jumps every Monday.
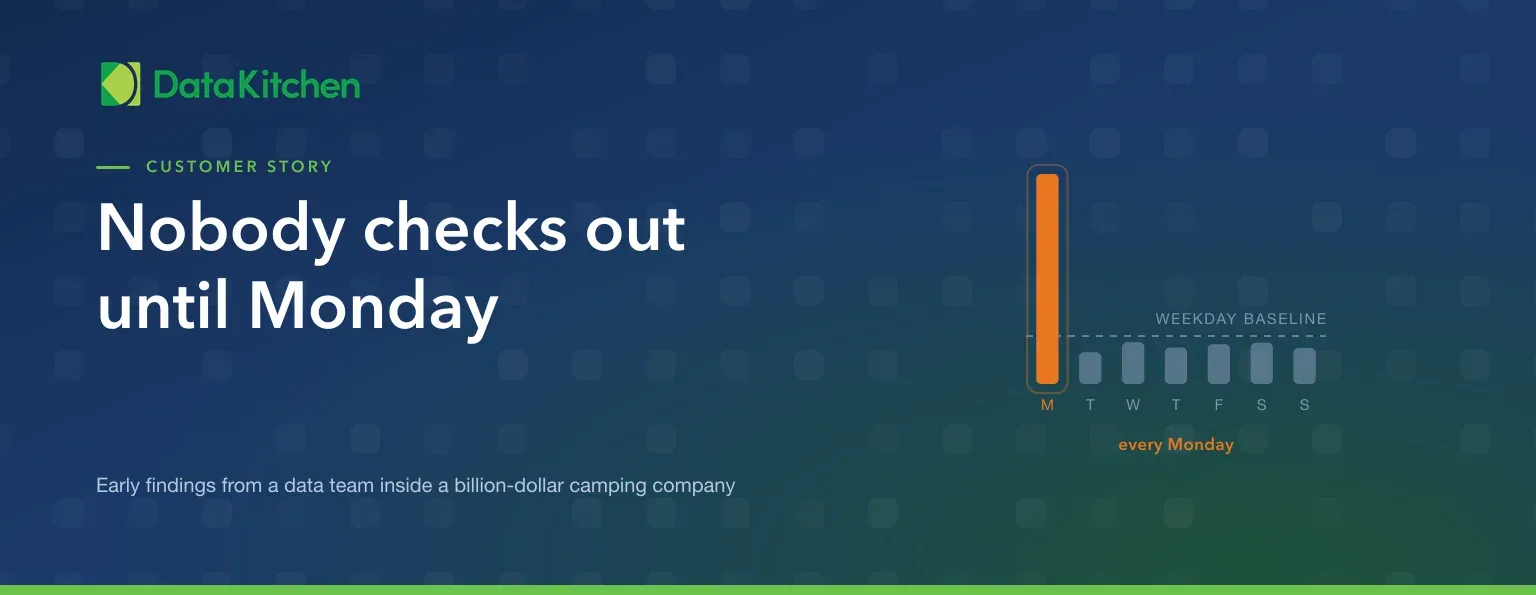
It counts reservations still marked as on site whose check-out date has already passed. Guests leave on a Sunday. The hotel owner-operator clears the record on Monday morning, once the rush is over and the site is turned. So every Monday the count climbs, and by midweek it settles.
Nobody is doing anything wrong. The guests left, the operators are busy running hotels, and the record catches up. But Monday is also this company’s busiest reporting day. Every report that groups by reservation status on a Monday morning inherits that lag, and until someone wrote a test for it, the shape of the lag was folklore rather than a number.
“Don’t run reports on Monday,” we suggested, unhelpfully.
“That’s actually our busiest report day.”
Now they can say how large the effect is, which day it peaks, and whether it is growing. That is the difference a test makes to a number everybody already half knew.
The customer is a billion-dollar hospitality company. They asked us not to use their name, so we are not going to. Everything else here is what actually happened, told from the chair of the database administrator who ran it. They are early in the life cycle of this program, which is part of the point: none of what follows required a finished data quality practice.
The finding that paid for itself
The database administrator wrote a custom test for hotels marked as actively using the guest messaging service that had not sent a successful outbound message in more than three days.
The first one it surfaced had gone more than 40 days without sending anything. The hotel had stopped using the service and never switched it off, and the company bills for that feature. So a hotel was on its way to a bill for something it had stopped using and believed it had cancelled.
Support called them, they confirmed they were done with it, and it was turned off. Two more cases appeared over the following two days.
The same test also tells them which quiet hotels are quiet on purpose. One that had sent nothing for weeks turned out to be winter-seasonal, which is the answer you want a test to be able to give: this one is fine, look at the other two.
Nothing in a generated test suite would have caught that. A profiler knows what your data looks like; it does not know that “active” and “silent for three days” is a contradiction in your business. That sentence lives in somebody’s head until a person writes it down as SQL, which is exactly what custom tests are for, and it is why the early weeks here produced business findings rather than a backlog of formatting complaints.
Two more tests of the same shape followed quickly. One counts upcoming reservations whose check-in date has already passed, the mirror image of the Monday check-out count, and it stands at around 44,000. The count itself is the weaker half of that measurement. What matters is the rate and its direction, and standing up the test is what makes the rate visible at all. The other tracks the daily percentage of messages successfully sent. That one is a metric rather than a pass or fail, expressed as a ratio and bounded to the last day of traffic, so a drop in delivery shows up as a trend line instead of an incident nobody logged.
The surveys that were never going to arrive
The second finding is the one that got leadership animated, and it shows what the habit is worth once a team has it. This report is one the team built themselves, before TestGen arrived, tracking changes to guest email addresses because the plan is eventually to let guests maintain their own contact details. It is exactly the shape of thing TestGen now generates and monitors for them across every profiled column instead of one.
The report ranks the top handful of user IDs by how many email addresses they change. For years the top two were stable and boring: the website’s own feed, and the customer experience group whose job is exactly that. Then three employees at a single hotel turned up in the top seven.
What made it matter is what the company does with guest email addresses. It sends satisfaction surveys to them. As the senior database analyst put it: you will never get a negative review if the guest never gets the review in the first place.
Nobody has proven intent, and he was careful to say so twice. What the data proves is narrower and still serious: survey results from that site are not reliable, and this is a company that competes on guest satisfaction scores. A hotel quietly editing addresses into undeliverable ones distorts a number the business is measured on.
Leadership saw the pattern, went to the people responsible for those sites, and by his account were very animated about putting a stop to it.
Two second-order points came out of it, both more useful than the incident. The application permits this, which makes it an engineering question rather than a discipline one, and the count of changed addresses has been climbing for exactly that reason. As he said, engineers design a flow without thinking through every implication, and then get surprised by the ingenuity of the end users.
The second point is that you cannot fix it by forcing validation at the counter. Visit a large hotel on a Friday and there are several hundred people to check in within the hour, with cars backed up onto the freeway. Anything that slows that touch point damages the experience you are trying to measure. Monitoring the data afterwards is what lets you leave the check-in fast and still know what happened.
The team exists because nobody trusted the reports
The company formed the data team in early 2026, and the reason was internal distrust. Reports disagreed with each other. People had stopped believing the numbers, which meant they had also stopped using them. The team is a small mix of database administrators, report writers, and BI specialists, and the assignment is precise: make the data accurate, and make people willing to rely on it again.
Two efforts run in parallel with the testing. One team member audits reports that leadership has flagged. Another is building a data dictionary and pinning down report logic, so two reports with the same title stop meaning two different things.
Then the company formed an internal AI team, which began building agents on top of this data.
That raises the value of every test on the pile. When a report is wrong, an analyst argues with it. When an agent is wrong, it answers with confidence and the person asking has no way to tell. A model does not know that a reservation marked on site has been empty since Sunday. It just reports occupancy.
Keeping it off the production path
The environment is a high-availability SQL Server cluster. The main reservation database is about 1.2 terabytes and sits behind the application the hotels themselves use. Most reporting runs against a separate data warehouse. Alongside those is the guest messaging application, which has sent more than a million messages since going live in May.
The charges table holds more than 100 million rows, and profiling something that size against a database with a day job is a real engineering problem. Four practices settled it.
Point tests at the read-only replica by adding ApplicationIntent=ReadOnly to the connection string. Two prerequisites trip people up: the connection has to target the availability group listener rather than an instance name, and read-only routing has to be configured on the AG. Point it at an instance and you get the primary anyway, quietly.
Constrain the profiling workload with Resource Governor. It caps CPU, memory grant, and IO for a workload group. It does not cap TempDB space directly; what it buys you is smaller and less concurrent hash and sort spills from the profiling connection.
Start TestGen’s thread count low, then raise it. This is the concurrency setting inside TestGen, not SQL Server’s max degree of parallelism. One or two threads to begin with, more once runs are stable. The related knob is max expression length, which keeps a single generated query from becoming enormous.
Profile a subset rather than all of history. Homogeneous chunks, filtered by date or category, tell you what you need without reading a decade of transactions. If the underlying tables are partitioned, build the views so the partitions still get used, or you have quietly reintroduced the scan you were avoiding.
One constraint here is common and rarely discussed: this DBA cannot create views in the application database at all, because that database belongs to the application. So the views went into the data warehouse and the table groups point there. A data quality program usually has to fit itself around who owns which schema, and the shape of the deployment ends up reflecting the org chart.
Tests or monitors
A weekly sawtooth is a good illustration of the choice between the two ways to watch a number.
A test is a statement about what is acceptable, and it either passes or fails. That is what you want when a failure has to be traceable and arguable: the check-in date is in the past and the status still says upcoming, so this row is wrong, and here is the row. Custom tests are where a company’s own business logic goes.
A monitor learns the shape of the data and tells you when the shape breaks. That is what you want when there is no fixed threshold to write down, because the normal value drifts, or because normal is itself a pattern. A monitor that has learned a weekly rhythm is not surprised by Monday. It is surprised by a Monday that does not arrive, or a Tuesday that looks like one.
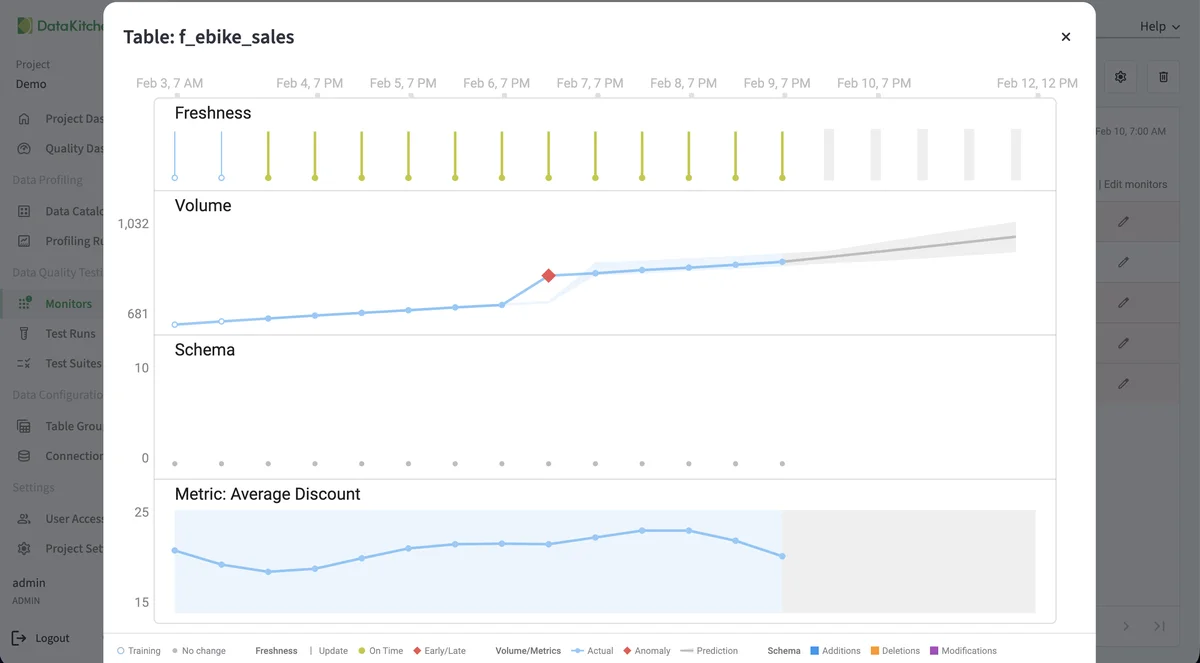
Freshness, volume, schema, and a metric trend for one table. The prediction band is what makes “normal” something the tool learns rather than something you have to write down.
Volume monitors and row count tests are easy to confuse, and they answer different questions. A row count test catches a table that arrived empty or doubled. A volume monitor catches the dip that is only obvious against history: this feed usually brings 900 rows on a Wednesday, today it brought 400, and nothing failed.
Protecting a migration nobody wants to redo
A colleague is building the ETL for a move to a new accounting system, due by the end of the year. It depends on a tax code lookup table: about 35 rows, an ID, a code, and a description.
His process pivots that table from long to wide, so each tax code becomes a column. Add a code or retire one and the structure of the output changes. Asked how often it changed, his manager said: “I don’t believe that’s changed in the 20 years I’ve been here.”
We all know how that goes.
The useful part is that this is genuinely hard to watch for, and now it is watched. A volume test cannot catch it, because adding one row and deleting another leaves the count identical. Three approaches work: a value match test if the distinct count is inside the threshold, a schema test on the ETL output that catches the column change one run later, or a custom test that hashes the rows in a deterministic sort order so any edit moves the hash.
Include every column whose change would hurt you, not just the code, and on SQL Server before 2016 aggregate per-row hashes rather than hashing one giant string, because HASHBYTES caps its input at 8,000 bytes.
A migration that fails quietly on a changed lookup table is the kind of project that eats a quarter. This is a cheap test standing in front of an expensive problem.
The rest of that project is six generated files, loaded into on-premises tables, pushed to the company’s own Azure tenancy and on to the accounting vendor’s. Those tables are truncated and replaced in full every night, which is a different animal from a table that accumulates: the profiler needs two or three runs before it recognizes a window table rather than a cumulative one, so the practical advice is to profile it on every load at first and let it learn. Three of the six are on a nightly schedule now, with three more waiting on the development team.
Where this is heading: a failed test that stops the job
The next step is the one that turns findings into prevention. Their enterprise job scheduler, Control-M, can call the TestGen API, which means a scheduled workflow can run the tests, read the result, and stop itself when something fails, holding the data until a person reviews it.
That is the difference between a test that tells you the data was wrong and a test that stops the wrong data from moving, and it is a straight API call away rather than a project. The billing and survey findings are what buys the room to build it: as the DBA put it, being able to attach dollars to what is broken is how this work gets attention.
Findings only count once the business sees them
The last part is the part most tools skip.
Once you have found a set of questionable values, somebody has to decide which ones matter. That is not a database question. It needs a person who owns the meaning of the data: a steward, a quality circle, a standing review. Otherwise the findings sit in a tool only the data team looks at.
So the DBA went and asked. He presented what he had built to IT leadership, deliberately, to hear what the business had been complaining about.
“At this point I’m just kind of guessing what I know is wrong in the data.”
That is the most honest sentence in the whole engagement, and it is true of nearly every team starting this work. You can profile every table you own and still be guessing about which findings matter, because relevance lives with the people who read the reports. The tests are how you stop guessing. The presentation is how you learn what to test next, and it came back with a queue of requests rather than a shrug.
TIP
The tests in this story are the kind TestGen generates from your data’s own profile, plus a handful of custom ones carrying business logic. Install the open source version and point it at a replica, not your production primary.
FAQ
What are the key points in this blog?
A billion-dollar hospitality company built a data team to rebuild trust in reporting. Early in its DataOps TestGen program, custom tests had found a hotel billed for a cancelled service, quantified a reporting distortion that hits every Monday, and protected an accounting migration that depends on a 35-row lookup table. IT leadership is now asking for more tests.
What business value did the data quality tests deliver?
Money, trust, and a metric the company competes on. One test found a hotel 40 days silent on a service it was still billable for and had stopped using. Separately, monitoring email address changes exposed a site editing addresses into undeliverable ones, which would have quietly suppressed the satisfaction surveys behind their guest scores.
Why does a data quality number spike on the same day every week?
Because a human process runs on a weekly rhythm and the data records the process, not the intention. Guests check out on Sunday and the owner-operator clears the reservation on Monday morning when the hotel is quieter. The records are late rather than wrong, and any report that groups by reservation status on a Monday inherits the lag.
How do you profile a very large table without slowing production?
Move the work off the primary. Point the connection string at a read-only replica with ApplicationIntent, constrain the profiling workload with Resource Governor, keep TestGen’s thread count low at first, and profile views over recent data rather than a decade of history. This team profiles a charges table of more than 100 million rows this way.
Can a volume test detect a change in a small lookup table?
Not reliably. If a row is added and another removed in the same change, the row count is identical and a volume test sees nothing. For a 35-row tax table the options are a value match test, a schema test on the output of the ETL that consumes it, or a custom test that hashes the rows in a deterministic order so any edit moves the hash.
Can a failed data quality test stop a pipeline?
Yes, through the API and a job scheduler. This team’s scheduler, Control-M, can call the TestGen API, so a workflow can run its tests, read the result, and halt itself until a person reviews a failure. That is the difference between a test that reports bad data and one that stops bad data from moving downstream.
Who acts on the problems a data quality tool finds?
The business, which is why getting findings in front of leadership matters as much as generating them. Identifying an issue is technical work; deciding whether it matters is a business process, run by data stewards or a quality circle. This team’s database administrator presented his tests to IT leadership and came away with a queue of new requests.