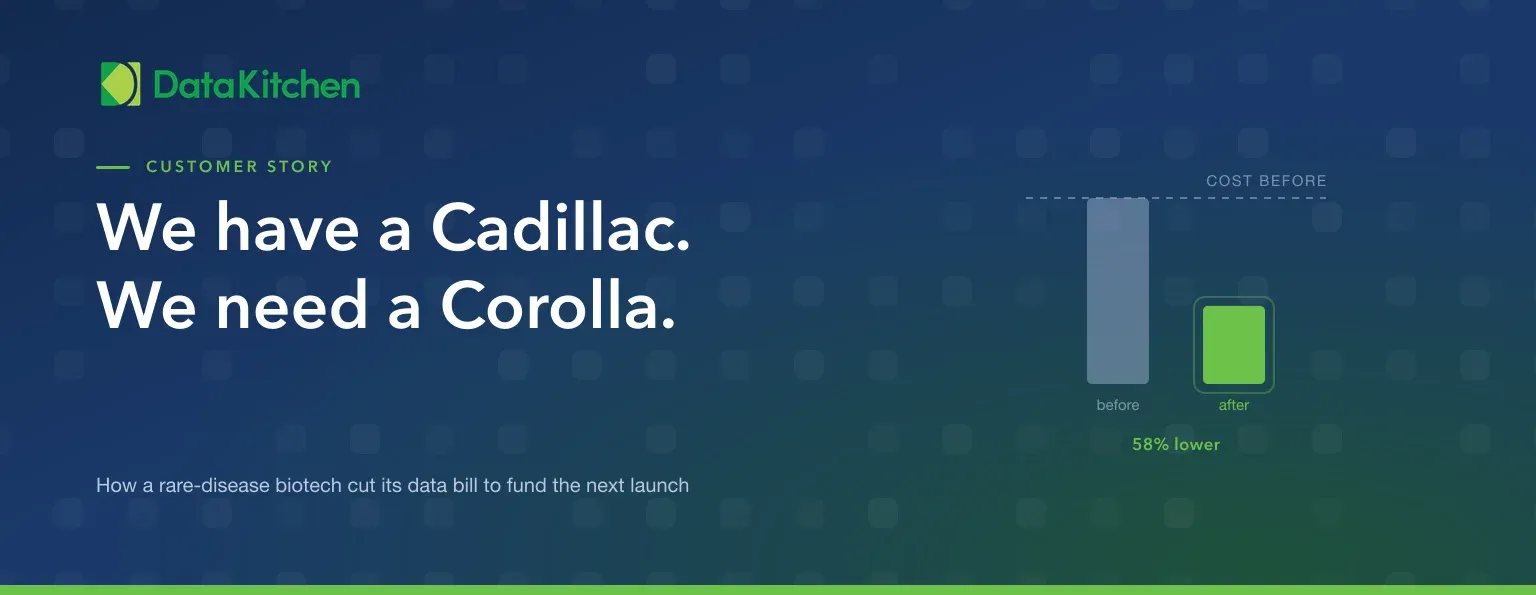
“We have a Cadillac. We need a Yugo.”
That was how the VP of technology at a rare-disease biotech described his commercial data operation the first time we spoke. He had fewer than a hundred patients on therapy, a second indication in phase III that would take him into the thousands, a finite runway, and a commercial team of about five people.
He was asking for a cheaper data warehouse, not a better one, because every dollar he stopped spending on running today’s data was a dollar available to launch tomorrow’s product.
He said Yugo, and we knew what he meant, but Yugo is not actually what he needed. A Yugo breaks. What he needed was a Corolla: unglamorous, right-sized, cheap to run, and boring in the specific way that means nobody gets a 2am phone call. That distinction matters, because a data platform that saves money by becoming unreliable hands the savings straight back the first time a launch report is wrong.
If the trade sounds familiar, we wrote the general version of it in your data and analytics bill is the easiest line to cut. This is what it looked like in practice.
The cloud bill was never the problem
His Snowflake averaged a bit over $700 a month. AWS ran a few thousand more.
Set that against what sat on top: two vendors, six to eight people between them, working out to three or four full-time equivalents, billing by the hour. One owned ingestion and the warehouse. The other owned the datamarts and the BI reports.
So the platform cost a few thousand a month and the labor around the platform cost roughly $30,000 a month. If you go looking for savings in your cloud invoice, you are auditing the small number.
The warehouse itself was about two years old, and at most 40% of it could be reused for the new indication. He was paying Cadillac prices to maintain something he would largely rebuild anyway.
Two vendors, one seam, nobody in charge of it
The split was conventional, and the problem it created is structural rather than anybody’s fault.
When a report came out wrong, the reporting vendor said the data arrived wrong. The ingestion vendor said the data matched the file spec they were given. Both were usually right. The only person who could see end to end was the director who had to referee it, and refereeing took him a couple of hours a day.
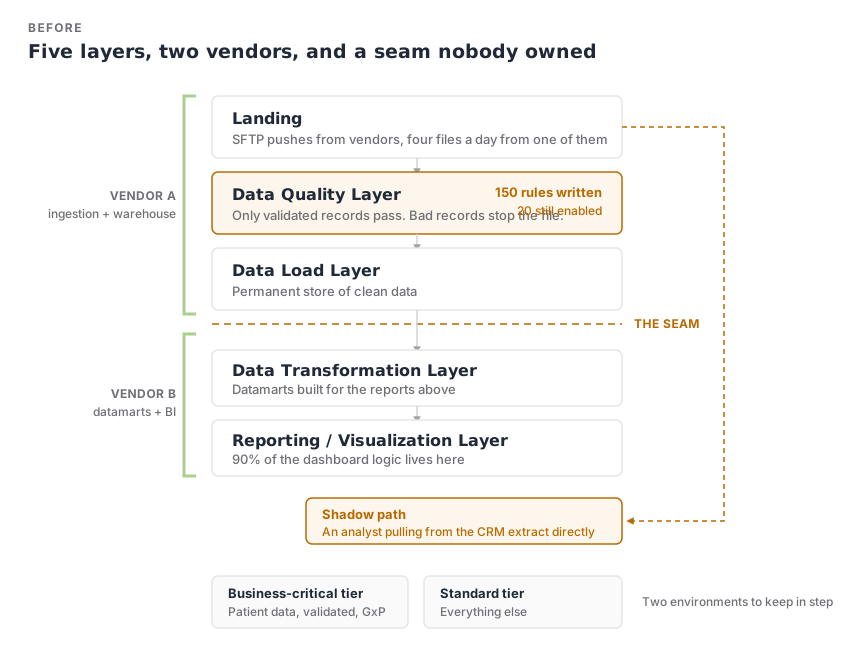 Figure 1: The conceptual architecture as we found it. Five layers, two owners, and a dashed line in the middle that neither contract covered.
We want to be fair about this, because it matters for anyone reading their own vendor scorecard: neither vendor was incompetent. One of them, by our customer’s own assessment, took blame for problems that were not theirs. The specialty pharmacy sending four files a day was the single biggest source of trouble, and it was slow to correct anything. Getting one fix landed took several rounds, and nobody in the chain held a service level agreement worth invoking. That pattern is common enough that we wrote it up separately in the commercial data most likely to be wrong.
What these files actually are
The specialty pharmacy sends four files a day: patient status, dispense, inventory, and demographics. The status file is an end-of-day snapshot, so a patient who moves through every stage in a single day arrives as four separate records.
That detail is the whole character of rare-disease commercial data. You are not sizing market share off a national prescription feed. You are tracking a few dozen people through consent, prior authorization, copay assistance, shipment, and refill. A wrong status on one of them is a person who does not get their drug on time. At this patient count, one bad record is a measurable fraction of the brand.
They influence prescribers without detailing
One assumption to correct, because it changes how every number in this post reads: this company has a commercial operation. It reaches prescribers through channels other than a rep knocking on doors.
For a few hundred patients scattered across thousands of possible prescribers, a traditional field force does not pay for itself. So the work runs through HCP websites, targeted display against NPI lists, third-party medical email, and medical liaison activity recorded in the CRM rather than sales calls.
That model is more data-dependent than detailing. A rep hands you a call note: one row, one prescriber, one date, already attributed. Non-personal promotion hands you thousands of anonymous digital events that somebody has to resolve to an NPI, reconcile against the HCP master, and then join to patient status to find out whether any of it moved a single patient. In that model the daily media analytics feed and the branded-versus-unbranded split in the website data are the measurement itself.
So the objection that this only worked because the operation was small has it backwards. The reporting was cheap to run because the work was automated, not because there was little of it. Attribution across a dozen digital channels with no rep to anchor it is the harder version of the problem, and it is the version more small brands are going to be running.
So they turned off the alarms
The warehouse shipped with 150 automated data quality checks. About 20 were still switched on when we arrived.
Nobody decided to stop caring. The checks fired every morning, most failures traced to the same handful of upstream problems, and every failure stopped a file. So the team did what any team does when the alarm goes off daily for a month. They disabled the loudest ones and kept the few they could live with.
By then one report was showing an email open rate of 181% and nobody had flagged it, which tells you how closely anyone was reading the reports. An analyst on the commercial team had quietly started pulling from the CRM to build her own numbers. She never circulated them. She just needed something she could defend in a meeting.
That is the part of bad data that never appears on an invoice. You pay two vendors to produce reports the business has stopped believing, while the person closest to the data rebuilds them by hand.
Cutting reports cut the bill, not the cost
He had already taken two rounds of savings before we got there, and both worked the same way.
The refresh moved from daily to weekly, and hours dropped. The report count went from 41 to 10, and hours dropped again. Of those 41 screens, his own estimate was that eight mattered, so the pruning was justified.
What never changed was the cost of producing one report. The savings ran out exactly when the reports did, and the next round would have to come out of the 10 that were left. That is the end of the road for cutting scope. Eventually you reach the reports somebody uses.
This matters for reading the cost number later in this post. We measure the 58% against the 10, not against the 41. By the customer’s own count nobody was reading the other 31, so the comparison is a real workload against a real workload rather than a full operation against a gutted one. And the workload has grown since: the same team absorbed the second indication’s data work without the hours going up.
The line item nobody had questioned
Here is the one that generalizes furthest. A large share of the old bill existed because everything ran as regulated data.
That is the correct price for clinical data. It is the wrong price for sales reporting, specialty pharmacy status files, and web analytics. Validated environments charge change control, documentation, and qualification overhead on every change, and applying that to a weekly commercial dashboard means paying clinical-grade process cost for something no regulator will ever ask to see.
Separating the two, so each carries the controls it actually needs, was a real piece of the savings before anyone rewrote a line of code.
One vendor, fixed price, and a budget line for making it better
They consolidated to a single vendor and took the transition in 30 days of planning followed by an 11-week fixed-price implementation, which put the handover itself in 2026. We took over everything between the vendor SFTP drop and the BI report: ingestion code, the warehouse, transformations, datamarts, the reports themselves, the credentials, and the daily triage when a file lands late or wrong.
We did not win this on price. We came in a little higher than the incumbents’ discounted renewal, and he chose us with his eyes open, because the discount was another round of scope cutting and he had run out of scope to cut.
After cutover, a standing team of about two people runs it. One on operations, one on automation and improvement. That second person is the whole argument. Without a budget line for making things better, a managed service is the same hourly triage with a different logo on the invoice.
The rate is flat and set at scoping, and it scales down if the launch slips, on 30 days notice. Nobody gets penalized for an FDA delay they did not choose. We work in their cloud and the code sits in their repo, so none of this is hostage to us staying.
What is not in there: no claims data, no IQVIA or Symphony, no formulary feed. For an in-market rare-disease brand with a handful of patients per prescriber, targeting off a claims universe matters far less than knowing exactly where each enrolled patient is today. That calculus changes with the second indication, which takes the population from under a hundred into the thousands, and we scoped the claims and physician-reference work for it rather than retrofitting it later.
How the number actually came down
Consolidating vendors removes the seam. On its own it does not make the work cheaper. What made it cheaper was changing how the work gets done.
Our engineers run Claude Code inside our DataOps, FITT, and data testing framework, so the AI writes the SQL transforms and the data quality tests while the engineers spend their time on what to build and on talking to the customer. TestGen generates tests against the datasets instead of waiting for somebody to hand-write them. FITT data architecture is why the pipeline does not fall over at 2am the night before a board meeting.
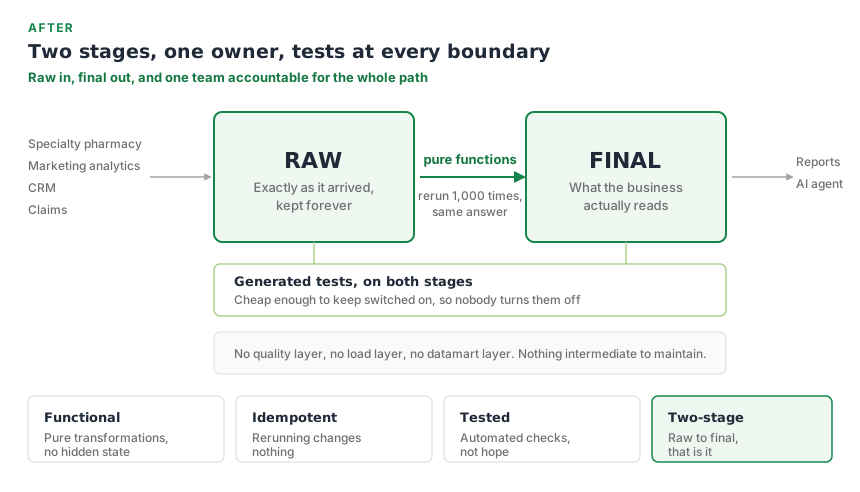 Figure 2: The same operation on a FITT architecture. Raw to final, one owner end to end, and the three middle layers gone along with the seam that ran through them.
That is also the real answer to the 150 rules nobody could live with. Generated tests are cheap enough to keep. A generated test that fires on a genuine upstream problem gets escalated to the vendor sending the file, rather than switched off because triaging it by hand costs more than the error does.
This is the move from buying analyst hours to owning an engineered system, and it is the whole reason the savings do not expire.
Be precise about the goal here, because “we reduced hours” is what every vendor says at renewal. Cutting hours by making people work faster is a treadmill. Those hours come back the week a new feed arrives or somebody asks for one more report, because the work was never removed, only compressed.
The goal is to delete the work. A file that gets patched by hand every month is a permanent human obligation, and you are paying for it forever whether the invoice says so or not. The same file with a generated test, an automated rule, and a fixed upstream cause is work that nobody has to do again, this month or in three years. Efficiency means the hour is gone, not that somebody is running faster through it. That is also why the savings survive the business asking for more: automation absorbs the next dataset, and a bigger bench does not.
What it produced
The annual cost of running that commercial data fell by about 58%.
Monthly hours have trended down since cutover. In the same period the team absorbed the data work for the second indication, so the reporting load went up while the run cost came down.
The issue log tells the same story from the other end. Under the prior vendors it recorded 30 data issues in 2024, from May when the log opens, and 43 in 2025, seven of which were still open on the day the operation transferred. Since the handover, it records none.
Zero needs explaining, because it is not a claim that the incoming files got clean. They did not. The specialty pharmacy still sends what it has always sent. What changed is where a bad file stops. The generated tests catch it in the pipeline, the fix goes in, and the data is published after that, not before. The log counts issues that reached somebody. Under the old arrangement a bad file became a wrong number, then a ticket, then several rounds with the vendor. Now it becomes a failed test and a change nobody downstream ever sees.
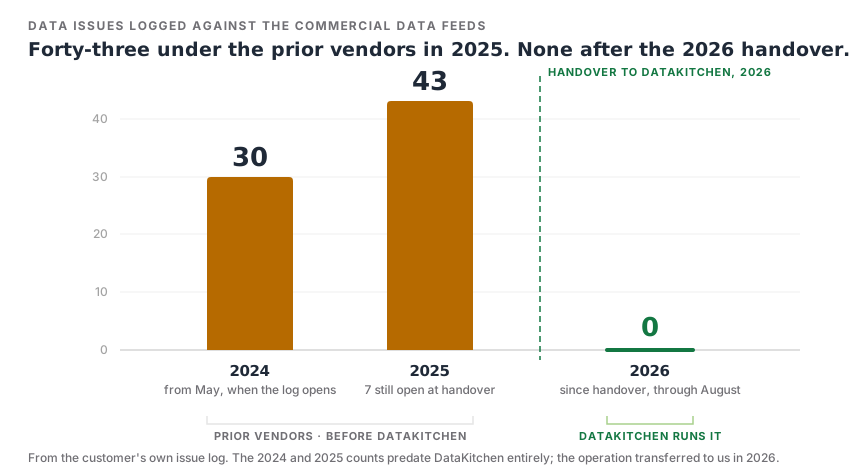 Figure 3: To be clear about the attribution, the 2024 and 2025 issues are not ours. They were logged under the prior vendors, before DataKitchen was involved at all. The operation transferred to us in 2026, and the log has stayed empty since.
At the most recent quarterly review, the customer’s own summary was that he likes how quality fixes get operationalized instead of patched for the month. That distinction is why the number holds, and it is the same argument we make about testing commercial pharma data, measured in dollars instead of defects.
The savings also bought something the old operation could never have carried. With the data engineered and tested underneath, we built them an agent over it so the commercial team can ask questions in plain language instead of queueing a report request. Point a chatbot at an untested warehouse and it answers confidently and wrongly. Point it at this one and it has context to work from.
We also earned something that does not show up as a cost saving: permission to talk to the specialty pharmacy directly about its data quality. Nobody hands a new vendor that access in month one.
And the money went where it was supposed to go. The savings from running the approved product’s data are funding the data work for the indication that takes this company from under a hundred patients to thousands.
If this looks like your operation
Forget the cloud bill. The tell is the ratio between hours your team spends proving whose fault a number is and hours spent making the number better.
If ingestion and reporting sit with different vendors and both bill hourly, that ratio works against you and gets worse as you add data. If your commercial analytics runs under clinical-grade controls, you are paying for assurance the work does not require. And if somebody on your team keeps a private spreadsheet they trust more than the dashboard, the reports have already lost.
Our commercial pharma analytics practice exists to bring in a dedicated commercial data team and take that layer over, which is the pattern behind the $100 billion secret and how DataOps is transforming commercial pharma analytics. If you already have a product in market and you are trying to free cash for the next launch, taking over an existing operation is its own offer. For the methodology rather than the pitch, Data Quality: The DataOps Way is the full version.
FAQ
What are the key points in this blog?
A rare-disease biotech needed runway to fund a second indication. Its Snowflake bill averaged a bit over $700 a month and AWS a few thousand more, but two vendors billing hourly wrapped three to four full-time equivalents around it, and nobody owned the seam between ingestion and reporting. Consolidating both scopes into one managed service cut the annual cost of running that data by about 58%, and monthly hours kept falling after the second indication’s data work was added.
Where does the money actually go in commercial pharma data operations?
People, not platforms. This company’s Snowflake averaged a bit over $700 a month and AWS a few thousand more. Against that, two vendors fielded six to eight staff working out to three or four full-time equivalents, billed hourly. If you are hunting savings in your cloud invoice you are auditing the small number.
Why do data teams switch off their own data quality rules?
Because the rules fire on the same upstream problem every morning and each failure blocks a file. When triaging a check costs more than absorbing the error, somebody disables it. This team went from 150 enabled checks to about 20. More rules will not fix that. Generating tests cheaply enough to keep, and fixing the upstream cause, will.
Does treating commercial data as regulated data raise the cost?
Substantially, and it is one of the largest avoidable line items we see. Validated environments carry change control, documentation, and qualification overhead on every change. That is the right price for clinical data and the wrong price for sales reporting, specialty pharmacy status files, and web analytics. Separating the two lets each carry the controls it needs.
Is cutting the number of reports a real way to cut data costs?
It cuts the bill, not the cost. This team’s prior vendors took reports from 41 to 10 and moved the refresh from daily to weekly, and hours fell both times. The cost of producing one report never changed, so the savings ran out when the reports did. Automation changes the unit cost. Nothing else does.
Does consolidating data vendors save money by itself?
No. Consolidating removes the seam nobody owned, which stops the refereeing, but the work costs what it costs until you change how it is done. The savings here came from generating data quality tests rather than hand-writing them, AI writing the SQL transforms while engineers decide what to build, and an architecture that does not fail at 2am.
What data sources does a commercial pharma launch analytics operation integrate?
About 20 datasets across 13 source systems. The specialty pharmacy sends four files a day: patient status, dispense, inventory, and demographics. Veeva CRM carries field activity, territory alignment, and sales goals, Veeva Network the HCP master, and Veeva Vault medical communications. Salesforce Marketing Cloud and Health Cloud cover patient email and patient status, a logistics provider sends inventory and receivables, a marketing agency sends web analytics daily, and NetSuite feeds finance.
Why would the count of logged data issues drop to zero?
Because the tests catch the bad file before the data is published, so the issue never reaches anyone who would log it. The incoming files did not get clean. The specialty pharmacy sends what it always sent. Under the old arrangement a bad file became a wrong number, then a ticket, then several rounds with the vendor. Now it fails a generated test and the fix ships first.
How do you measure promotion in rare disease without a sales force?
By resolving digital events to prescribers and then joining them to patient status. With a few hundred patients across thousands of possible prescribers, a field force does not pay for itself, so promotion runs through HCP websites, targeted display, and third-party medical email. That produces thousands of anonymous events a day rather than attributed call notes, which makes the reconciliation harder, not easier.
How can a data operations bill fall while the reporting load goes up?
Only if the fixes are permanent. Patch a bad file by hand and the effort recurs every month, and every new dataset adds to the pile. Give the same problem a test, an automated rule, and an upstream conversation, and it stops consuming hours. This account absorbed a second indication’s data work while monthly hours trended down.