Organizational complexity creates significant problems, but executives in a McKinsey Survey showed little understanding of the types of complexity that create or destroy shareholder value. In their research, McKinsey identified two types of complexity:
- Institutional complexity – includes regulatory environments, geographies, new markets, number of business units and their diverse interactions. Executives focus almost exclusively on this type of complexity.
- Individual complexity – how hard it is for employees and managers to “get things done” due to inadequate role definitions, ambiguous accountability, inefficient processes, and lack of skills and capabilities. Executives rarely understand the factors that create this type of complexity and how to address them.
While these two are related, McKinsey found that companies reporting low levels of individual complexity have higher returns and lower costs. Furthermore, lowering individual complexity enables organizations to meet the challenges of additional institutional complexity that often accompanies growth. The message is that reducing and managing organizational complexity at the level of individual contributors and first-level managers can serve as a competitive advantage and a foundation for successful growth.
The Complexity of Data Teams
No group within the modern enterprise faces a higher level of individual complexity than the data organization. With its cacophony of tools, mission-critical deliverables, and interaction with nearly every other group in the organization from marketing to accounting to the CEO, the data organization has become incredibly challenging to lead and manage. Despite their valuable expertise, data professionals are routinely dealing with project failures, slipping schedules, busted budgets and embarrassing errors. It has become increasingly hard to “get things done” in data organizations.
Sources of Data Organization Complexity
There is a wide range of roles and functions in the data organization of a typical enterprise, that share the mandate to use data in descriptive and predictive analytics. The team includes data scientists, business analysts, data analysts, statisticians, data engineers, architects, database administrators, governance, self-service users and managers. Each of these roles has a unique mindset, specific goals, distinct skills, and a preferred set of tools.
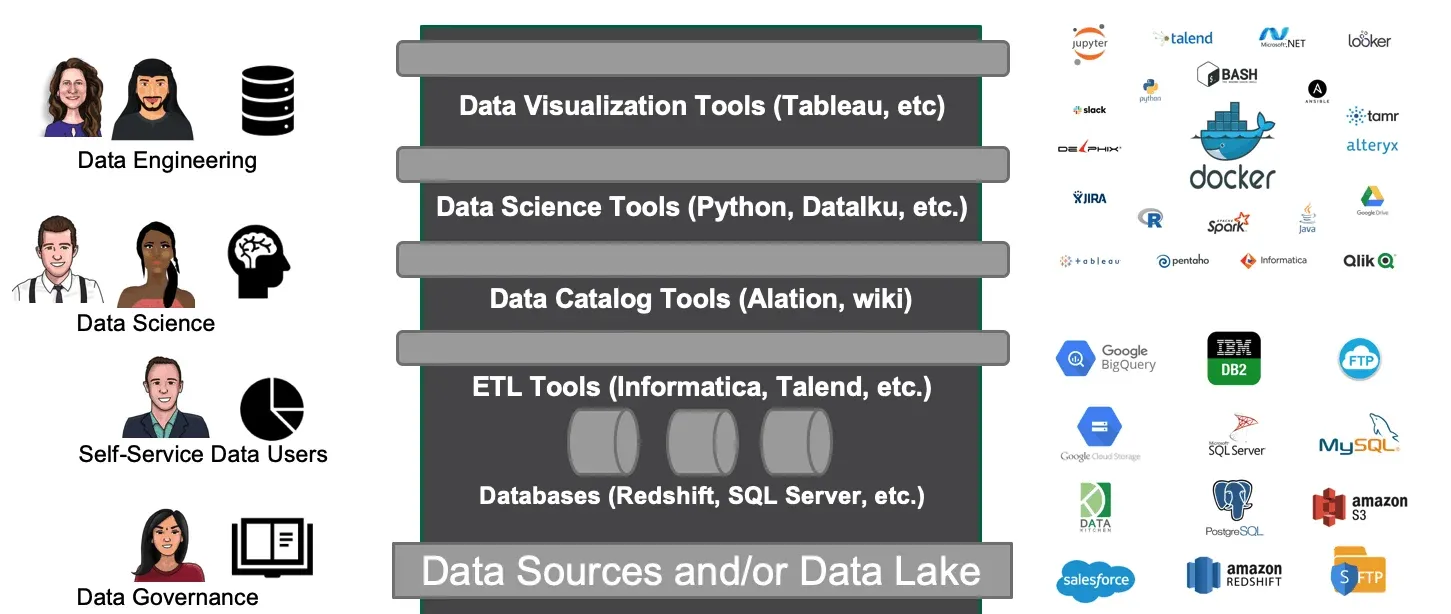
Figure 1: The fast-growing market for big data and analytics tools is around $200B. At the enterprise level, the array of tools is broad and fragmented.
Despite all of the complexity and diversity which pushes them apart, the roles of the data team are tightly and intricately woven together. Each stage of the data pipeline builds upon the work of previous stages (see Figure 2). While the work of each functionary is distinct, they are linked together in a value chain. To make matters more interesting, the members of the data team, in most cases, do not report to the same boss. Some will report into a shared, technical services team. Others fall under a line of business. The various functions may be centralized or decentralized, and individuals and teams may be geographically dispersed. All of these variables affect the communication patterns and workflow of the data team.
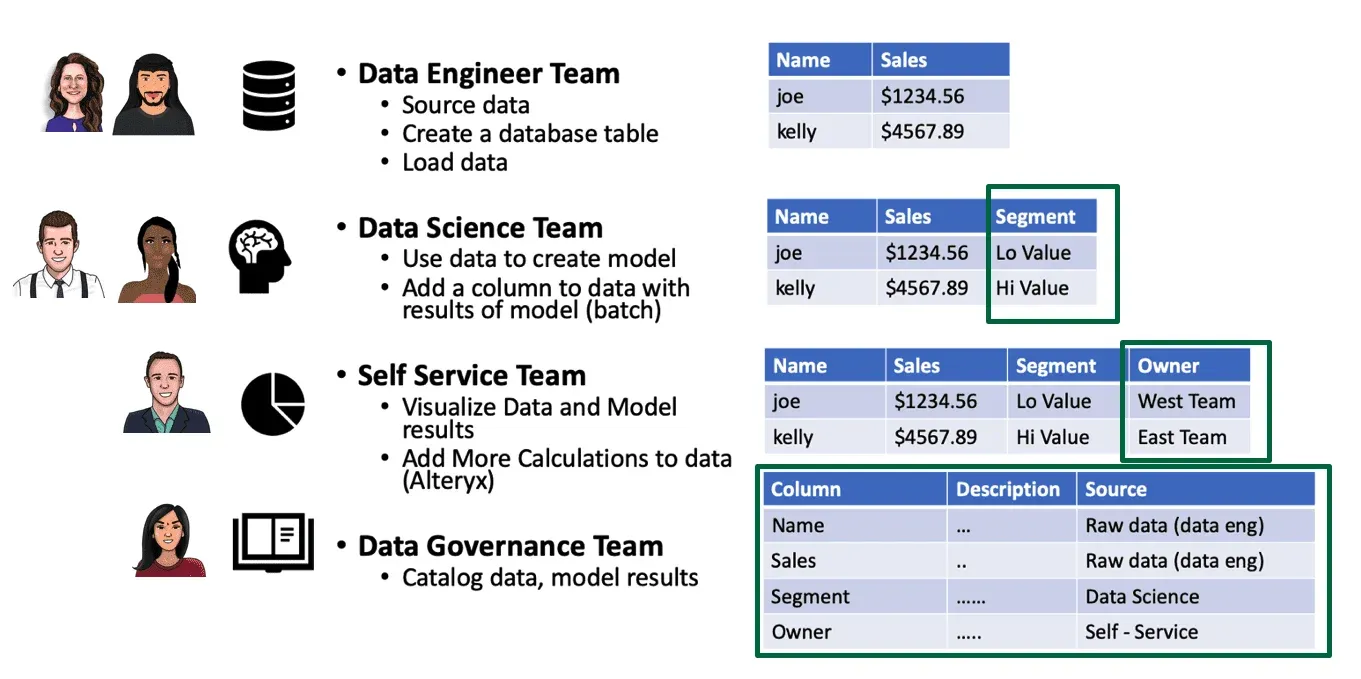
Figure 2: The work output of individuals in the data team builds as data moves through the data pipeline.
Managing Complexity with DataOps
If one were to actually map out these communication and task coordination patterns in a real organization, the resulting diagram would quickly exceed the space allowed here. Imagine having to manage these groups, keeping them on track and under budget. Imagine what would happen if corrupted data entered the bloodstream of the organization and then dispersed throughout the data pipelines. These are real challenges faced by data team managers daily. This is the type of internal organizational complexity that can destroy shareholder value or prevent an enterprise from meeting its objectives.
We’ve helped numerous organizations tackle these challenges using a methodology called DataOps. DataKitchen produces a DataOps Platform that will help move your DataOps capabilities from the whiteboard into the data center in the shortest amount of time possible. DataOps utilizes automation to govern workflows, coordinate tasks and define roles. It creates teamwork out of chaos and makes it easier to “get things done.” DataOps greatly simplifies the level of individual complexity in an organization.
A DataOps Platform attacks the problem of organizational complexity from multiple sides. It eliminates data and coding errors by applying tests at all pipeline stages. These tests drive sensor indicators which provide unprecedented transparency into data operations and analytics development. The DataOps platform also defines, manages and coordinates all the data pipelines, so teams collaborate better, and new analytics move into deployment with greater ease.
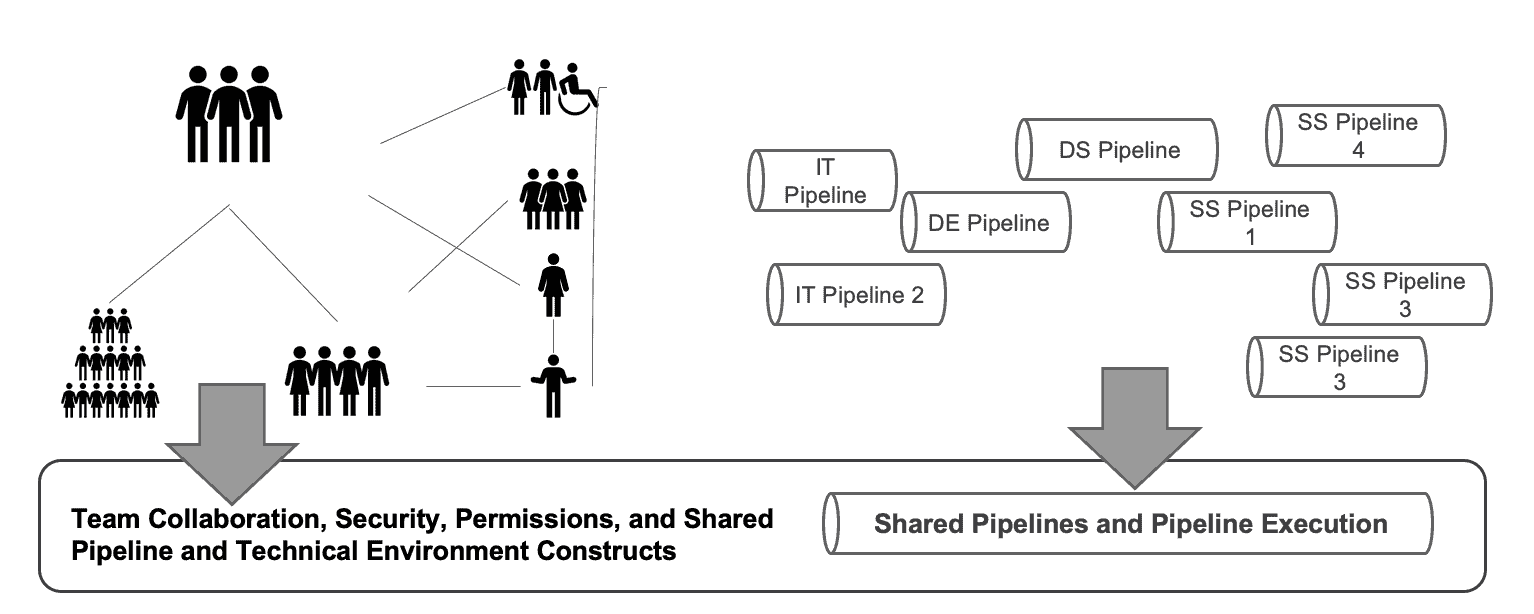
Figure 3: A DataOps Platform enforces clear workflows that enable better team collaboration and brings greater structure, transparency and automation to data pipelines.
Cycle Time at the Speed of Ideation
Fundamentally, the quantities and uses of data are expanding and proliferating so rapidly that enterprises are unable to use conventional management methods to “tame the beast.” To reduce individual complexity in an organization, you first need to measure it. The key metric that reflects complexity is analytics cycle time – the time it takes to transition an idea into working analytics. The challenge here is that your business users want cycle time to be as fast as ideation. That may sound impossible, but DataOps delivers on that goal.
A DataOps Platform reduces workflow inefficiencies, encourages reuse and brings transparency to data pipelines. Tests clamp down on code and data errors, eliminating unplanned work that saps productivity. The key to reducing complexity in your data organization is DataOps. The key to implementing DataOps is a DataOps Platform that enforces DataOps methods across data teams and self-service users.
For a more in-depth discussion of ‘individual complexity’ in data organizations, please see our whitepaper “Reducing Organizational Complexity with DataOps,” which inspired this blog post.
FAQ
What are the key points in this blog?
Data teams carry more individual complexity than almost any other group, and most of it is self-inflicted rather than institutional. McKinsey separates institutional complexity, meaning regulation and geography, from individual complexity, meaning the friction a person hits doing their job. DataOps attacks the second kind with automation, testing, and clear workflows, which is the half a data leader can actually change.
What is organizational complexity in a data team?
Organizational complexity is the accumulated friction between a person and finished work: handoffs between teams, manual approval steps, environments that do not match, and tools nobody owns. McKinsey distinguishes institutional complexity, which comes from regulation and geographic spread, from individual complexity, which is what an employee experiences daily. Data teams score badly on the second.
How does DataOps reduce complexity?
By automating the steps people currently perform by hand and by testing so that verification stops being a meeting. Automated deployment removes the coordination tax on every release. Automated testing removes the review cycle where three people manually check the same numbers. What is left is a shorter path between an idea and a result somebody can use.
Why do data teams have more complexity than other teams?
Because they sit between every system in the company and answer to every department in it. A software team owns its codebase; a data team inherits schemas from systems it does not control, serves consumers with conflicting definitions, and gets blamed for upstream failures. Each new source and each new consumer multiplies the coordination rather than adding to it.
What is cycle time in data analytics?
Cycle time is how long it takes an idea to become something a user can act on. It is the single metric that exposes complexity, because every handoff, approval, and manual verification step shows up in it. Teams that shorten cycle time are usually not working faster; they have removed steps that were never adding anything.
How do you start reducing complexity on a data team?
Pick the step your team repeats most by hand and automate that one first, since repetition is where the compounding cost lives. Deployment and testing are the usual answers. Measure cycle time before and after so the improvement is visible to someone outside the team, which is what buys permission to keep going.