Abstract
If the groups in your data-analytics organization don’t work together, it can impact analytics-cycle time, data quality, governance, employee retention and more. A variety of factors contribute to poor teamwork.
Sometimes geographical, cultural and language barriers hinder communication and trust. Technology-driven companies face additional barriers related to tools, technology integrations and workflows which tend to drive people into isolated silos.
The Warring Tribes of the Typical Data Organization
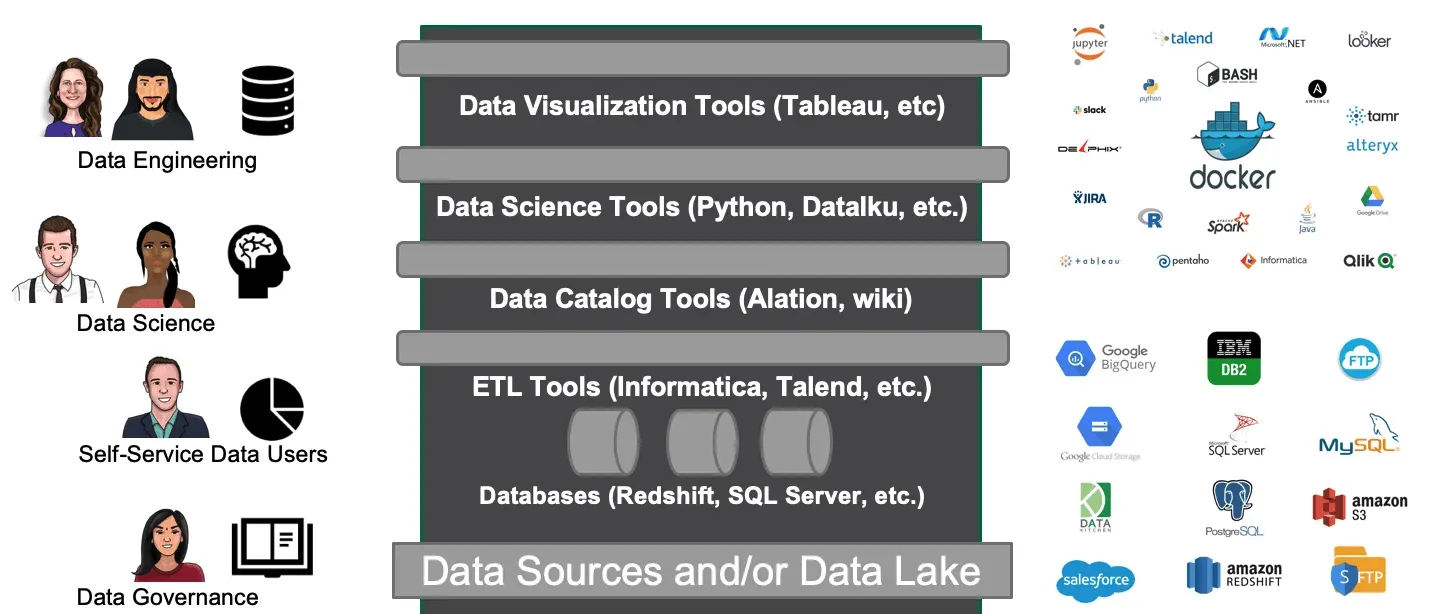
The data organization shares a common objective; to create analytics for the (internal or external) customer. Execution of this mission requires the contribution of several groups. These groups might report to different management chains, compete for limited resources or reside in different locations. Sometimes they behave more like warring tribes than members of the same team.

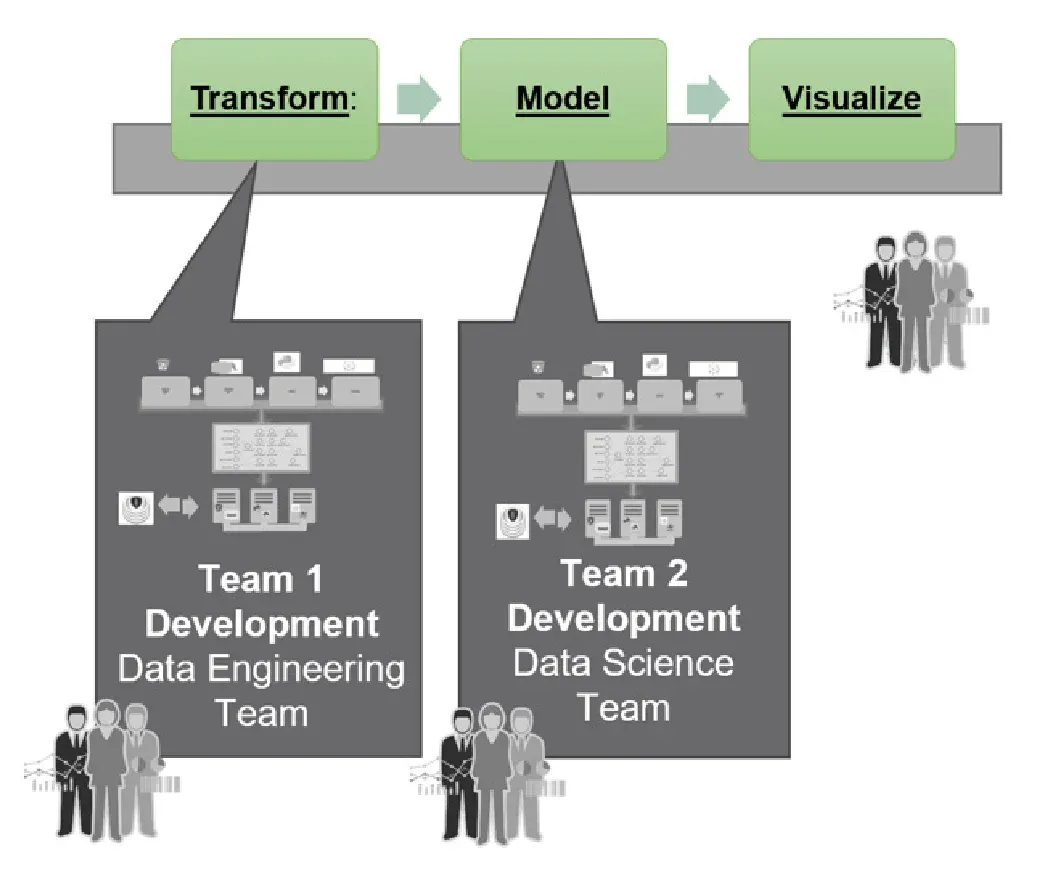
Let’s explore some of the factors that isolate the tribes from one another. For starters, the groups are often set apart from each other by the tools that they use. The figure below is the same value chain, reconstructed from the perspective of tools.
To be more specific, each of the roles mentioned above views the world through a preferred set of tools:
- Data Center/IT — Servers, storage, software
- Data Science Workflow — Kubeflow, Python, R
- Data Engineering Workflow — Airflow, ETL
- Data visualization, Preparation — Self Service tools, Tableau, Alteryx
- Data Governance/Catalog (Metadata management) Workflow — Alation, Collibra, Wikis
The day-to-day existence of a data engineer working on a master data management (MDM) platform is quite different than a data analyst working in Tableau. Tools influence their optimal iteration cycle time, e.g., months/weeks/days. Tools determine their approach to solving problems. Tools affect their risk tolerance. In short, they view the world through the lens of the tools that they use.
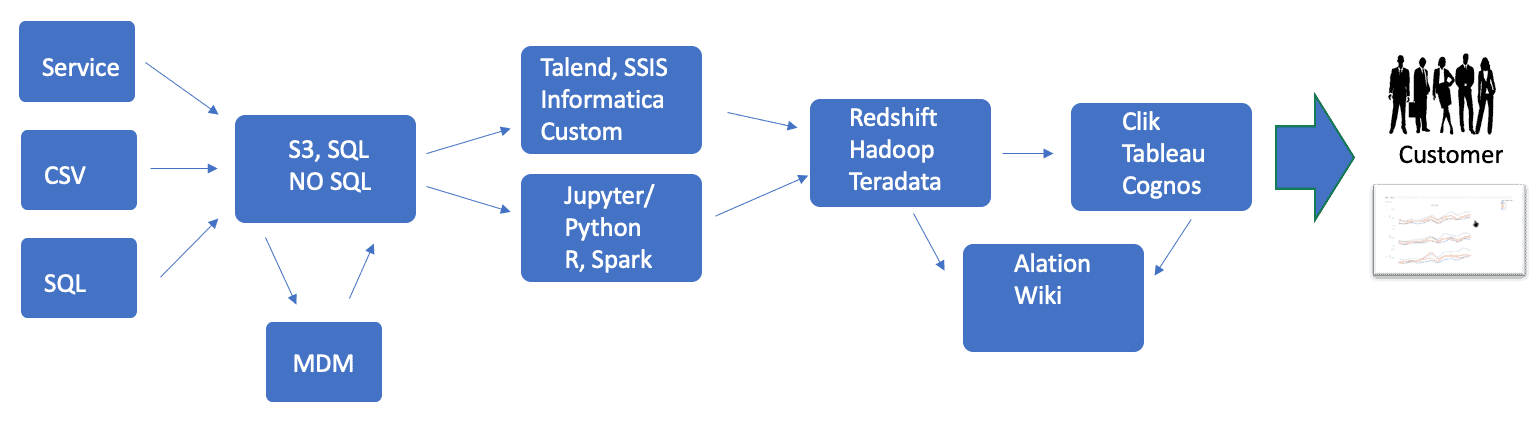
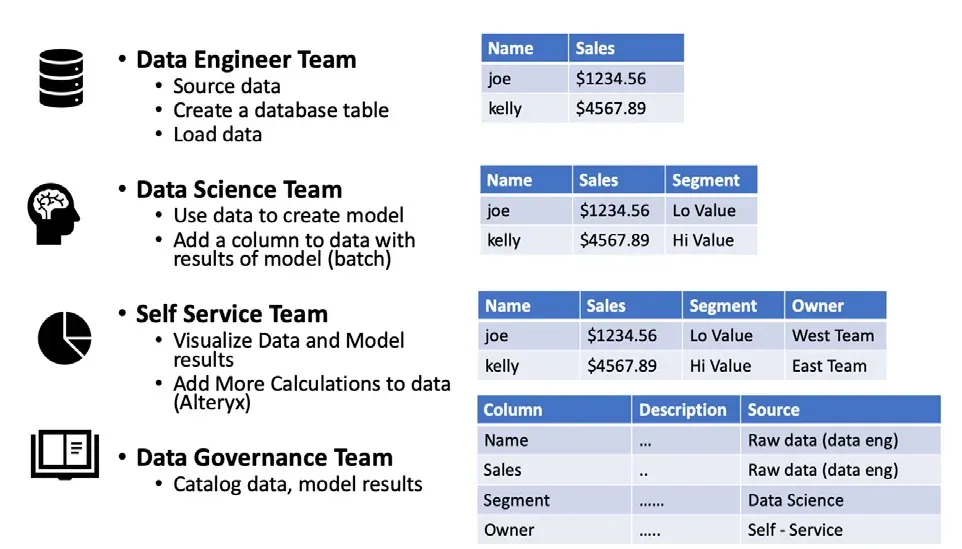
The division of each function into a tools silo creates a sense of isolation which prevents the tribes from contemplating their role in the end-to-end data pipeline. The less they understand about each other, the less compelling the need to communicate about actions taken which impact others. Communication between teams (people in roles) is critical to the organization’s success. Most analytics requires contributions from all the teams. The work output of one team may be an input to another team. In the figure below, the data (and metadata) build as the work products compound through the value chain.
In many enterprises, there is a natural tendency for the groups to retreat into the complexity of their local workflow. In the figure below, we represent the local workflow of each tribe with a directed-acyclic graph (DAG).
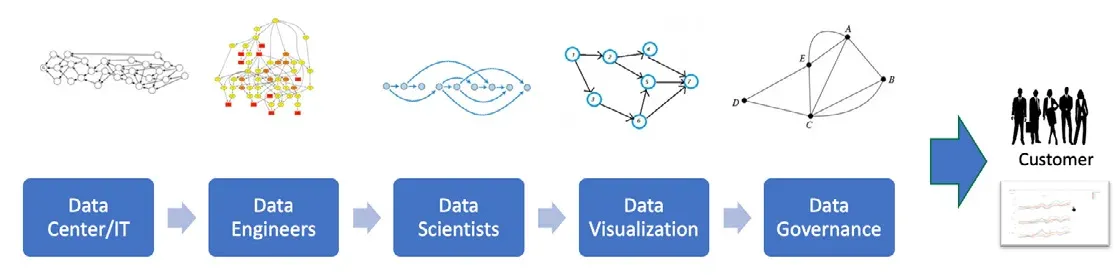
It is too easy to overlook the fact that the shared purpose of these local workflows is to work together to publish analytics for end-customers.
Other Factors that Increase Group Isolation
Group isolation is also induced by platforms, release cadence and geographic locations. The example below shows a multi-cloud or multi-data center pipeline with integration challenges.
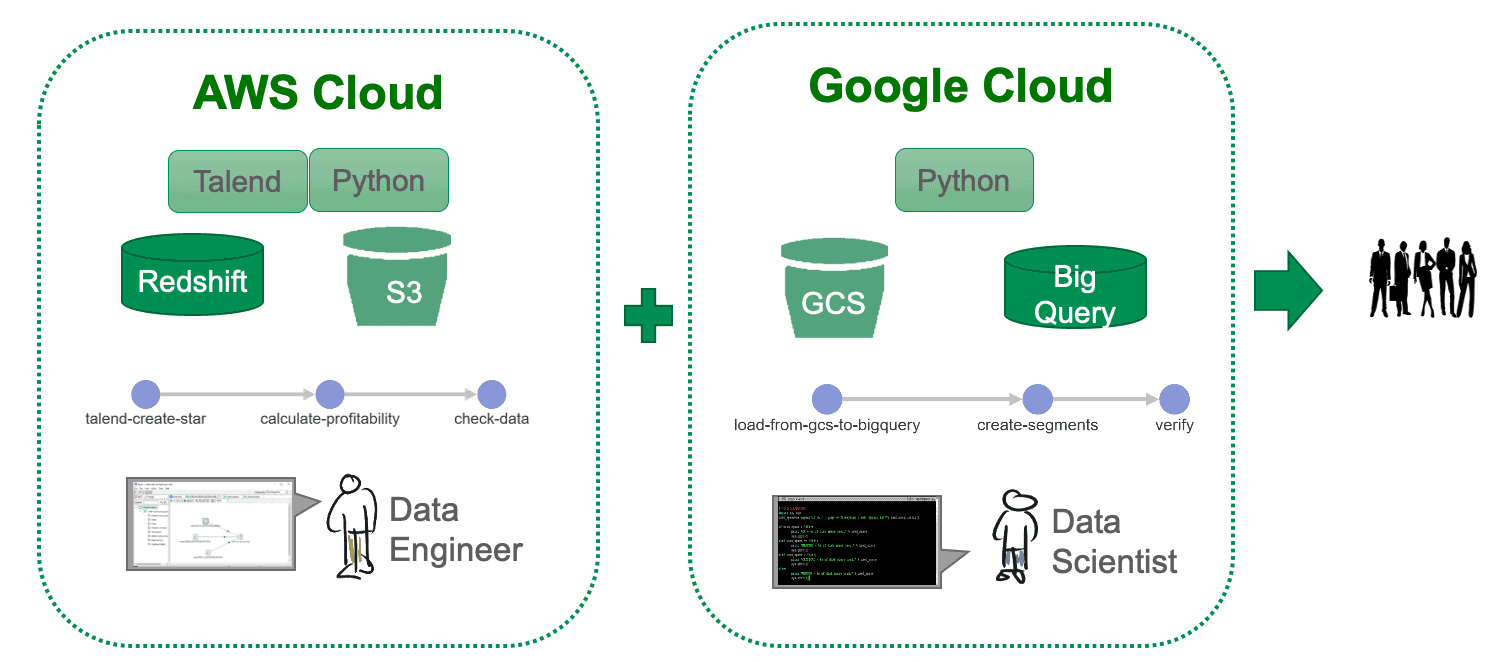
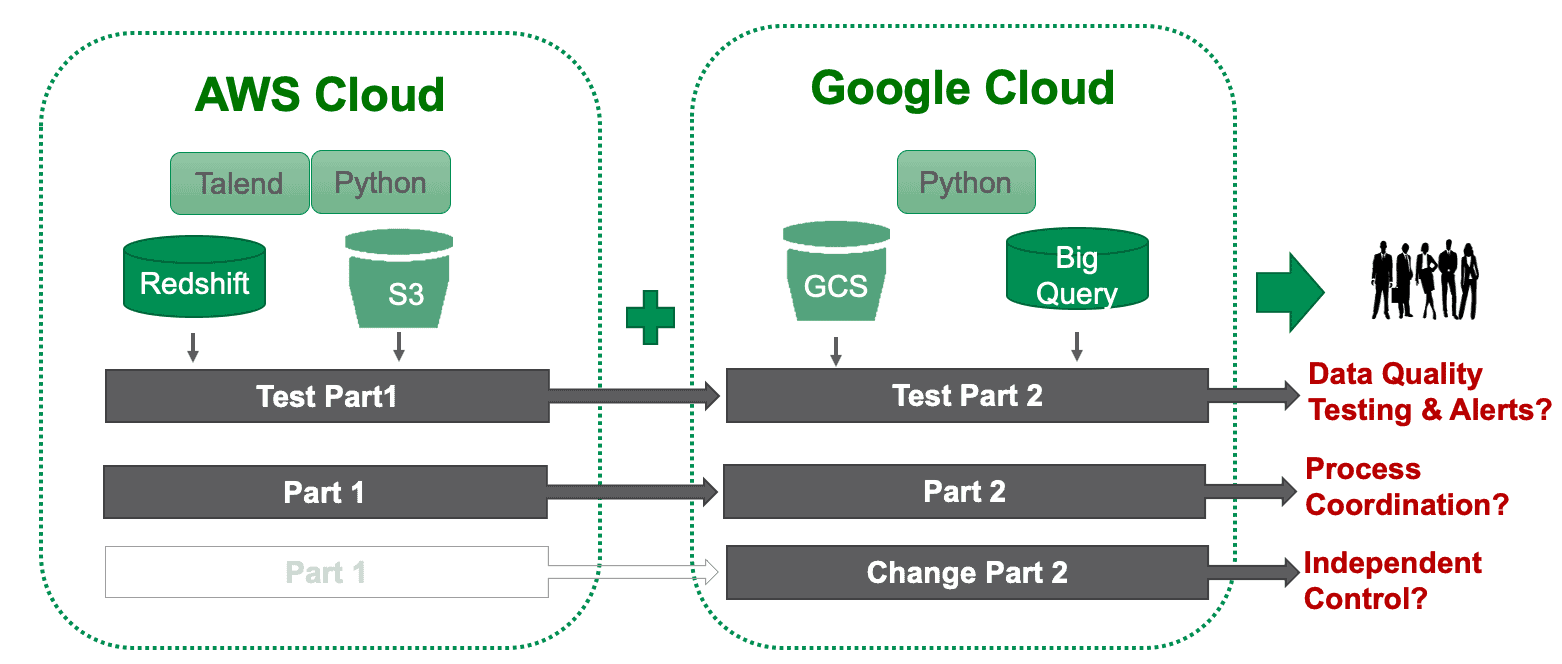
The two groups managing the two halves of the solution have difficulty maintaining quality, coordinating their processes and maintaining independence (modularity). Group one tests part one of the system. Group two validates part two.
Do the part one and two tests deliver a unified set of results (and alerts) to all stakeholders? Can tests one and two evolve independently without breaking each other? These issues repeatedly surface in data organizations.
In another example, assume that two groups are required to work together to deliver analytics to the VP of marketing. The home office in Boston handles data engineering and creates data marts. Their iteration period is weekly. The local team in New Jersey uses the data marts to create analytics for the VP of Marketing. Their iteration is daily (or hourly).
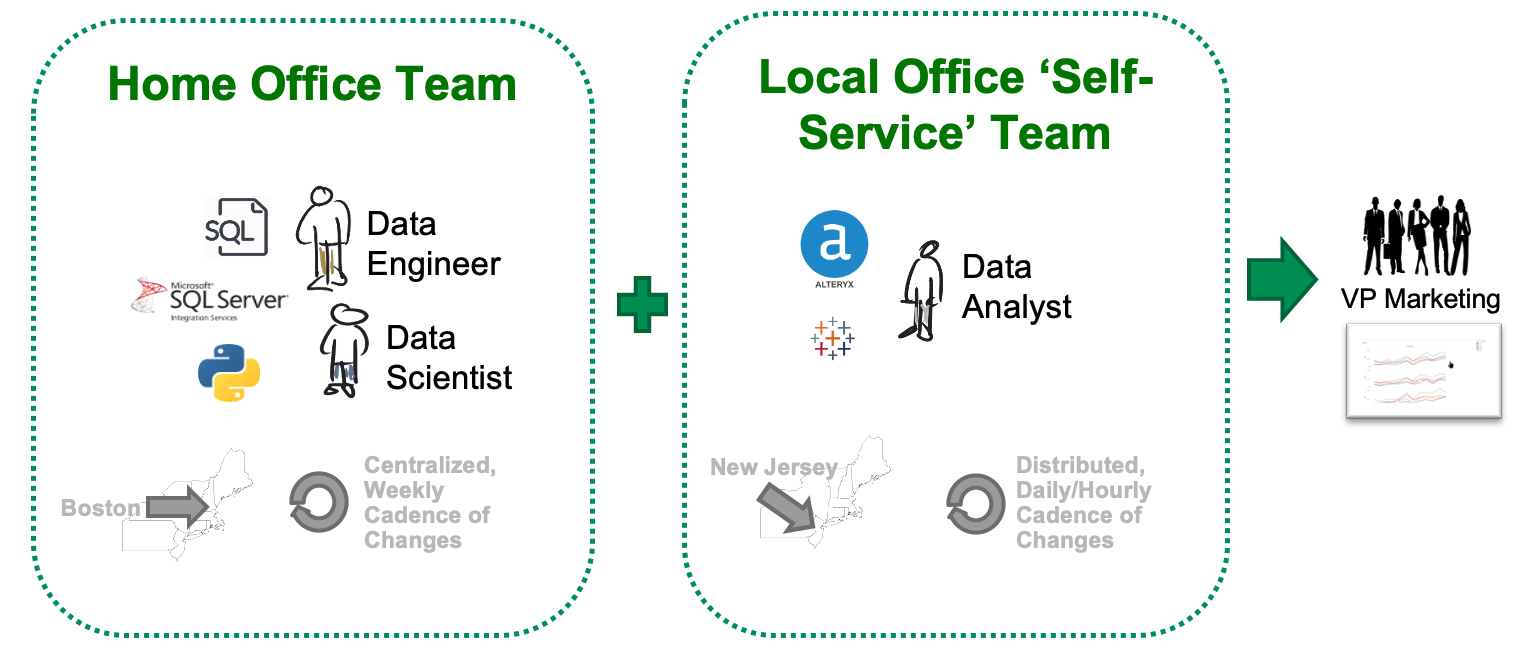
One day, the VP of Marketing requests new analytics (deadline ASAP) from the data analysts for a meeting later that day. The analysts jump into action, but face obstacles when they try to add a new data set. They contact data engineering in Boston. Boston has its own pressures and priorities and their workflow, organized around a weekly cadence, can’t respond to these requests on an “ASAP” basis.
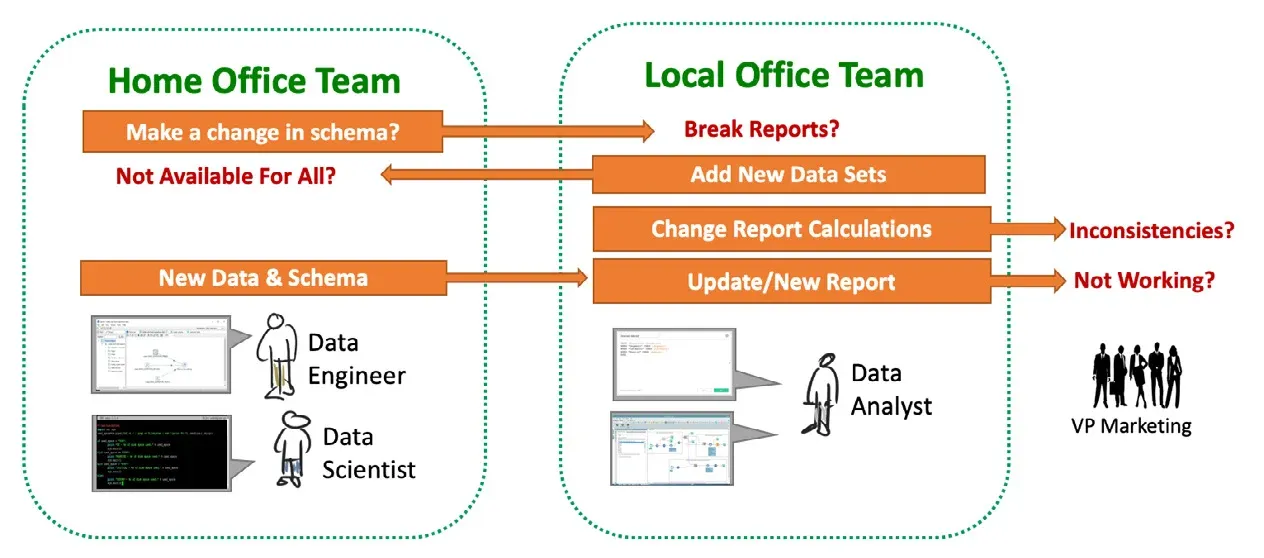
The home office team in Boston finally makes the needed changes, but they inadvertently break other critical reports. Meanwhile, out of desperation, the New Jersey team adds the required data sets and updates their analytics. The new data sets are only available to New Jersey, so other sites are now a revision behind. New Jersey’s reports are inconsistent with everyone else’s. Misunderstandings ensue. It’s not hard to imagine why the relationship between these groups could be strained.
These challenges may seem specific to data organizations, but at a high level, everything that we have discussed boils down to poor communication and lack of coordination between individuals and groups. As such, we can turn to management science to better understand the problem and explore solutions.
NOTE
The intra-team version of this problem — coordination within a single data team rather than between groups — is covered in Improving Teamwork in Data Analytics with DataOps.
Relational Coordination
Strip away the technological artifacts from the situations described above and you are left with an organization that cannot foster strong role relationships and communication between employees. These challenges are not unique to technology-driven organizations. Many enterprises across a wide variety of industries face similar issues.
For those who don’t remember, the airline business in the 1980s and 1990s was brutally competitive, but during this same period, Southwest Airlines revolutionized air travel. By the early 2000s, they had experienced 31 straight years of profitability and had a market capitalization greater than all the other major US airlines combined. Brandeis management professor Jody Hoffer Gittell investigated the factors in Southwest Airlines’ performance and, back in 2003, published a quantitative, data-driven analysis shedding light on Southwest’s success.
Dr. Gittell surveyed the major players in the airline industry and found a correlation between key performance parameters (KPP) and something that she termed Relational Coordination (RC), the way that relationships influence task coordination, for better or worse.
Relational coordination is communicating and relating for the purpose of task integration — a powerful driver of performance when work is interdependent, uncertain and time constrained.
Jody Hoffer Gittell
In her study, higher RC levels correlated with better performance on KPPs, even when comparing two sites within the same company. Since that time RC has been applied in industries ranging from healthcare to manufacturing across 22 countries.
One common misconception is that RC focuses on personal relationships. While personal relationships are important, RC is more concerned with the relationship of roles and workflows within the organization. RC studies how people interact and exchange information in executing their role-based relationships.
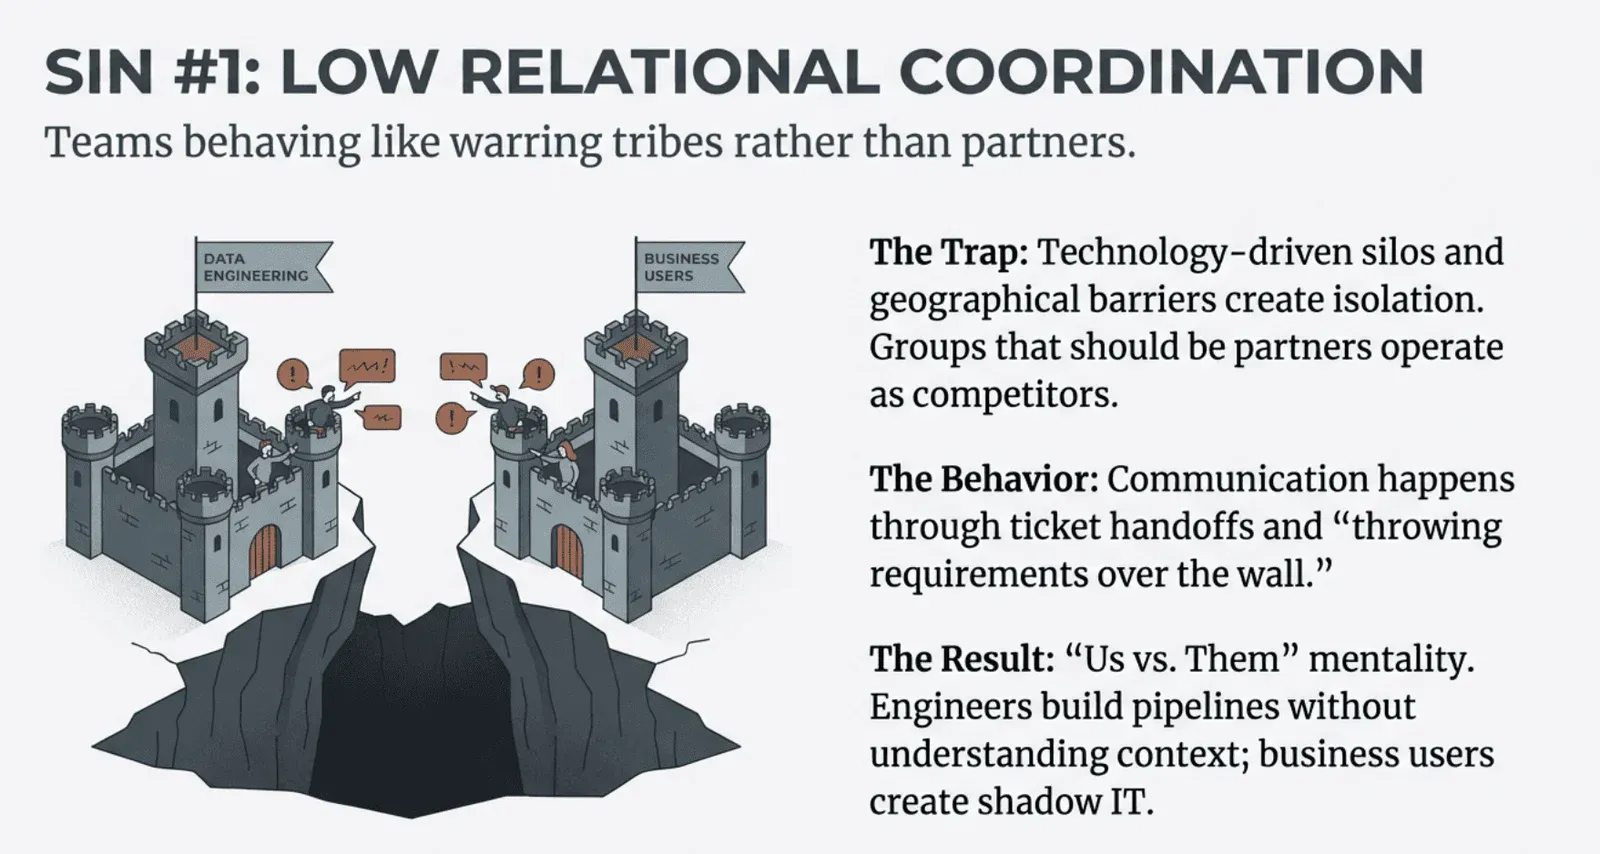
Relational Coordination can be expressed as characteristics of relationships and communication.
| Dimension of RC | Low RC | High RC |
|---|---|---|
| Relationships | Functional goals Exclusive knowledge Lack of respect | Shared goals Shared knowledge Mutual respect |
| Communication | Infrequent Delayed Inaccurate Finger-pointing | Frequent Timely Accurate Problem-solving |
Members of the “Low-RC” organization express their goals solely in terms of their own function. They keep knowledge to themselves and there may be a tendency for one group to look down upon another group. Inter-group communication is inadequate, inaccurate and might be more concerned with finding blame than finding solutions. As expected, the “High-RC” organization embodies the exact opposite end of this spectrum.
“High-RC” team members understand the organization’s collective goal. They not only know what to do but why, based on a shared knowledge of the overall workflow. Everyone’s contribution is valued, and no one is taken for granted. There is constant communication, especially when a problem arises.
At this point you may be thinking: “OK fine, this is all touchy-feely stuff. I’ll try to smile more and I’ll organize a pizza party so everyone can get to know each other.” Maybe you should (smiling will make you feel good and parties are fun after all), but our experience is that the good feeling wears off once the last cupcake is gone and the mission-critical analytics are offline.
How do you keep people working independently and efficiently when their work product is a dependency for another team? How can one team reuse the data or artifacts or code that another team produces?
For most enterprises, improving RC requires foundational change. You need to examine your end-to-end data operations and analytics-creation workflow. Is it building up or tearing down the communication and relationships that are critical to your mission? Instead of allowing technology to be a barrier to Relational Coordination, how about utilizing automation and designing processes to improve and facilitate communication and coordination between the groups? In other words, you need to restructure your data analytics pipelines as services (or microservices) that create a robust, transparent, efficient, repeatable analytics process that unifies all your workflows.
Building a High-RC Enterprise Using DataOps
DataOps is a new approach to data analytics that applies lean manufacturing, DevOps and Agile development methods to data analytics. DataOps unifies your data operations pipeline with the publication of new analytics under one orchestrated workflow.
- Robust — Statistical process control (lean manufacturing) calls for tests at the inputs and outputs of each stage of the data operations pipeline. Tests also vet analytics deployments, like an impact review board, so new analytics don’t disrupt critical operations.
- Transparent — Dashboards display the status of new analytics development and the operational status of the data operations pipeline. Automated alerts communicate issues immediately to appropriate response teams. Team members can see a birds-eye-view of the end-to-end workflow as well as local workflows.
- Efficient — Automated orchestration of the end-to-end data pipeline (from data sources to published analytics) minimizes manual steps that tie up resources and introduce human error. Balance is maintained between centralization and decentralization; the need for fast-moving innovation, while supporting standardization of metrics, quality and governance.
- Repeatable — Revision control with built-in error detection and fault resilience is applied to the data operations pipeline.
- Sharable and Chunkable — Encourage reuse, by creating a services oriented architecture (SOA) for your team to use together.
It may help to provide further concrete examples of a DataOps implementation and how it impacts productivity. Some of these points are further explained in 7 Steps to Implement DataOps.
- Data sharing — data sources flow into a data lake which is used to create data warehouses and data marts. Bringing data under the control of the data organization decouples it from IT operations and enables it to be shared more easily.
- Deployment of code into an existing system — continuous integration and continuous delivery of new analytics, leveraging on-demand IT resources and automated orchestration of integration, test and deployment.
- Environment startup, shutdown — With computing and storage on-demand from cloud services (infrastructure as code), large data sets and applications (test environments) can be quickly and inexpensively copied or provisioned to reduce conflicts and dependencies.
- Testing of data and other artifacts — Testing of inputs, outputs, and business logic are applied at each stage of the data analytics pipeline. Tests catch potential errors and warnings before they are released so the quality remains high. Test alerts immediately inform team members of errors. Dashboards show the status of tests across the data pipeline. Manual testing is time-consuming and laborious so it can’t be done in a timely way. A robust, automated test suite is a key element in continuous delivery.
- Reuse of a set of steps across multiple pipelines — Analytics reuse is a vast topic, but the basic idea is to componentize functionalities as services in ways that can be shared. Complex functions, with lots of individual parts, can be containerized using a container technology (like Docker).
We have seen marked improvements in analytics cycle time and quality with DataOps. It unlocks an organization’s creativity by forging trust and close working relationships between data engineers, scientists, analysts and most importantly, users. DataOps is a task coordination and communication framework that uses technology to break down the barriers between the groups in the data organization.
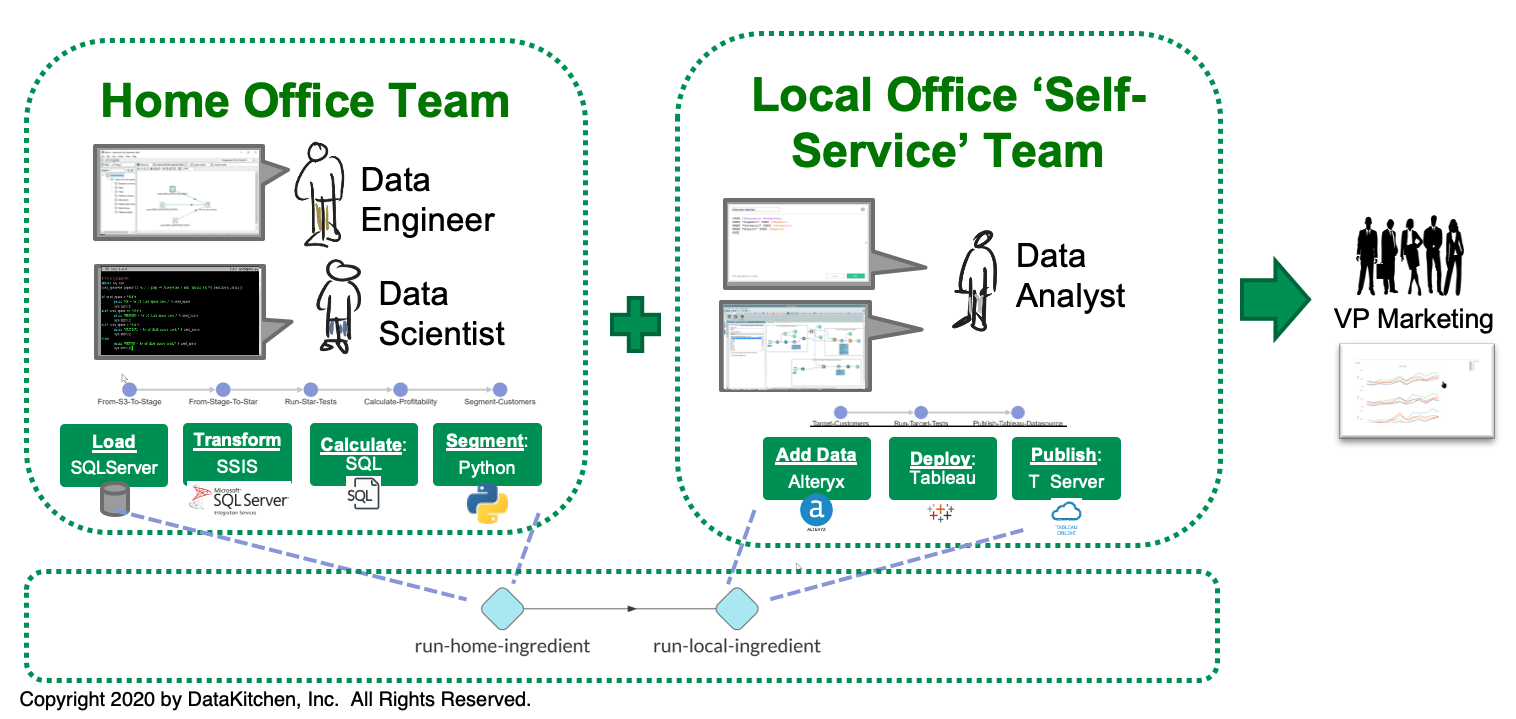
Let’s look at the DataOps enterprise from the perspective of Relational Coordination.
| Dimension | Warring tribes (weak RC) | The DataOps enterprise (strong RC) |
|---|---|---|
| Shared goals | Separation into isolated tools silos with little regard for or understanding of others | Visibility into how analytics builds in stages until delivery to the customers or users |
| Shared knowledge | System knowledge concentrated in the Impact Review Board Little reuse of analytics components Bureaucratic processes govern change Little visibility into the end-to-end pipeline | System knowledge implemented in tests that anyone can view Reusable analytics components are maintained in source control Rapid cycle time for new analytics Complete visibility into the global and local workflows of the data pipeline |
| Mutual respect | Each tribe in the data-analytics organization thinks it is better than the others | No one is taken for granted. The workflow shows how everyone’s contribution is important |
| Frequent and timely communication | Communication is limited and definitely not a priority during frequent high-severity outages | Dashboards and automated alerts keep everyone informed 24x7 |
| Problem-solving communication | When something goes wrong, the tribes focus on finding someone to blame | Discussion centers on tests that caught or will catch problems |
Conclusion
Technology companies face unique challenges in fostering positive interaction and communication due to tools and workflows which tend to promote isolation. This natural distance and differentiation can lead the groups in a data organization to act more like warring tribes than partners. These challenges can be understood through the lens of Relational Coordination; a management theory that has helped explain how some organizations achieve extraordinary levels of performance as measured by KPPs. DataOps is a tools and methodological approach to data analytics which raises the Relational Coordination between teams. It breaks down the barriers between the warring tribes of data organizations. With faster cycle time, automated orchestration, higher quality and better end-to-end data pipeline visibility, DataOps enables data analytics groups to better communicate and coordinate their activities, transforming warring tribes into winning teams.
Related Reading
- What is DataOps? — the discipline this paper applies to teamwork
- Improving Teamwork in Data Analytics with DataOps — the intra-team companion to this paper
- The Five Organizational Sins of Data Teams — low relational coordination as the first of five structural failures
- Reducing Organizational Complexity with DataOps — the toolchain and team-structure sprawl behind the silos
- DataOps is Not Just a DAG for Data — why a local workflow graph is not an end-to-end process
- DataOps For Business Analytics Teams — the self-service side of the two-cadence problem
- Run Analytics Seamlessly Across Multi-Cloud Environments with DataOps — the multi-cloud integration case in practice
- 7 Steps to Implement DataOps — the engineering practices underneath
- Data Quality: The DataOps Way — the same influence problem, applied to data quality
FAQ
What is the main point of this paper?
Data organizations underperform because their groups behave like warring tribes rather than one team, and the cause is structural rather than personal. Tools, platforms, release cadences, and locations drive people into silos. Management science calls the missing ingredient Relational Coordination, and DataOps raises it by unifying data operations and analytics development under one orchestrated, tested, transparent workflow.
Why do groups in a data organization behave like warring tribes?
They report to different management chains, compete for limited resources, and sit in different locations. Above all they use different tools, and tools shape iteration cadence, problem-solving approach, and risk tolerance. A data engineer on an MDM platform and an analyst in Tableau live in genuinely different worlds, which makes it easy to overlook a shared purpose.
What is Relational Coordination?
Relational Coordination is communicating and relating for the purpose of task integration. It is a powerful driver of performance when work is interdependent, uncertain, and time constrained — an exact description of analytics work. It measures the quality of relationships and communication between roles rather than the technical sophistication of any single group.
Who developed Relational Coordination, and what did the research find?
Brandeis management professor Jody Hoffer Gittell studied why Southwest Airlines outperformed its rivals and published a quantitative, data-driven analysis in 2003. Surveying the major players in the airline industry, she found a correlation between key performance parameters and Relational Coordination that held even when comparing two sites within the same company.
Is Relational Coordination about personal relationships?
No, and that is the common misconception. Personal relationships matter, but Relational Coordination is concerned with the relationship of roles and workflows within the organization. It studies how people interact and exchange information in executing their role-based relationships, which is why it can be improved by changing process rather than personalities.
What distinguishes a low-RC organization from a high-RC one?
Members of a low-RC organization express goals solely in terms of their own function, keep knowledge to themselves, and look down on other groups, and inter-group communication is inadequate, inaccurate, and focused on blame. High-RC team members understand the collective goal, know what to do and why, value everyone’s contribution, and communicate constantly when a problem arises.
Why don’t team-building events fix poor teamwork in data organizations?
Because the barriers are built into the workflow, not the mood. The good feeling from a pizza party wears off once the last cupcake is gone and the mission-critical analytics are offline. Improving Relational Coordination requires foundational change to the end-to-end data operations and analytics-creation workflow itself.
How does DataOps raise Relational Coordination?
DataOps applies lean manufacturing, DevOps, and Agile development methods to data analytics, unifying the data operations pipeline with the publication of new analytics under one orchestrated workflow. Instead of letting technology become a barrier, it uses automation and process design to improve communication and coordination between groups, restructuring pipelines as services that unify every workflow.
What are the five properties of a DataOps analytics process?
Robust: statistical process control tests at the inputs and outputs of each pipeline stage. Transparent: dashboards showing development and operational status, with automated alerts. Efficient: automated orchestration from data sources to published analytics. Repeatable: revision control with error detection and fault resilience. Sharable and chunkable: a services oriented architecture that encourages reuse.
How do different iteration cadences between teams cause problems?
A home office doing data engineering on a weekly cadence cannot answer an ASAP request from an analytics team working daily or hourly. In the paper’s example the engineering team eventually makes the change and inadvertently breaks other critical reports, while the analytics team adds its own data sets locally, leaving other sites a revision behind with inconsistent reports.
What should a chief data officer take away from this paper?
Treat poor teamwork as an architecture problem. Examine whether the end-to-end analytics workflow builds up or tears down the communication and relationships the mission depends on, then use automation and orchestration to raise Relational Coordination. Faster cycle time, higher quality, and better end-to-end visibility are the mechanisms that turn warring tribes into winning teams.
Get the PDF
The full paper is on this page. Fill in the form for a PDF copy to keep or share.