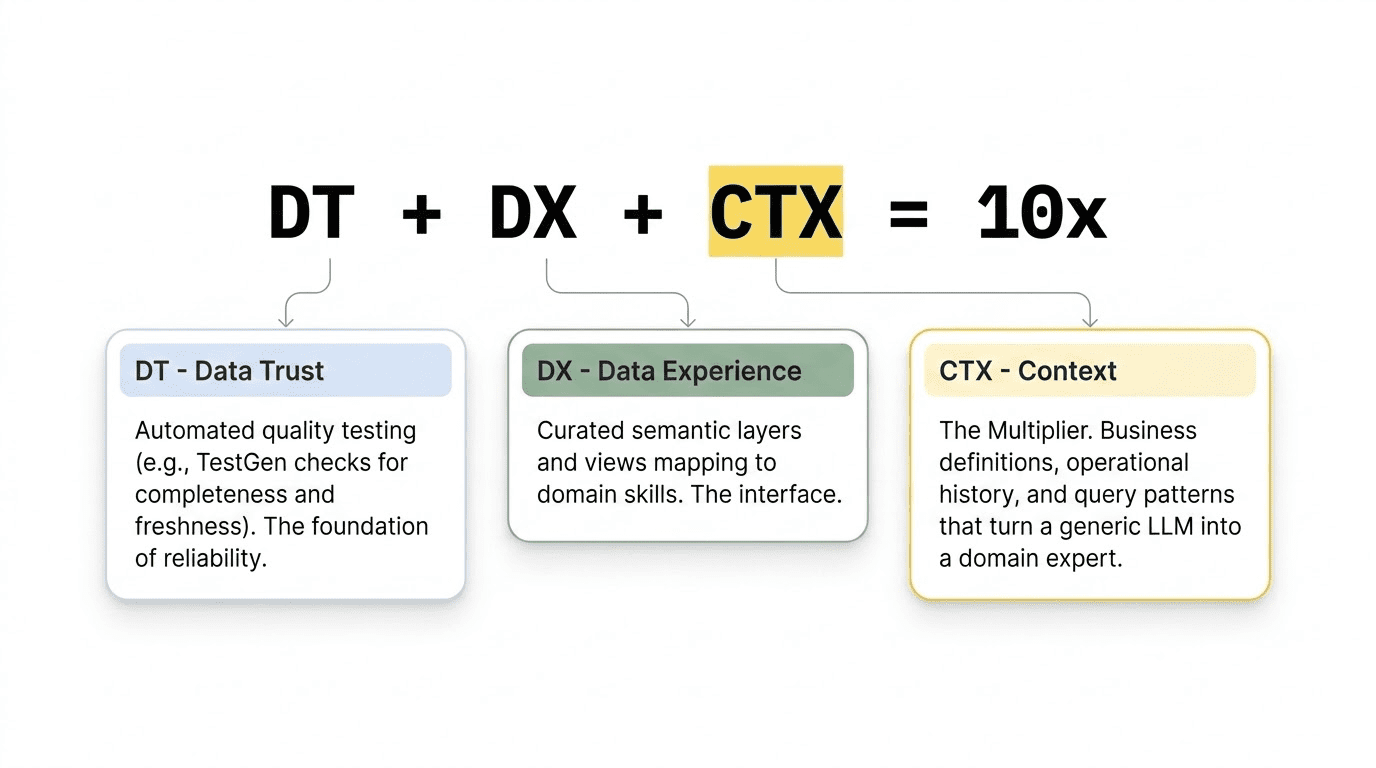
This post is a follow-up to The Equation for AI Success: DT + DX + CTX = 10x. Suppose you have not read that one yet, start there. It lays out the three-part foundation for reliable AI analysis: Data Trust, Data Experience, and Context. In April 2026, we ran a webinar that walked practitioners through the full framework live, with real examples from Snowflake and Databricks deployments. You can watch the recording here: 10x Your AI Data Analysis: The Context Engineering Formula That Works. This post goes deep into the third term in the equation. Context is the multiplier that turns a generic language model into something that actually understands your business. Here, we break it down into the six specific categories that make up a complete context layer, explain how you manufacture each one, and explain why keeping context current is now a parallel discipline to data engineering itself.
Anyone who has connected an AI assistant to their data warehouse knows this story. At first, the answers seem impressive. Then an analyst finds a number that does not make sense, traces it to the AI, and says, “I do not trust what the chatbot told me.” That one sentence can stop AI adoption in its tracks.
That reaction is not really about the model itself. It points to a problem with the context layer—or, more often, the lack of one.
The model is doing exactly what it was designed to do. It reads the schema in front of it, infers what the columns mean, generates syntactically plausible SQL, and returns an answer with confidence. What it cannot do is know that EQ_TRX means equalized prescriptions, normalized for days supply, excludes mail-order, and must be summed rather than averaged. It cannot know that TERR_CD changed its alignment definition in week 14. It cannot know whether the metric your finance team calls revenue and the metric your CRM calls revenue are computed differently, and the answer to any question depends on which one you mean.
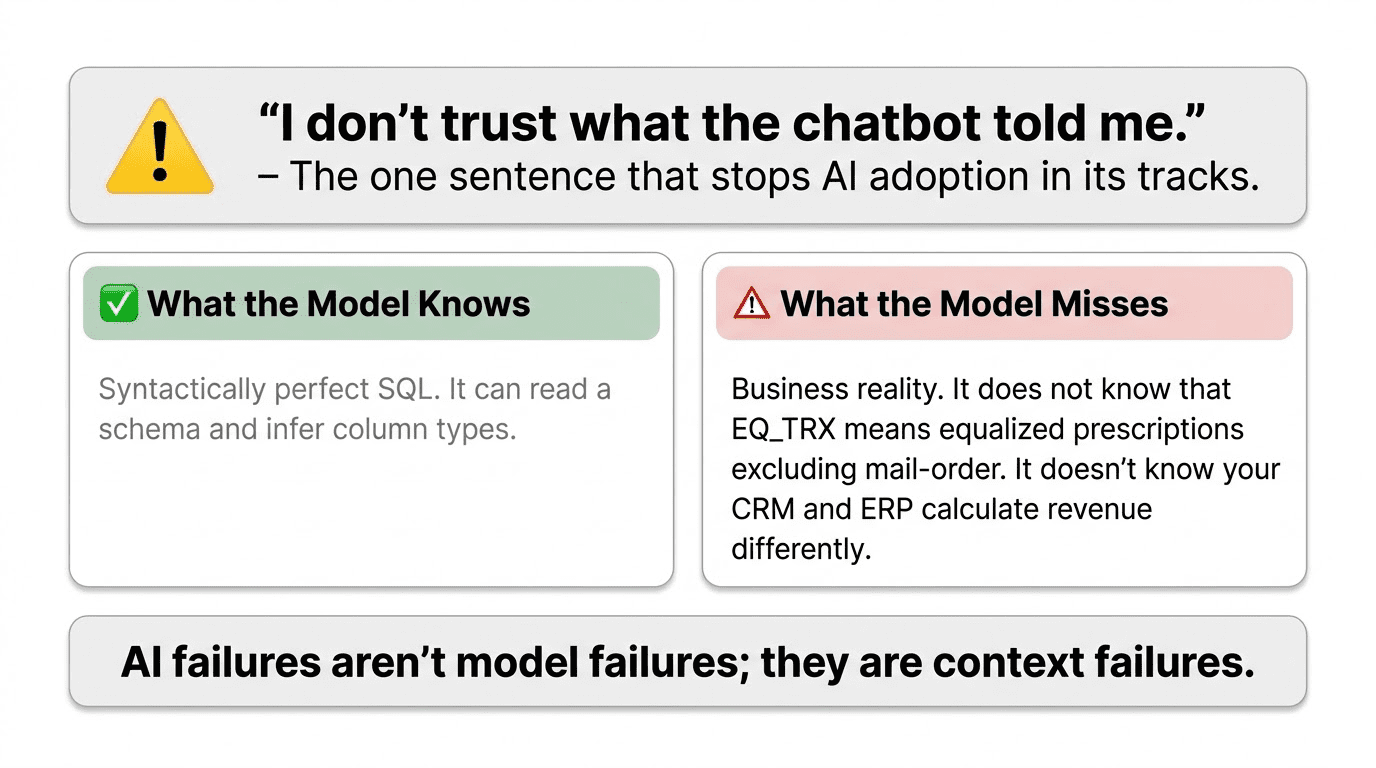
These are examples of context failures. The good news is they can be fixed, but it takes intentional engineering effort, just as improving data quality or designing a schema does.
This blog explains what that work involves.
The Six Categories, and Why This Particular Taxonomy Matters
When people think about context for AI-on-data systems, they usually focus on column descriptions. Write some documentation, add it to the prompt, and call it done. But that is only Category 1 out of six. It is just the starting point, not the goal.
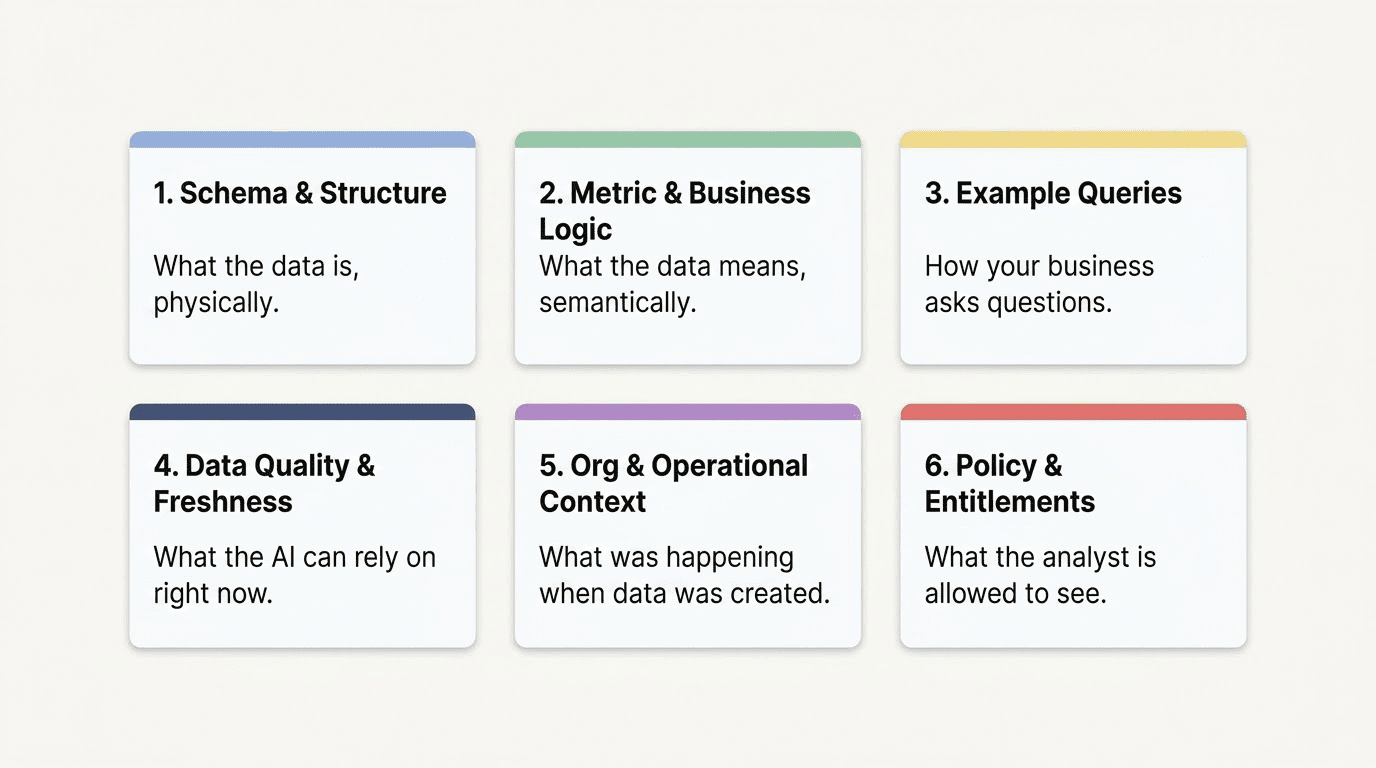
A complete context layer has to answer six fundamentally different questions:
- What is the data, physically?
- What does the data mean, semantically?
- How does your business ask questions about this data?
- What can the AI actually rely on right now?
- What was happening in the business when this data was created?
- What is this particular analyst allowed to see?
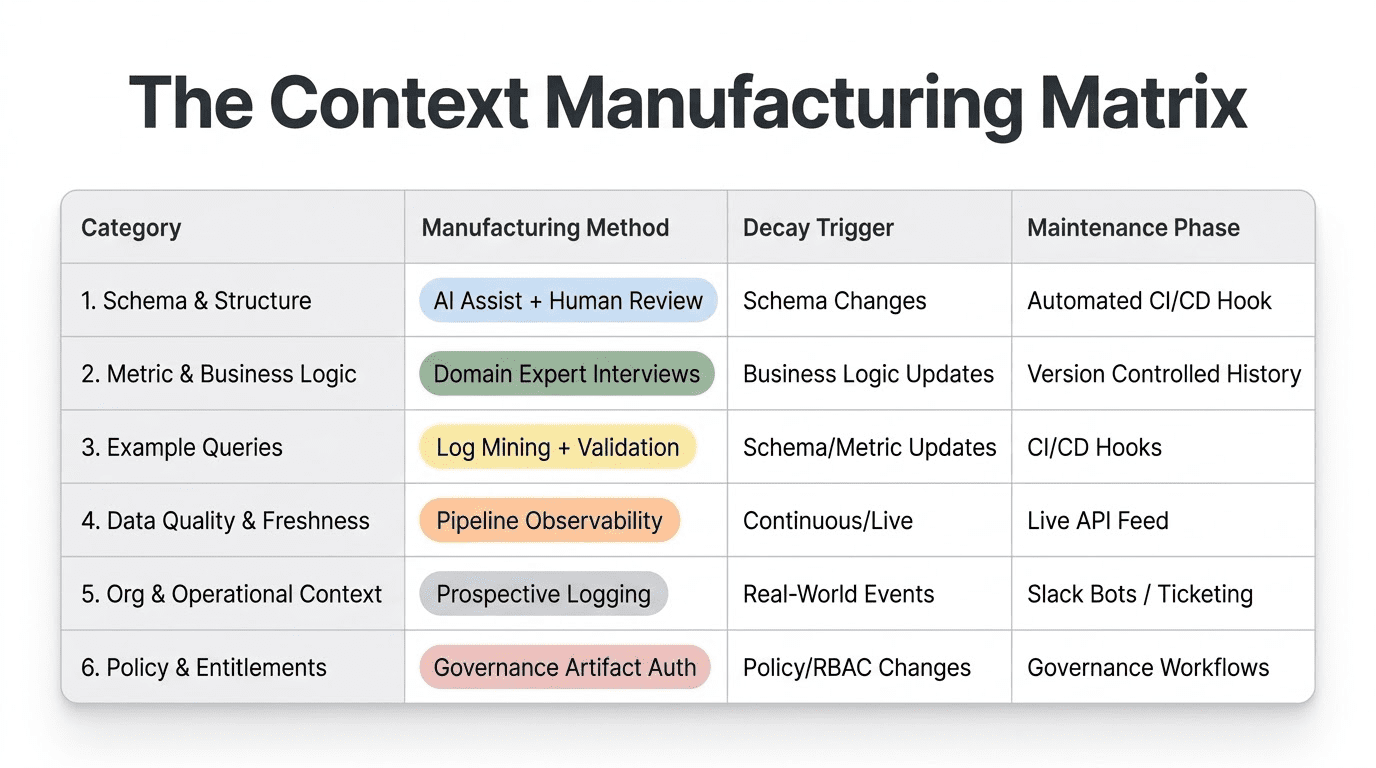
Each category requires a different manufacturing process, decays at a different rate, and needs a different maintenance discipline. You can have perfect Category 1 and still get confidently wrong answers because you are missing Category 2. You can have strong Categories 1 through 3 and watch the AI give answers based on stale data because you skipped Category 4. Understanding the taxonomy is not an academic exercise. It tells you what to build first, what to automate, and what requires new team habits.
Let us go through each one.
Category 1: Schema and Structure
What it is
The schema and structure context are everything the AI needs to understand the physical shape of your data. This is the starting point. Without it, the AI is navigating a warehouse it has never seen with no map.
The elements that belong here are more specific than most teams realize:
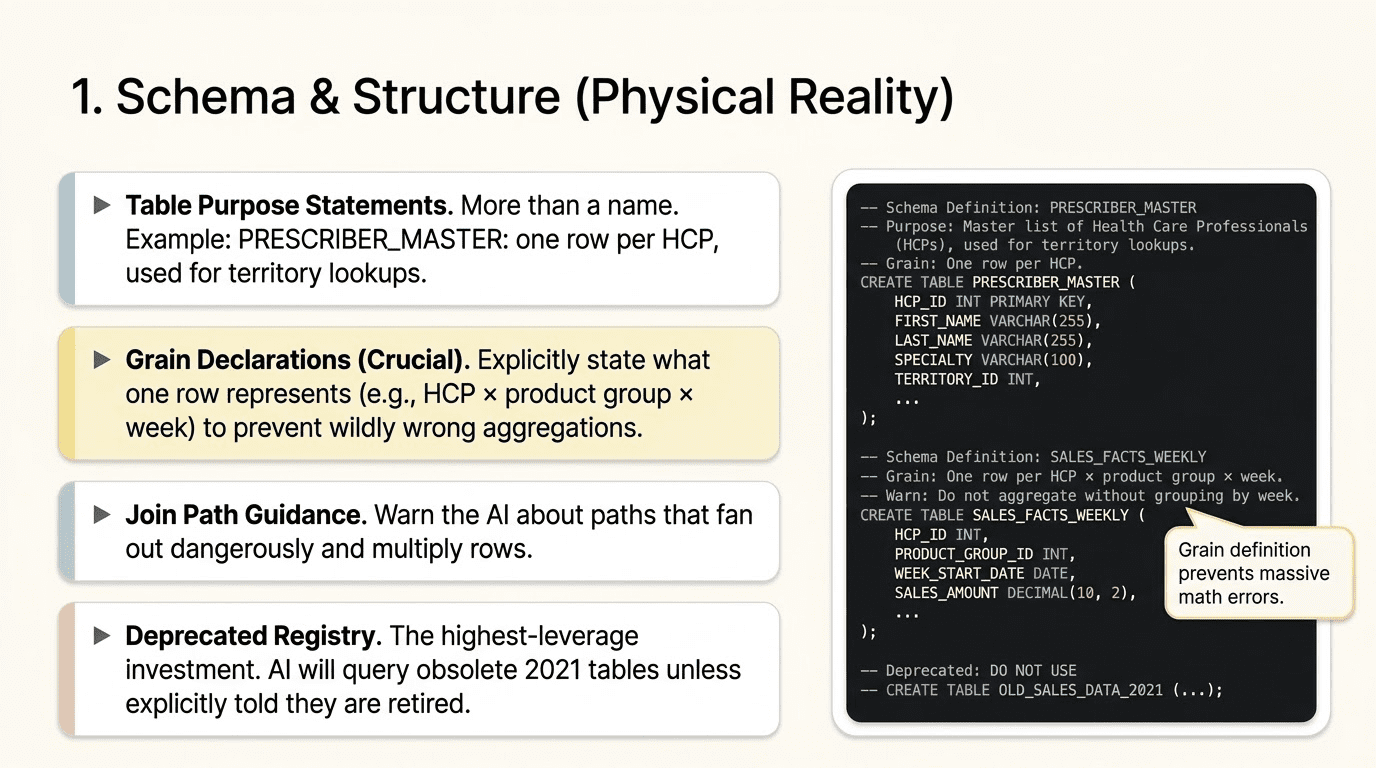
Table purpose statements. Not just the table name, but a sentence or two that says what the table is for and when to use it. “PRESCRIBER_MASTER: one row per healthcare provider. Use this table for territory, specialty, and NPI lookups. Do not use for prescription volume.” That one sentence eliminates an entire class of wrong joins.
Grain declarations. This is underinvested and critically important. The AI needs to know explicitly what one row represents. WEEKLY_PRESCRIPTIONS: one row per healthcare provider per product group per week. If the AI does not know the grain, it will aggregate at the wrong level. A question about total prescriptions by territory will return the correct SQL only if the AI knows the grain and can construct the correct GROUP BY. Get this wrong, and your numbers are off by factors, not percentages.
Column definitions with caveats. Not just what the column is called and what data type it holds, but what it measures, how it is calculated, and what the edge cases are. EQ_TRX: equalized total prescriptions, normalized for days supply to make 30-day and 90-day fills comparable, excludes mail-order channels, must be summed (never averaged without panel-size adjustment). That annotation is the difference between a number your analysts trust and a number they spend two hours investigating.
Join path guidance. When multiple join paths exist between tables, the AI needs to know which one is correct for which question type, and it needs warnings about join paths that fan out dangerously. A join between a fact table at weekly grain and a dimension table at daily grain can produce duplicate rows, resulting in incorrect results. Document the right paths. Flag the dangerous ones.
Deprecated field registry. This is the highest-leverage investment in Category 1 for most real-world warehouses. Every data warehouse accumulates tables and columns that technically exist but should not be queried for new analysis. The AI has no way to know that FACT_TRX_PROD_BACKUP is from 2021 and was replaced by WEEKLY_PRESCRIPTIONS. Without an explicit registry of deprecated objects and pointers to their replacements, the AI will happily query them. It will find columns that match its expectations and return answers that are months out of date.
How do you manufacture it?
Category 1 is the most automatable of the six. Most of the raw material already exists in your metadata layer: information_schema, dbt documentation, data catalog entries, and existing README files. The manufacturing process for an initial pass looks like this:
Start by exporting your current metadata. Then use an AI coding assistant like Claude Code to analyze that metadata alongside your dbt models, transformation code, and pipeline definitions, and generate draft annotations for each table and column. The code-derived annotations are surprisingly good because pipeline code contains business logic that never surfaces in schema metadata. A dbt model that filters out mail-order channels before writing to WEEKLY_PRESCRIPTIONS will tell the AI something about EQ_TRX that no column description alone would convey.
From there, the process is human review and enrichment. Domain experts correct the drafts, add grain declarations, and document the deprecated registry. Plan for a few hours per domain area for the initial pass, not weeks.
How it decays and how you maintain it
Category 1 decays on schema change events: new tables, renamed columns, altered grain, deprecated objects. The maintenance discipline is to wire context updates into your CI/CD process. When a new table lands in production, the pipeline that creates it should trigger a context generation step. When a column is deprecated, the deprecated registry should be updated automatically as part of the deprecation workflow. This is not a manual quarterly review process. It is a hook in the deployment pipeline.
Category 2: Metric and Business Logic
What it is
Category 2 is what distinguishes an AI that can navigate your schema from one that actually understands your business. If Category 1 tells the AI what the data is, Category 2 tells it what the data means.
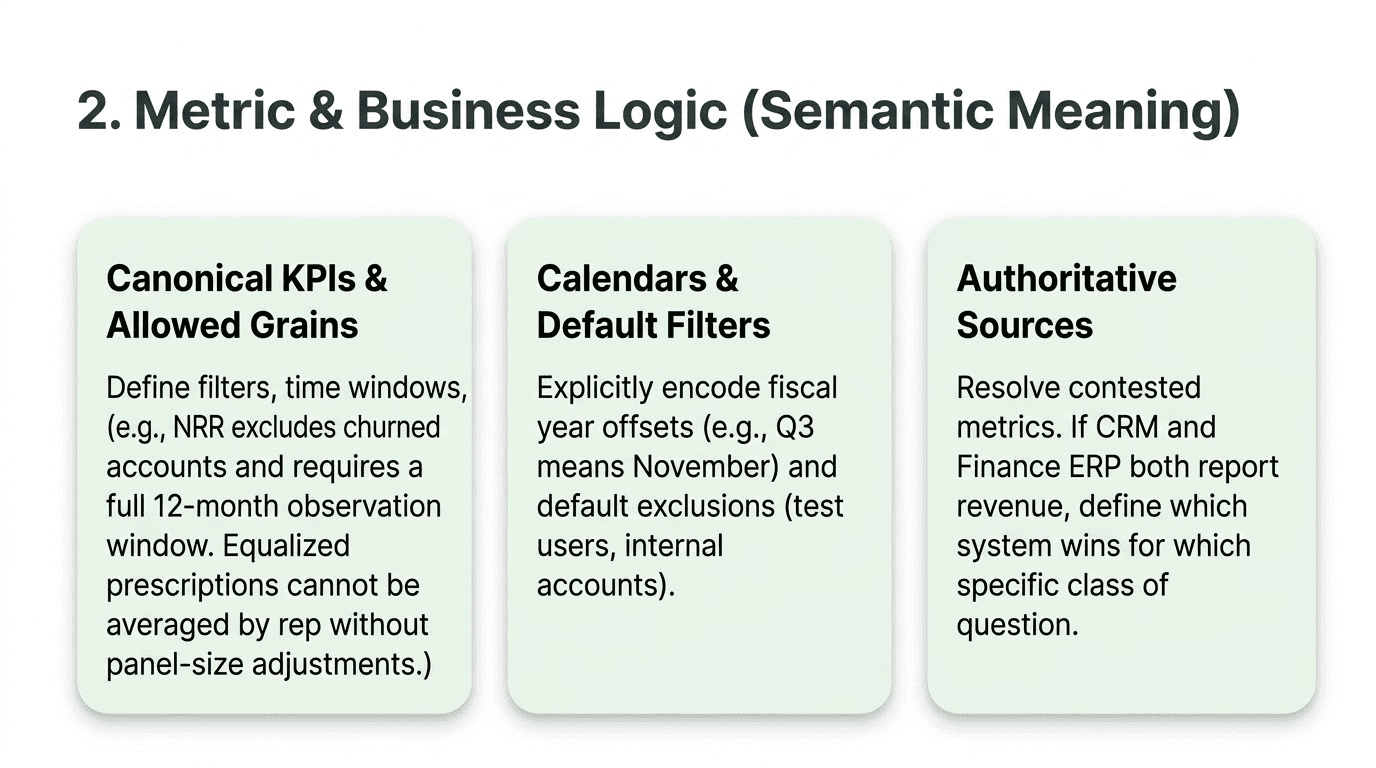
Canonical KPI definitions. Every metric that matters needs a full specification: the name, the formula, the default filters, the time-window logic, and the edge cases. NRR (net revenue retention): computed on a cohort basis, includes expansion and contraction, excludes churned accounts, requires a full 12-month observation window to be valid, enterprise segment only unless segment filter is explicitly overridden. A one-line definition is not enough. Write it the way you would explain it to a new analyst on their first day.
Fiscal and operational calendar definitions. This category trips up more AI implementations than almost anything else because it looks trivial, but it isn’t. If your fiscal year ends January 31, a question about Q3 means something different from what the AI expects. If your territory plan year runs from October to September, the AI needs to know that when someone asks about “last year’s plan.” If IQVIA prescription data arrives on Tuesday mornings, Monday afternoon answers to last week’s questions are based on data that is a week old. All of this is a business calendar context that is completely invisible to the model without explicit documentation.
Allowed aggregation grains per metric. Some metrics are only valid at certain aggregation levels. Equalized prescriptions can be summarized by territory, product group, and time period. You cannot average them across reps without adjusting for panel-size differences, or the metric will mean nothing. NPS scores can be averaged across respondents but not across time periods without careful weighting. Write these rules explicitly. The AI has no way to infer them.
Banned and deprecated metrics. This is the Category 2 equivalent of the Category 1 field registry. Metrics that look computable but should not be used anymore: old market share calculations that were replaced by a new methodology, metrics that two teams define differently, and where one definition was declared canonical, metrics that are technically correct but are not used for business decisions for reasons that live in people’s heads. Name the banned metrics, say why they are banned, and point to the replacement. The AI will compute a banned metric unless you tell it not to.
Default filter logic. Every business has data that gets excluded from standard analysis: internal accounts, test users, pilot markets, specific geographies handled separately, and product lines in wind-down that skew trend lines. These exclusions live in analyst muscle memory. When someone runs a report, they automatically apply these filters. The AI will not unless you tell it to. Document the defaults and embed them in the context layer so the AI applies them unless the question explicitly overrides them.
Authoritative source rules for contested metrics. In almost every enterprise, some metrics exist across multiple systems, and those systems do not agree. Finance reports revenue from the ERP. CRM reports revenue from closed-won opportunities. They are different numbers because they measure different things at different points in the process. The AI needs to know which system wins for each question class, and under what conditions the other system is appropriate. This must be explicit. The AI cannot infer it from the data, and it will not flip a coin. It will pick whichever table seems most relevant to the question, but sometimes it picks the wrong one.
How do you manufacture it?
Category 2 cannot be fully automated because it encodes business decisions, not just technical facts. The manufacturing process involves pulling together the humans who own each metric: finance, analytics, product, sales ops, whoever maintains the definitions. Interview them. Ask them how they explain each metric to a new analyst. Ask them what questions trip up most people. Ask them what the common mistakes are when computing the metric.
Structured templates help. A KPI definition template with fields for formula, filters, time window, allowed grains, common mistakes, and authoritative source takes about 20 to 30 minutes per metric to fill out and produces something directly usable as context.
The highest-leverage investment in Category 2, and the one with the most immediate ROI, is getting your three to five most contested metrics fully specified. Revenue. Active users. Churn. Net retention. Whatever the metrics are that your leadership team asks about most and that cause the most “well, it depends on how you define it” conversations. Get those right, and you eliminate most of the confident-but-wrong answers the AI produces on high-visibility questions.
How it decays and how you maintain it
Category 2 decays on business logic change events: when a KPI definition is updated, when a new authoritative source is designated, or when a metric is deprecated or replaced. The maintenance discipline is version control with change history. When the definition of a KPI changes, you need to record not only what it is now, but also what it was before and when it changed. This is not just good practice for the context layer. It is critical to answer questions that span the change date, which is Category 5 territory, and we will get to it.
Category 3: Example Queries and Patterns
What it is
Category 3 is the most underrated and, in our experience, the one with the highest immediate return on investment per hour spent. If you do only one thing from this list, do this one.
An example query is a validated, confirmed-correct question-to-SQL mapping with annotations explaining the choices. Not just the SQL. The business question that motivated it, the SQL that answers it correctly, and notes on why it is correct: which tables were used and why, what the join path was and why that path rather than an alternative, what filters were applied by default, and what common mistakes this example is intended to prevent.
Here is what a useful example looks like:
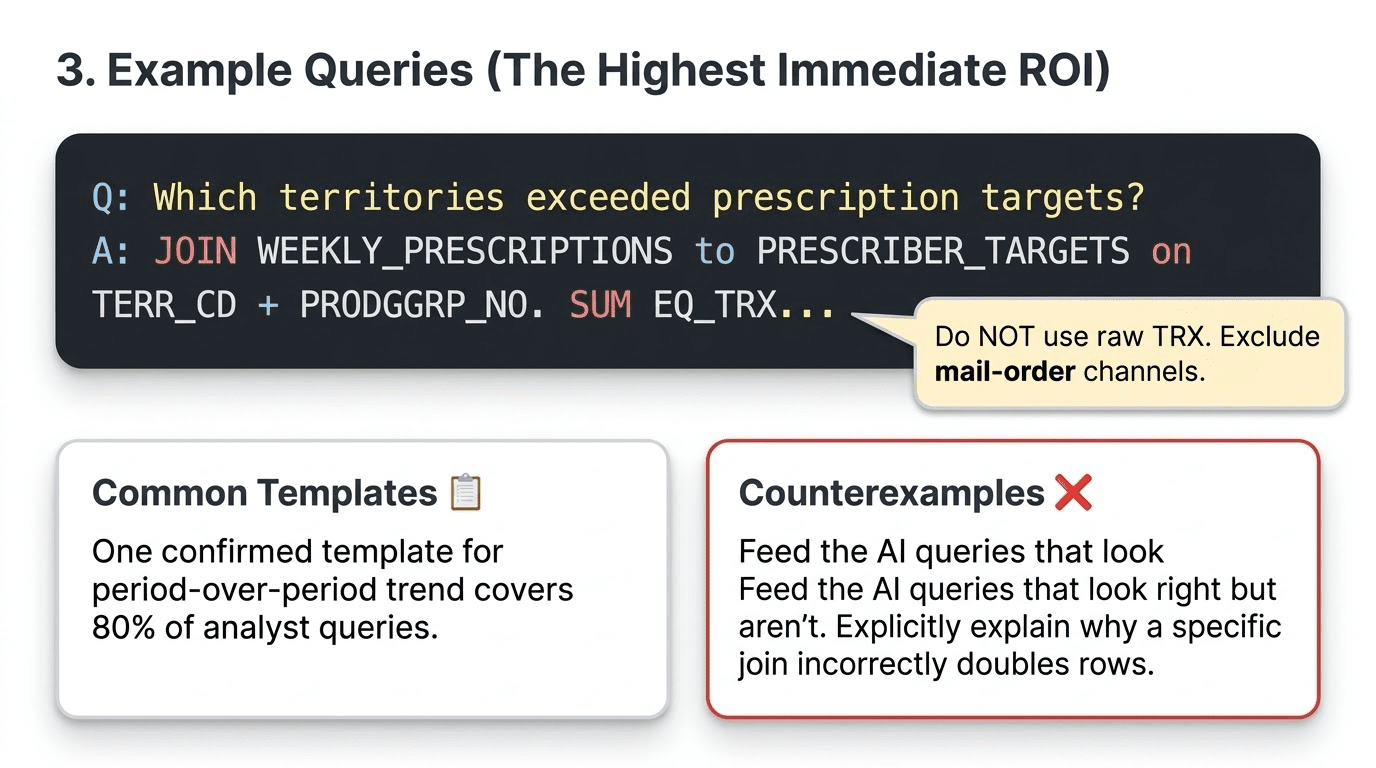
Question: Which territories exceeded their equalized prescription targets last month?
SQL: JOIN WEEKLY_PRESCRIPTIONS to PRESCRIBER_TARGETS on TERR_CD, PRODGRP_NO, and PLAN_YR. SUM EQ_TRX WHERE WK_DT falls in the most recent complete fiscal month. Attainment equals the sum of EQ_TRX divided by ANNUAL_TGT times the fraction of the plan year elapsed. Use EQ_TRX, not TRX. Do not include mail-order channels.
That annotation prevents three common mistakes and teaches the AI the correct grain, metric, and join structure for this entire class of questions.
Common question templates. Beyond individual examples, you want parameterized templates for the major question types your analysts ask. Territory versus target. Period-over-period trend. Cohort comparison. Anomaly investigation (why did this metric change). KPI health check. If you have one confirmed, correct template for each of these patterns, you cover perhaps 80 percent of analyst questions. The long tail of edge cases can be handled by combining templates or extending them.
Counterexamples. These are underused but extremely effective. A counterexample is a query that appears correct but is not, accompanied by an explanation of why it fails. This join doubles rows because PRESCRIBER_MASTER has one row per NPI, but WEEKLY_PRESCRIPTIONS has one row per HCP_ID, and the relationship is not one-to-one. This calculation produces incorrect results for territories that underwent alignment changes mid-period because it uses point-in-time territory codes without accounting for the alignment history. Counterexamples teach the AI not just what to do but also what to avoid, and they are especially effective at preventing the failure modes that experienced analysts know about but are invisible in the schema.
Historical query patterns. If you have a query log, mine it. Which tables appear together in correct queries for which question types? When someone asks a territory performance question, what joins do your best analysts use? These patterns are a form of collective knowledge about what correct analysis looks like and can be used directly in context.
How do you manufacture it?
The manufacturing process for Category 3 is collaborative and iterative. Start by identifying your top 10 to 15 question types. For each one, have an analyst who owns that domain write the correct SQL and annotate it. Then review the annotation with someone who was not involved in writing it. The review catches assumptions that the author made implicitly but did not document.
Claude Code and similar AI coding assistants can help here. You can provide the schema, ask the assistant to generate candidate SQL for each question type, and then have domain experts validate and annotate the results. The validation step is essential. Treat the AI-generated SQL as a starting point, not a finished product.
As with Category 1, the initial investment is a few hours per question type. The ongoing investment adds examples as new question patterns emerge and updates existing examples when the schema or business logic changes.
How it decays and how you maintain it
Category 3 decays more slowly than Categories 4 and 5. The main triggers for updates are schema changes that affect join paths or table names, and business logic changes that affect which metric or filter to use. Wire example query updates into the same CI/CD hooks you use for Category 1.
Category 4: Data Quality and Freshness
What it is
Category 4 is where DataKitchen’s contribution to the context engineering conversation is most distinctive, because it is the category that almost everyone else is not building. Every other framework for AI-on-data context assumes that the data being queried is trustworthy. Category 4 is how the AI knows whether to trust it.
Category 4 context is not static documentation. It is live metadata about the current state of your data, surfaced into the AI context layer at query time.
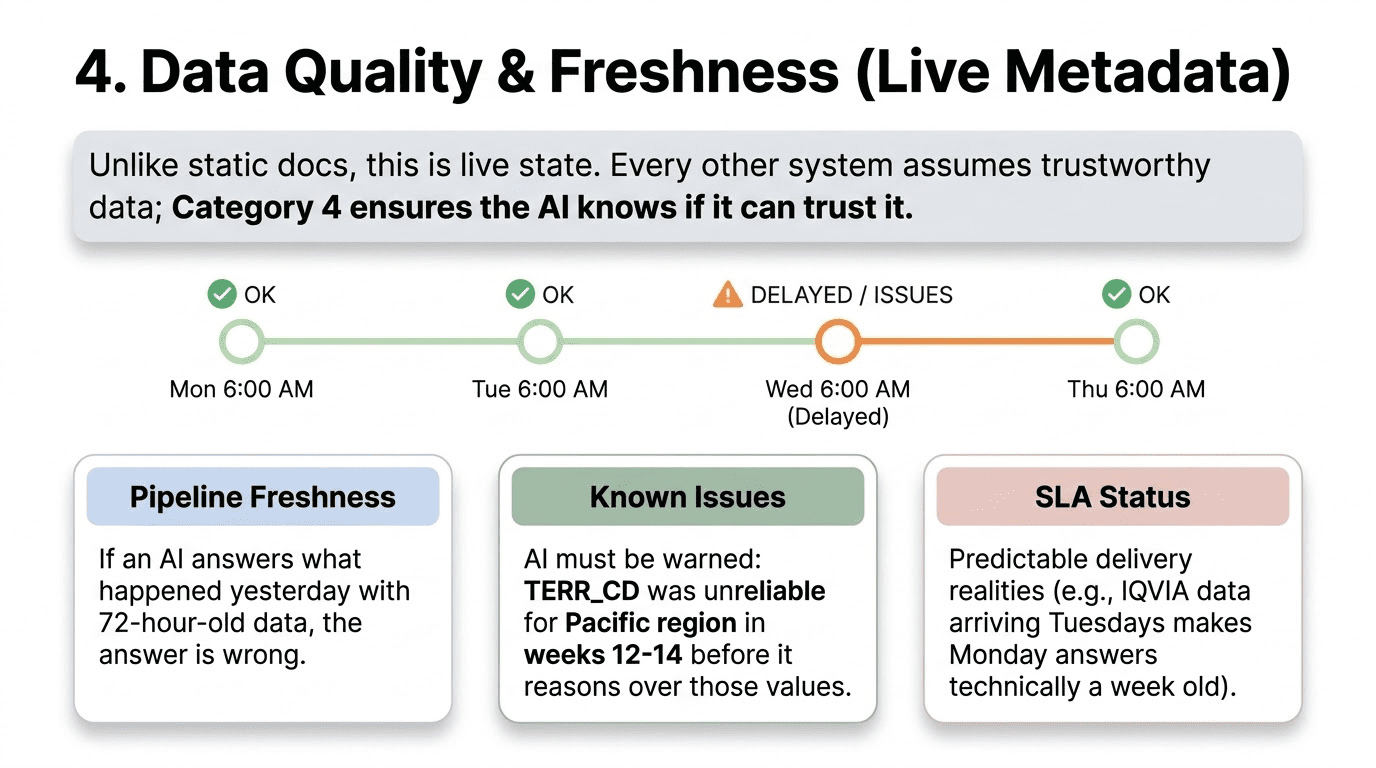
Pipeline freshness timestamps. Every table in your AI-accessible schema should have a recorded last-refresh time and an expected refresh cadence. When an analyst asks a question and the AI queries WEEKLY_PRESCRIPTIONS, the context layer should tell the AI when that table was last refreshed. If the AI is answering a question about last week with data that is 72 hours old, it should say so. Without this context, the AI gives the same confident answer regardless of whether the data is current or stale.
Known data quality issues. If a specific column has a known problem within a specific date range or segment, the AI needs to know before it reasons over those values. TERR_CD was unreliable for the Pacific region in weeks 12 through 14 of 2026 due to an alignment migration. If that context is not present, the AI will reason over those values with the same confidence it brings to clean data, and it will produce wrong answers that it presents as correct.
Automated test results and quality scores. This is where data quality testing connects directly to context engineering. TestGen and similar tools run automated checks on your tables: completeness, freshness, referential integrity, value-range validation, and statistical distribution checks. Those test results are not just for the data engineering team. They belong in the AI context layer. If a table has a quality score below your threshold, or if a specific column has failed recent checks, the AI should caveat any answer derived from that data. A quality score per table, surfaced at query time, gives the AI a basis for expressing appropriate uncertainty rather than projecting false confidence.
SLA status and known delays. Many data environments exhibit predictable delivery patterns that are not failures but affect data currency. IQVIA prescription data typically arrives on Tuesday mornings. On Monday afternoon, last week’s data is the most recent available, but Monday morning data is actually the prior week. If the AI does not know this, it will describe Monday afternoon data as current when it is actually five days behind real-world events. That is not a data failure. It is a timing reality that the context layer needs to encode.
Data lineage and transformation history. Where did this data come from, and what happened to it on the way to the table the AI is querying? For derived metrics, especially, the AI should be able to explain the lineage of an answer. This metric is computed from IQVIA TRx adjusted for territory alignment as of last Tuesday’s load. That provenance statement turns an answer into a verifiable claim.
How do you manufacture it?
Category 4 is fundamentally different from Categories 1 through 3 because it cannot be manufactured once and then updated periodically. It must be live. The manufacturing process is really a tooling and automation problem, not a documentation problem.
The right architecture continuously feeds pipeline observability data into the context layer. Every time a pipeline runs, the completion timestamp, quality check results, and any anomalies detected are written to a context metadata store that the AI can query at analysis time. DataOps Observability and similar tools generate exactly this data as a byproduct of normal pipeline operation. The engineering work is building the connector that makes it available to the AI context layer.
For teams that do not yet have pipeline observability instrumented, the minimum viable version of Category 4 is a freshness table: a simple registry that records the last-updated time for each AI-accessible table, maintained by the pipelines themselves as a final step in each load. That is not the full picture, but it is better than silence.
How it decays and how you maintain it
Category 4 does not decay in the same way documentation does. It is a live state. The maintenance challenge is not updating it; it is ensuring the automation that populates it continues to run correctly as pipelines evolve. The risk is that a pipeline is refactored, the freshness write step is inadvertently dropped, and the context layer starts serving stale quality metadata. Treat the Category 4 pipeline with the same monitoring discipline you apply to your data pipelines.
Category 5: Organizational and Operational Context
What it is
This is the category that distinguishes an AI that reports from one that reasons. And it is the hardest one to build, because the context it requires cannot be retrieved from databases. It can only be captured prospectively, at the moment business events occur.
A dip in prescription volume during a territory realignment is not the same as a dip caused by competitive pressure. A spike in ticket volume the week after a product launch is not the same as an organic increase in support demand. Without an organizational and operational context, the AI cannot tell the difference. It will see the number and report it accurately. It will not understand what caused it.
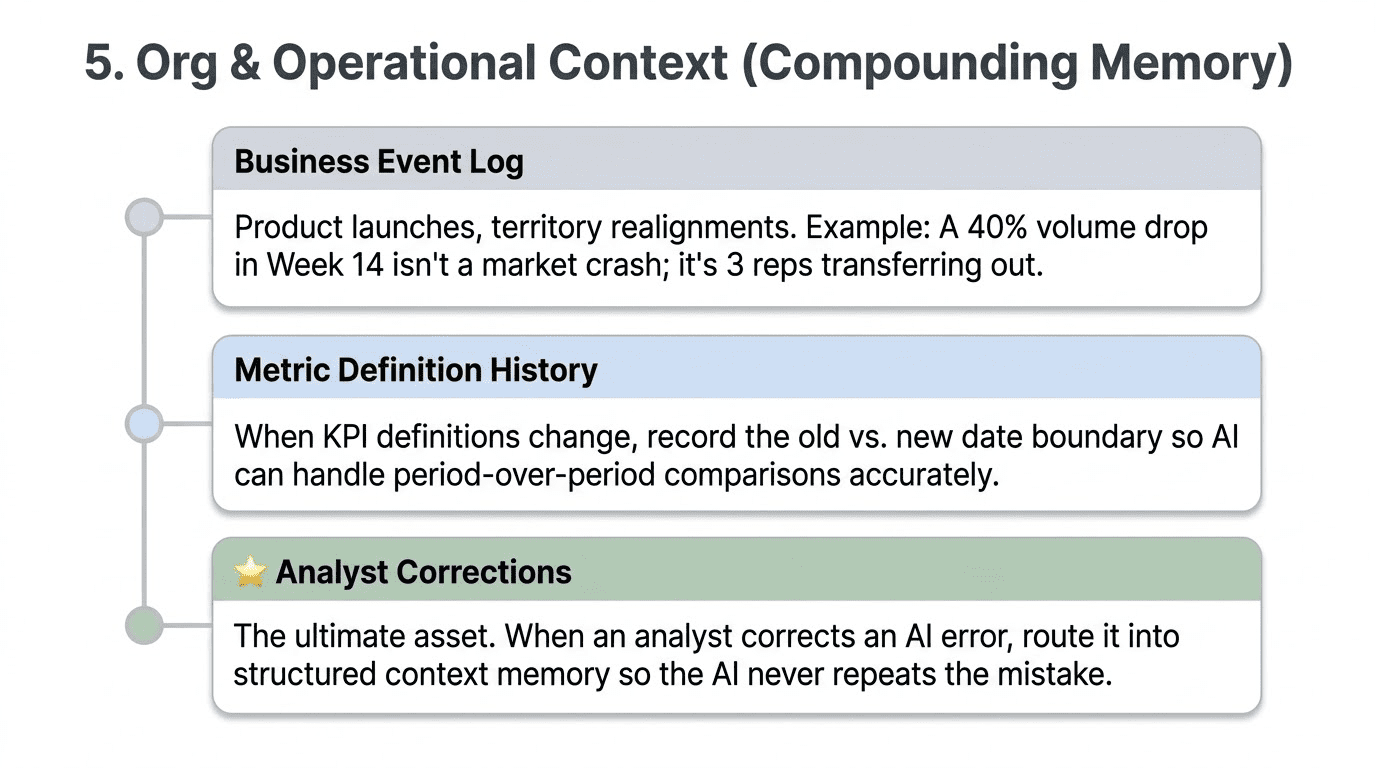
Business event timeline. Product launches, pricing changes, feature rollouts, organizational restructurings, territory realignments, promotional windows, competitive events, and regulatory approvals. Any event that changes the relationship between business activity and the data that records it. This timeline should be stored as a structured log, queryable by date range, product, territory, and event type. When the AI analyzes a time series and detects an anomaly, it should be able to check the event log and surface relevant context. The 40 percent drop in Cobenfy territory scripts in week 14 is explained by the three HCPs who transferred out of the territory in the realignment that week. Without the event log, the AI can only report the drop. With it, it can explain it.
Metric definition history. When a KPI definition changes, the change needs to be recorded: when the new definition replaces the old definition, and when the transition date occurs. This is not the same as updating the current definition in Category 2. It is a versioned history that allows the AI to correctly answer questions that span the change date. If an analyst asks how Q1 2026 revenue compares to Q1 2025, and the revenue definition changed in March 2026, the AI needs to know that it is comparing numbers computed on different bases. Without that context, the comparison will lack caveats and produce a number that is technically accurate but misleading.
Canonical source rules and change history. Which system is authoritative for which metric, and when did that designation change? If you migrated your revenue source from the ERP to a new data product in Q3 2025, questions spanning that migration require knowing which source to use for each period. This operational context is rarely documented and frequently confuses both human and AI analysis.
Analyst corrections and annotations. This is the most compounding asset in the entire context stack, and it is the one most teams fail to capture. Every time an AI gives a wrong answer and an analyst corrects it, that correction provides information about the right approach. If those corrections are captured, stored, and fed back into the context layer, the AI stops making the same mistake. If they are not captured, every user encounters the same error independently and fixes it in a conversation that disappears.
OpenAI’s internal data agent demonstrates why this matters at scale. Their learning memory layer, which stores corrections from past queries and applies them to future queries, reduced query time on certain tasks from 22 minutes to 90 seconds. The memory is not making the model smarter. It is preventing the model from redoing work that has already been done correctly.
How do you manufacture it?
The event timeline can be bootstrapped from existing records: git commit history, product launch announcements, CRM notes, HR systems for org changes, and territory management systems for alignment changes. The initial population is a research and curation exercise, typically a few days’ work for a single domain.
The harder problem is prospective capture. Once you have an event log, someone needs to maintain the habit of writing to it when business events occur. This is not a technical problem. It is an organizational process problem. The event log needs to be easy to write to (a simple form, an integration with your ticketing or project management system, a Slack bot that asks for structured input when certain kinds of changes are announced), and someone needs to own the discipline of keeping it current.
Analyst corrections require an explicit feedback mechanism in whatever interface analysts use to interact with the AI. When an analyst says, “This answer is wrong, the correct approach is X,” that correction needs to be captured in a structured form and routed to the context layer rather than disappearing into a chat history.
How it decays and how you maintain it
Category 5 has a different decay dynamic than the others. The business event timeline and metric definition history do not get stale in the same way that pipeline freshness data does. Old events remain relevant for answering historical questions. The maintenance challenge is gaps: events that happened but weren’t recorded, corrections made conversationally but not captured. Periodically auditing the event log against known business history helps identify gaps. Making it easy to add entries is the primary prevention mechanism.
Category 6: Policy and Entitlements
What it is
Category 6 is the context that specifies what a particular analyst is allowed to see, compute, and disclose. In most implementations, this is treated as a security layer separate from context, enforced at the database level through row-level security and column masking. That enforcement layer is necessary but not sufficient. The AI also needs to understand the policy context that governs what it should do, not just what it is technically permitted to access.
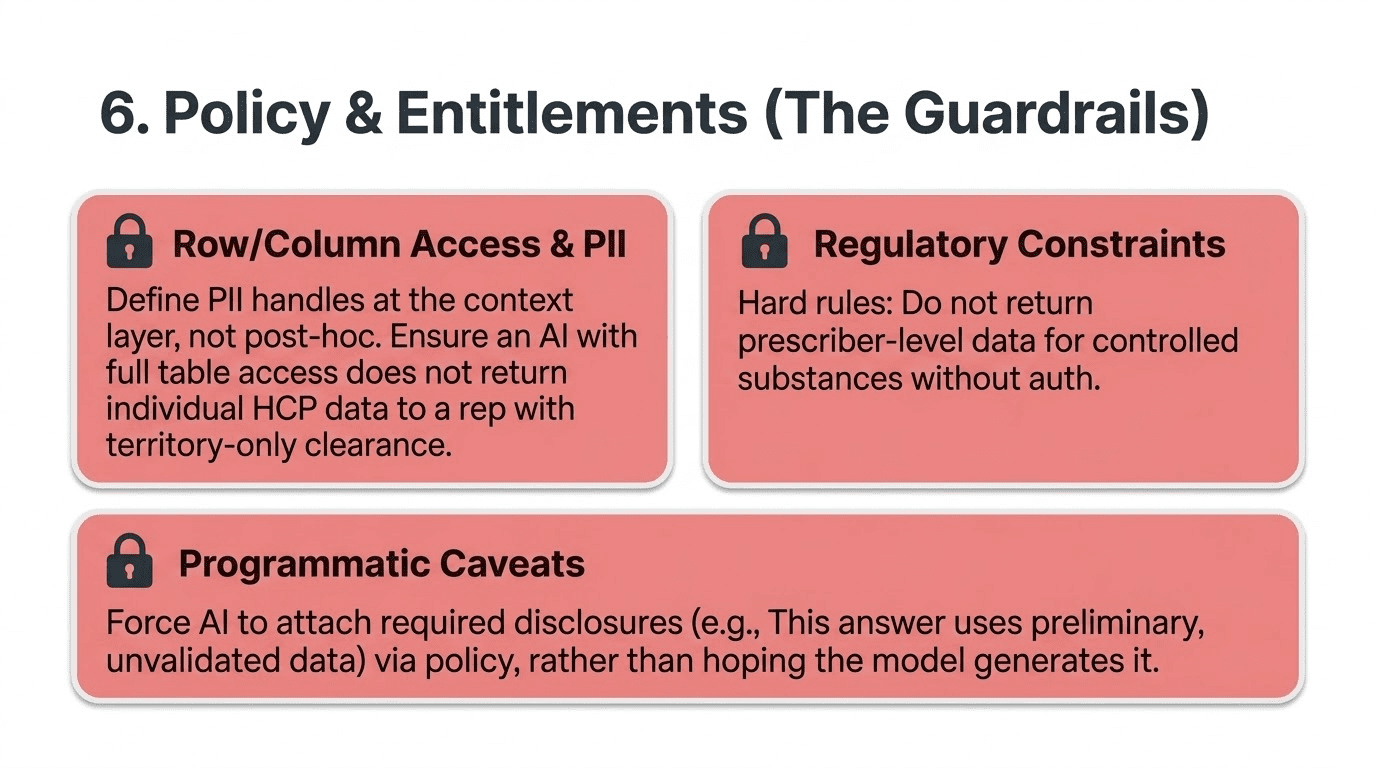
Row- and column-level access rules. Which data is this analyst or agent allowed to retrieve? An AI that can access all rows in a prescriber table should not return individual-level HCP prescribing data to a sales rep who only has territory-level access. Row-level security enforces this at the database level. Context-level policy documentation tells the AI how to behave when the enforcement layer returns partial results: do not attempt to reconstruct suppressed rows; do not infer individual values from aggregates; and flag when results are partial due to access controls.
PII handling requirements. Which columns contain personally identifiable information, and how must they be treated in query results? This needs to be defined at the column level in the context layer, not discovered post-hoc when a report accidentally exposes individual-level data. The AI should know before it constructs a query whether the tables involved contain PII and what the handling requirements are.
Regulatory constraints. In pharma, finance, healthcare, and other regulated industries, certain computations or disclosures have compliance implications. “Do not return prescriber-level data for controlled substances without verifying rep-level authorization.” “This market research data is for internal analysis only and must not be shared externally.” “All preliminary data answers must be accompanied by a disclosure that the data has not been validated.” These are constraints that need to be enforced programmatically, not left to the AI’s judgment or the analyst’s memory.
Required disclosure caveats. When an answer must be accompanied by specific language, that language should be attached programmatically, not generated by the model. “This answer uses preliminary data that has not been validated for the period ending March 31, 2026.” “This metric is currently under review and may be revised.” The AI should not be inventing these caveats; it should be surfacing them from the policy layer when they apply.
How do you manufacture it?
Category 6 manufacturing typically involves three stakeholders: the data governance team (which owns the policy definitions), the security team (which owns the enforcement layer), and the analytics team (which owns the user experience). The policy documentation itself is usually an extension of existing governance artifacts: data dictionaries that already identify PII columns, security policies that already define row-level access rules, and compliance documentation that already describes regulatory constraints. The engineering work is translating these existing artifacts into a form that the AI context layer can consume.
For regulated industries, this category should be designed before you start building Categories 1 through 5. It is much harder to retrofit access controls and disclosure requirements than to design them in from the beginning.
How it decays and how you maintain it
Category 6 decays on policy change events, such as when RBAC roles change, regulatory requirements are updated, or new data classifications are introduced. It tracks your existing governance and compliance change management processes. The maintenance discipline is making context-layer updates part of any governance policy change workflow, just as documentation updates are required for any data model change.
Context Engineering Runs Parallel to Data Engineering
Here is the shift in thinking that brings all six categories together, and it is the core insight that this post is building toward.
For as long as data warehousing has existed, data engineering and context have been sequential rather than parallel. Engineers build pipelines, land data in tables, and then, eventually, someone writes documentation. Usually later than planned, usually less complete than intended, and usually not updated when the pipeline changes.
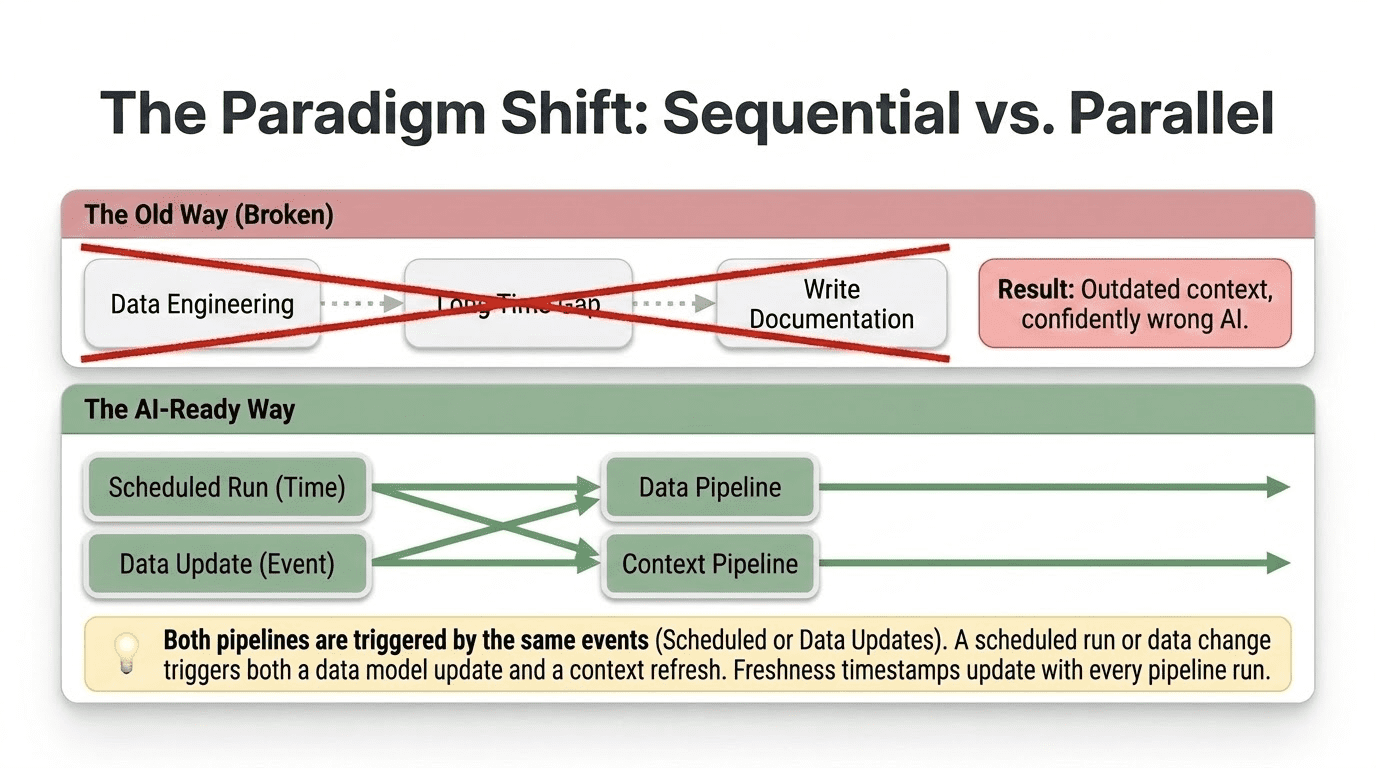
That sequence does not work for AI systems. An AI assistant that queries a table without current context is not usable. It is worse than useless, because it returns incorrect answers with confidence rather than no answers at all. The context is not optional documentation. It is a required input to a production system, just asy data.
This means context engineering needs to run in parallel with data engineering, not after it.
Every time a new table is created, a context artifact is generated alongside it: a table purpose statement, a grain declaration, column annotations, and join path documentation. Not weeks later. At deployment time. The same CI/CD process that creates the table creates the context.
Every time a pipeline is updated, the context artifacts are updated as well. Column definition changed? Context updated. Grain changed? Context updated with the new grain and a note about what changed and when. Table deprecated? Context updated with the deprecation date and the pointer to the replacement.
Every time a pipeline runs, the Category 4 context is refreshed automatically. Freshness timestamps are written. Quality check results are recorded. SLA status is updated. This happens as part of the pipeline execution, not as a separate manual process.
When business events occur, the Category 5 context is written. The product launch is recorded. The territory realignment is logged. The metric definition change is versioned. This requires organizational habits more than technical infrastructure, but the technical infrastructure needs to be ready to receive the input.
When an analyst corrects an AI answer, the correction is captured, routed into the context layer, and not lost in chat history; it is captured, structured, and stored.
In practice, this looks like a context pipeline that runs alongside your data pipeline. Your data pipeline extracts, transforms, and loads data. Your context pipeline extracts, generates, validates, and loads context. They share triggers. A data pipeline completion event triggers both a data quality check and a context freshness update. A schema migration triggers both a table update and a context artifact update. A deployment event triggers both a data model change and a context documentation change.
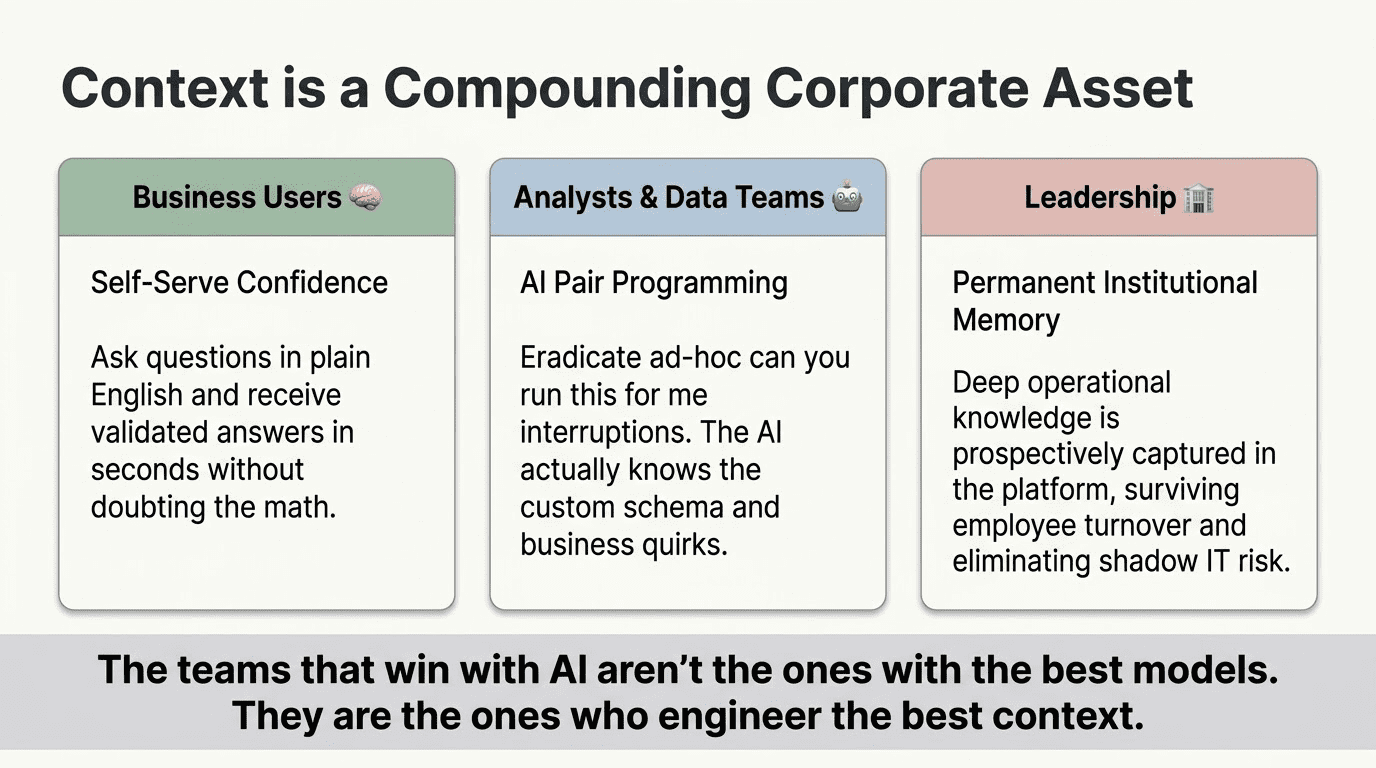
The teams that build this infrastructure end up with something their competitors cannot easily replicate. Every business event captured in the context layer makes the AI more accurate when answering questions about that period. Every captured analyst correction reduces the AI’s likelihood of repeating the same mistake. Every validated, stored example query improves the AI’s performance on the question types your analysts care about most. The context layer accumulates value over time and cannot be replicated retroactively. You can copy a schema. You cannot reconstruct the operational history and institutional knowledge that has been prospectively captured in a context layer that has been running for two years.
The Build Order
Given everything above, the practical question is where to start. The answer depends on where your pain is greatest, but the general priority sequence holds across most implementations.
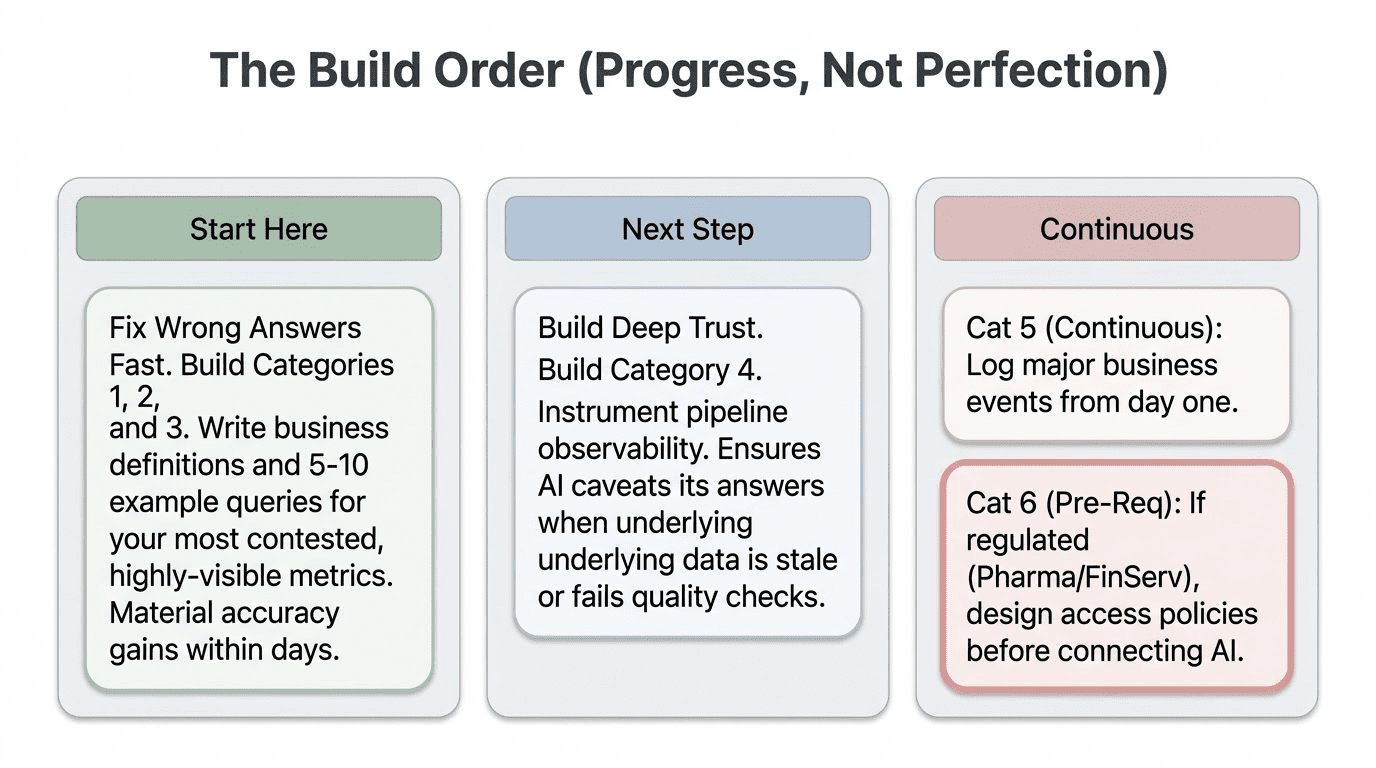
Start with Categories 1 through 3 if your AI is giving technically plausible but incorrect answers. These three categories resolve the vast majority of wrong-table, wrong-join, and wrong-definition failures. They are the most automatable, produce the fastest results, and offer the clearest return on investment. Table purpose statements, grain declarations, and five to ten validated example queries for your most common question types will materially improve AI accuracy within days of deployment, not months.
Add Category 4 once the basics are working, if your AI gives correct answers on clean data but fails when data is stale or has quality issues. This requires pipeline observability tooling, but the payoff is significant: the AI stops presenting stale answers with the same confidence as fresh ones, and it can caveat results when quality checks have recently failed on the underlying data. Without this, your analysts eventually stop trusting the AI, not because the model is wrong, but because they cannot tell when the data it is querying is reliable.
Build Category 5 continuously, starting from day one. The business event timeline and analyst correction capture need to start immediately, even if they start simply. Every week of operational history that goes unrecorded is context permanently lost. A simple log that records major business events, with date and brief description, is infinitely better than no log. You can always enrich it later. You cannot reconstruct it.
Design Category 6 before you start, if you are in a regulated industry. Access controls and disclosure requirements are much easier to design in than to retrofit. In pharma, finance, and healthcare, especially, the time to think about PII handling and regulatory constraints is before you connect the AI to production data, not after the first compliance incident.
Closing: Context Is Infrastructure
The six categories of context in this post are not just documentation—they are infrastructure. This layer sits between your data and your AI, transforming schemas into meaning, tables into business concepts, and raw query results into answers your analysts can trust.
Like any infrastructure, context requires engineering effort, regular maintenance, and discipline. But unlike most infrastructure, its value grows over time. A well-built, well-maintained context layer becomes a lasting asset, capturing years of knowledge in a form AI can use, even after the people who knew it have left.
The teams that will win with AI are not the ones with the best models. Models are becoming commodities. The teams that will win are the ones that do the foundational data work. Data Trust. Data Experience. Context. When built and maintained in parallel, those three things turn AI on your data from a demo that looks impressive but disappoints in production into a system your analysts actually rely on.
DataKitchen builds the platform and methodology for data engineering and context engineering. Open-source tools, including TestGen (automated data quality testing) and DataOps Observability (pipeline monitoring), are available at datakitchen.io. DataKitchen also offers Build, Operate, Transfer services that build production-grade DT + DX + CTX implementations and transfer them to your team, fully operational.
If you want to see these ideas worked through in more depth, with live schema examples and before-and-after walkthroughs from real Snowflake and Databricks deployments, watch the recording of the April 2026 webinar: 10x Your AI Data Analysis: The Context Engineering Formula That Works.
Next webinar: 10x Your Data Engineering Productivity. April 30, 2026. Register at info.datakitchen.io.