What data quality dashboards should a SQL Server and Power BI team build?

Build each dashboard from test results, not raw data profiling statistics, and aim it at one audience: dimension and Critical Data Element scorecards for governance and compliance, source and consumer scorecards for engineers and report owners, a business goal view in Power BI for executives, and a ticket queue for fixes. Open-source TestGen fills in the four scorecards directly.

Key points

  • DataKitchen's guide to data quality dashboards names six types, each for a different audience: dimension-focused, Critical Data Element (CDE), business goal-focused, data source-focused, data consumer-focused, and ticket-driven workflow.
  • A data quality dashboard should be built from test results rather than raw data profiling statistics, so every number traces to a failing test and every failing test can become a ticket.
  • TestGen's quality score is the product of a profiling score (from hygiene issues) and a testing score (from test failures), and it refreshes after every profiling or test run, per TestGen's Quality Scores documentation in November 2026.
  • A TestGen scorecard can break its score down by Quality Dimension, Data Source, Source System, Business Domain, Stakeholder Group, or Data Product, and shows a separate CDE score computed only from columns flagged as Critical Data Elements in the Data Catalog.
  • Power Query's built-in data profiling tools cover the first 1,000 rows by default, per Microsoft Learn, and show their results only inside the editor, so they cannot feed a dashboard that trends over time.
  • TestGen's documentation, checked November 2026, describes no Power BI connector. It documents a REST API that returns test results and quality score rollups, and Excel exports from the Test Results page and the Data Catalog.

The full argument for each dashboard type lives in A Guide to the Six Types of Data Quality Dashboards. This page maps those six types onto a Microsoft shop: tables in SQL Server, Azure SQL, Synapse, or Fabric, and reports in Power BI. The question is the same one the guide asks first: who is your customer for this data?

The six dashboards on a SQL Server and Power BI stack
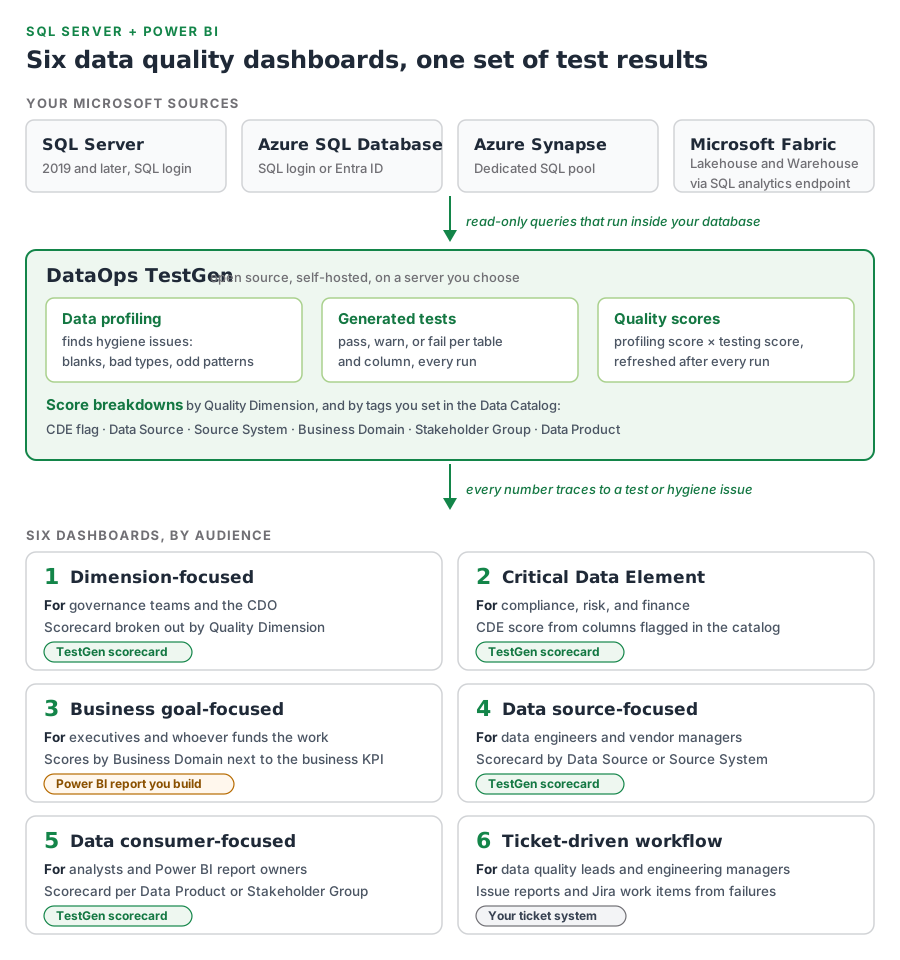
Diagram. Four Microsoft sources, SQL Server 2019 and later, Azure SQL Database, Azure Synapse, and Microsoft Fabric Lakehouse and Warehouse, feed read-only queries into DataOps TestGen. Inside TestGen, data profiling finds hygiene issues, generated tests pass, warn, or fail per table and column, and quality scores multiply the profiling score by the testing score. Scores break down by Quality Dimension and by Data Catalog tags: CDE flag, Data Source, Source System, Business Domain, Stakeholder Group, and Data Product. Six dashboards follow, by audience: dimension-focused for governance and the CDO, Critical Data Element for compliance and finance, data source-focused for engineers and vendor managers, and data consumer-focused for analysts and Power BI report owners, all four as TestGen scorecards; business goal-focused for executives as a Power BI report you build; and ticket-driven workflow in your ticket system.
One set of test results, six audiences. Four dashboards are TestGen scorecards; the business goal view lives in Power BI and the ticket view in your ticket system.
DashboardWho it’s forBuilt fromWhere it lives
1. Dimension-focusedGovernance team, CDOScores broken down by Quality DimensionTestGen scorecard
2. Critical Data ElementCompliance, risk, financeCDE score from columns flagged in the Data CatalogTestGen scorecard
3. Business goal-focusedExecutives, budget holdersScores by Business Domain, next to the business metricPower BI report you build
4. Data source-focusedData engineers, vendor managersScores by Data Source or Source SystemTestGen scorecard
5. Data consumer-focusedAnalysts, Power BI report ownersScores per Data Product or Stakeholder GroupTestGen scorecard
6. Ticket-driven workflowData quality leads, engineering managersFailed tests turned into issue reports and work itemsJira or your ticket system

TestGen’s scorecards and their breakdown categories come from the Quality Scores and Data Catalog docs, checked November 2026. Most teams run more than one of these, because each audience wants a different cut of the same data.
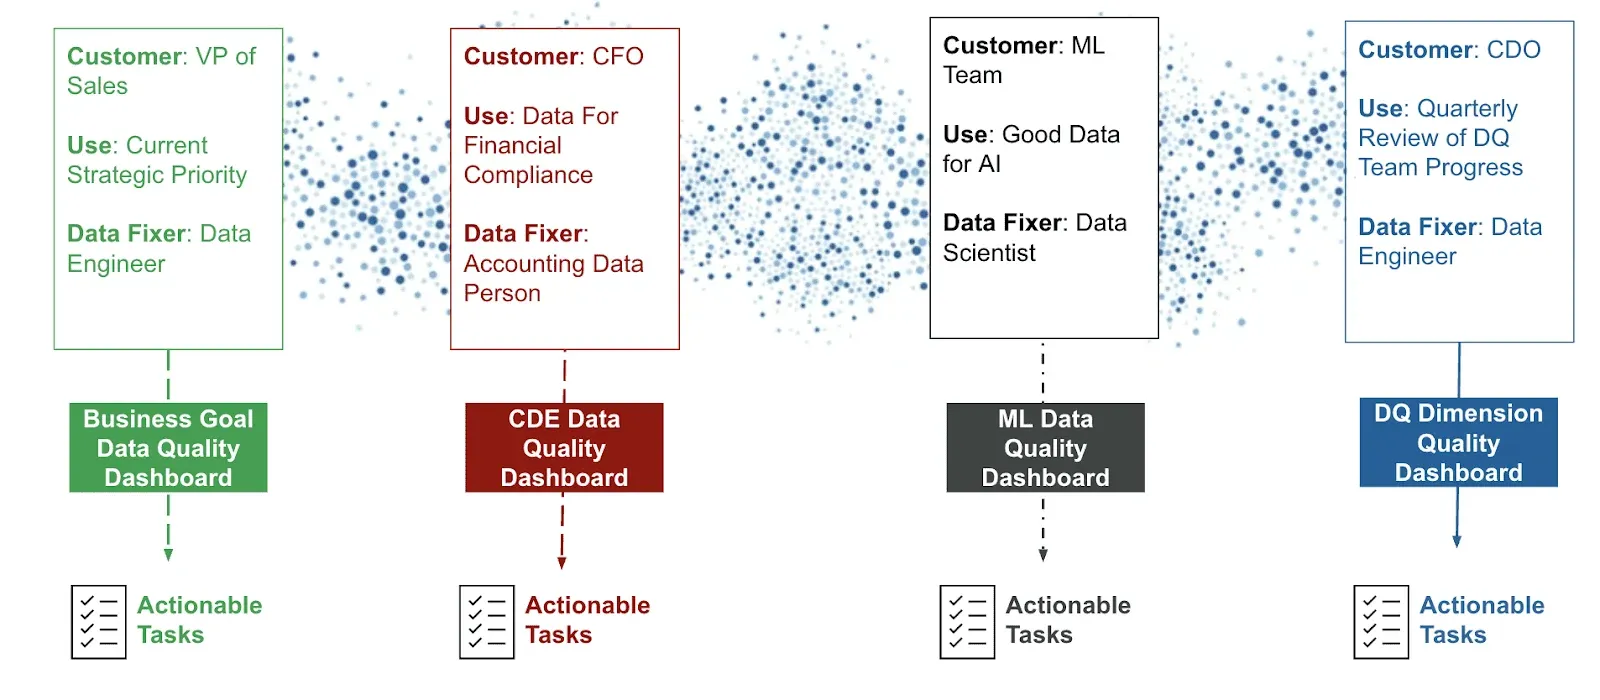
Four data consumers mapped to four different dashboards: a VP of Sales to a business goal dashboard, a CFO to a CDE dashboard, an ML team to an ML data quality dashboard, and a CDO to a dimension dashboard, each ending in actionable tasks.
Different people, different dashboards, the same goal: tasks somebody can act on. From the six-dashboards guide.

Build every dashboard on test results

The guide’s test results equivalence principle decides whether any of the six works: every number on a dashboard should trace to a failing test, and every failing test should become a ticket somebody can fix. Once the fix lands, the same test proves it on the next run.

That rules out the shortcut most Power BI authors reach for. Power Query’s data profiling tools show column quality, distribution, and statistics, but over the first 1,000 rows by default, and only inside the editor. A completeness percentage from a profile tells you a number moved. It doesn’t tell you which rows, which rule, or who should fix it.

TestGen’s score is built the other way. Per its Quality Scores page, the overall score is the profiling score (from hygiene issues found during data profiling) multiplied by the testing score (from test failures), recalculated after every run. Dismiss an issue and it stops counting. Click any row in a score breakdown and you get the hygiene issues and test failures behind it.
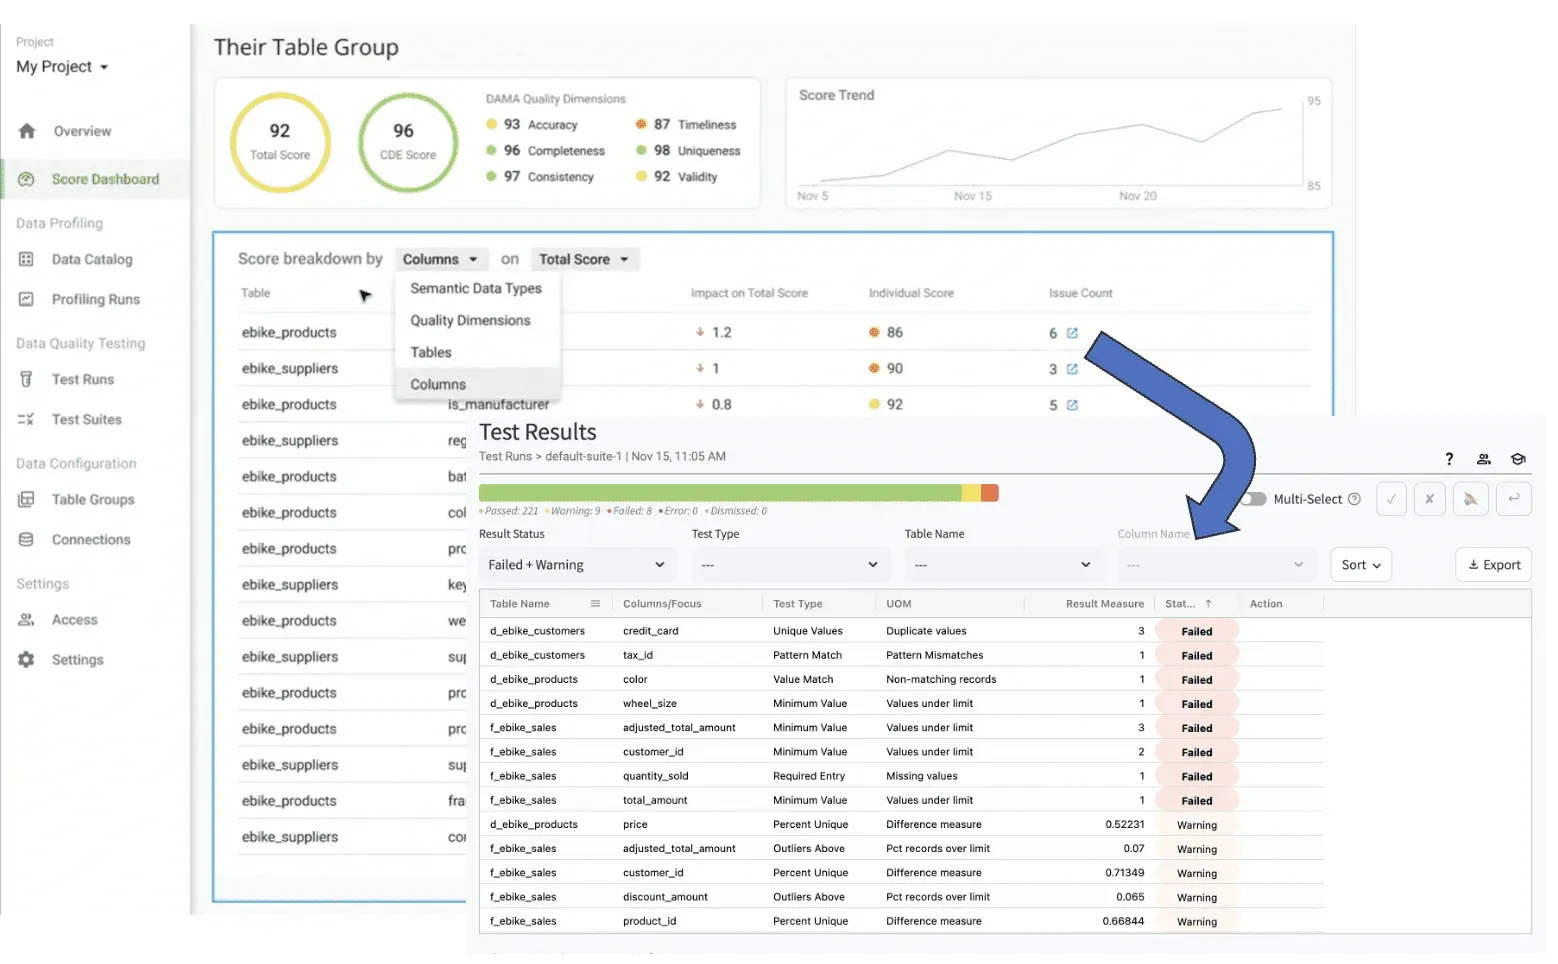
Drilling from a table group score into the breakdown by column and quality dimension, then into the individual failed and warning test results behind it.
From a score to the failing tests behind it, in TestGen.

What each dashboard looks like in a Microsoft shop

1. Dimension-focused

For governance teams that report against completeness, accuracy, consistency, timeliness, uniqueness, and validity. TestGen breaks any scorecard down by those six quality dimensions, so this one exists as soon as you have a profiling run and a test run. It’s a good broad brush and a poor motivator: pair it with one of the narrower views.

2. Critical Data Element

For compliance, risk, and finance, especially where a regulator names the fields. Flag CDEs in TestGen’s Data Catalog by hand, in bulk, by CSV import, or with automatic detection during data profiling, and the scorecard shows a CDE score computed only from those columns, next to the total.
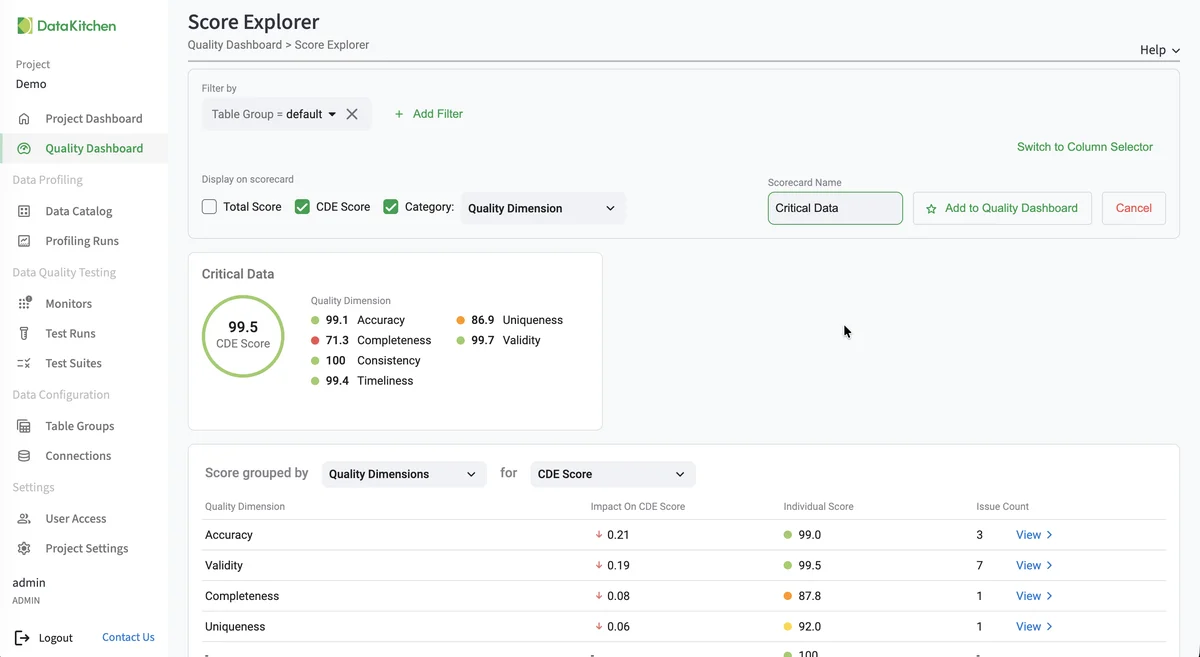
TestGen Score Explorer building a scorecard named Critical Data, with the CDE score of 99.5 broken out by quality dimension: accuracy 99.1, completeness 71.3, consistency 100, timeliness 99.4, uniqueness 86.9, validity 99.7, and a table of each dimension's impact on the CDE score with issue counts.
Score Explorer in TestGen: a CDE scorecard broken down by quality dimension, from a demo project.

3. Business goal-focused

For executives and whoever funds the work. This is the one that belongs in Power BI, because the business metric it sits next to (revenue, fulfillment rate, a launch target) is already there. Tag tables with a Business Domain in TestGen so scores roll up the way the business is organized, then put that score beside the KPI it affects.

4. Data source-focused

For data engineers and the people who manage vendors and upstream systems. Tag tables in the Data Catalog with Data Source or Source System, and a scorecard ranks them by the quality they deliver. The guide’s caveat holds: you can measure a supplier without being able to make them care, so the scorecard is evidence for a conversation, not the fix.

5. Data consumer-focused

For analysts, data scientists, and the owners of specific Power BI reports. Tag the tables behind a report with a Data Product or Stakeholder Group, then save a scorecard filtered to that tag, so a report owner sees only the data their report reads. Expect requests for one per team, and keep them as saved filters rather than separate builds.

6. Ticket-driven workflow

For data quality leads who need to show remediation progress. TestGen produces the tickets’ raw material: a PDF issue report per failed test with sample rows and the SQL behind it, and notifications that post to Microsoft Teams or feed a Jira Cloud automation rule that creates work items. The dashboard of tickets opened and closed lives in your ticket system. It measures work done, not data quality, so run it alongside one of the scorecards.

Where Power BI fits

TestGen’s docs, checked November 2026, don’t describe a Power BI connector, so this page doesn’t claim one. They do document two ways to get results out. The REST API returns run summaries, a run’s individual test results, and a project’s quality score rollup with an optional breakdown. The Test Results page and the Data Catalog export to Excel. Power BI reads both through its standard Web and Excel connectors, so either can sit under a report.

In practice that means the business goal view, and any consumer view you want inside the report it protects, are the ones worth building in Power BI. The dimension, CDE, and source scorecards already exist in TestGen.

Supported Microsoft sources and cost

TestGen connects to SQL Server 2019 and later with a SQL login, Azure SQL Database, Azure Synapse, and Microsoft Fabric Lakehouse and Warehouse through the SQL analytics endpoint. It reads only, runs its queries inside your database, and is self-hosted on a server you choose. The core is open source under Apache 2.0. Enterprise is $100 per user per month plus $100 per connection per month. Start from the Microsoft install page.

For the walk-through on video, watch A Guide to the Six Types of Data Quality Dashboards and the follow-up masterclass, which builds all six in TestGen.

Documentation: Quality Scores, Explore and Create Scorecards, View Score Details, Data Catalog, Investigate Test Results, Notifications, API.

Frequently asked questions

Short answers to the follow-up questions people ask next.

Can TestGen send data quality results to Power BI?

TestGen's documentation describes no Power BI connector as of November 2026. It documents two ways to get results out: a REST API that returns test run results and a project's quality score rollup, and Excel exports from the Test Results page and the Data Catalog. Power BI reads both web APIs and Excel files through its standard connectors, so a report can be built on either.

Should a Power BI data quality dashboard use Power Query's data profiling?

No. Power Query's column quality, column distribution, and column profile tools cover the first 1,000 rows by default, per Microsoft Learn, and show their results only inside the editor. That is useful while you build a query, but a dashboard needs results that persist and trend. Build it on test results instead, so each number traces to a failing test somebody can fix.

Which data quality dashboard should a SQL Server team build first?

Build the one your most motivated audience will act on. If a regulator or auditor names the fields that matter, start with a Critical Data Element scorecard. If your problem is upstream feeds, start with a data source scorecard. TestGen can create a scorecard for a table group while you set it up, so the first dashboard exists after one data profiling run and one test run.

How do you build a Critical Data Element dashboard on SQL Server?

Flag the critical tables and columns in TestGen's Data Catalog, then turn on the CDE score on a scorecard. TestGen computes that score only from CDE-flagged columns. Flags can be set by hand, in bulk, through a CSV import, or by automatic detection during data profiling when it is enabled on the table group, per TestGen's Data Catalog documentation in November 2026.

Can data quality failures become Jira tickets or Microsoft Teams alerts?

Yes. TestGen's notifications post to a Microsoft Teams channel through the Workflows app, and a generic webhook can feed a Jira Cloud automation rule that creates a work item for each notification. You can also download a PDF issue report for any failed test, with a summary, sample rows, and the SQL behind the check, per TestGen's documentation in November 2026.

Which Microsoft databases does TestGen support?

TestGen connects to SQL Server 2019 and later with a SQL login, Azure SQL Database, Azure Synapse, and Microsoft Fabric Lakehouse and Warehouse through the SQL analytics endpoint. It reads only, runs on a server you choose, and is open source under Apache 2.0. Enterprise costs $100 per user per month plus $100 per connection per month.

Try it on your own data

DataOps TestGen is free and open source. Profile a table and generate its tests this afternoon.