If you’re a data engineer tired of being the last to hear when something goes wrong, this is for you.
You know the feeling: a business stakeholder messages you at 2 PM on a Tuesday saying, “Hey, the revenue numbers look off.” You open your laptop and spend the next three hours manually querying tables, checking row counts, and trying to figure out what happened to a pipeline that ingested data six hours earlier. Multiply that by a few incidents a month, and you could be losing upwards of a dozen analyst-hours every week just on detective work. By the time you find the cause—a simple upstream schema change no one told you about—the damage is already done.
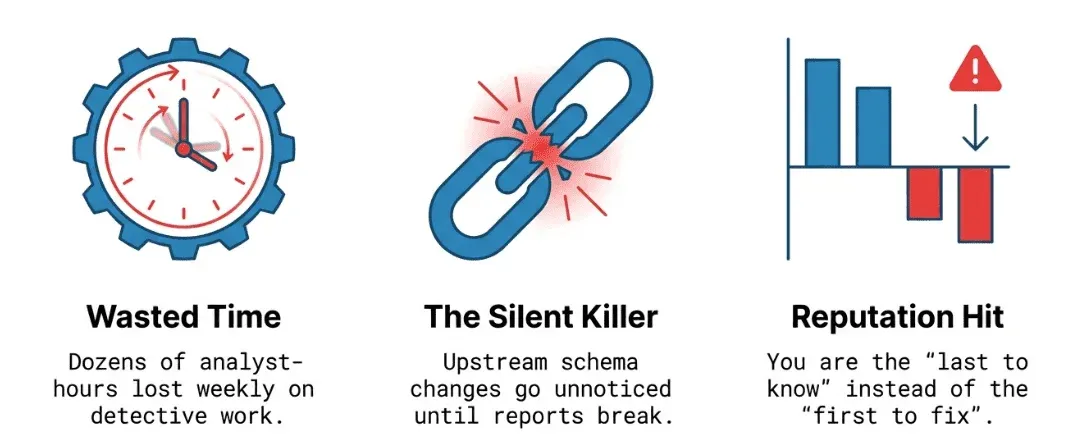
This is the daily grind for data engineers, but it doesn’t have to be. With DataKitchen’s DataOps TestGen, you can be the reliability champion on your team. With open source, you can ensure data stays trustworthy, and issues are resolved before anyone else even notices something’s wrong. Instead of reacting to problems after the fact, you can take pride in being proactive and build a reputation for dependable, flawless data delivery.
What Is TestGen’s New Table Monitoring Feature?
TestGen’s monitoring is based on one simple idea: continuous, automated watching of your data tables without needing you to write any SQL, Python, or YAML. After you set up the tables to monitor, TestGen runs regular checks and uses machine learning to spot problems before they turn into disasters.
Setting Up Monitoring: Simpler Than You’d Think
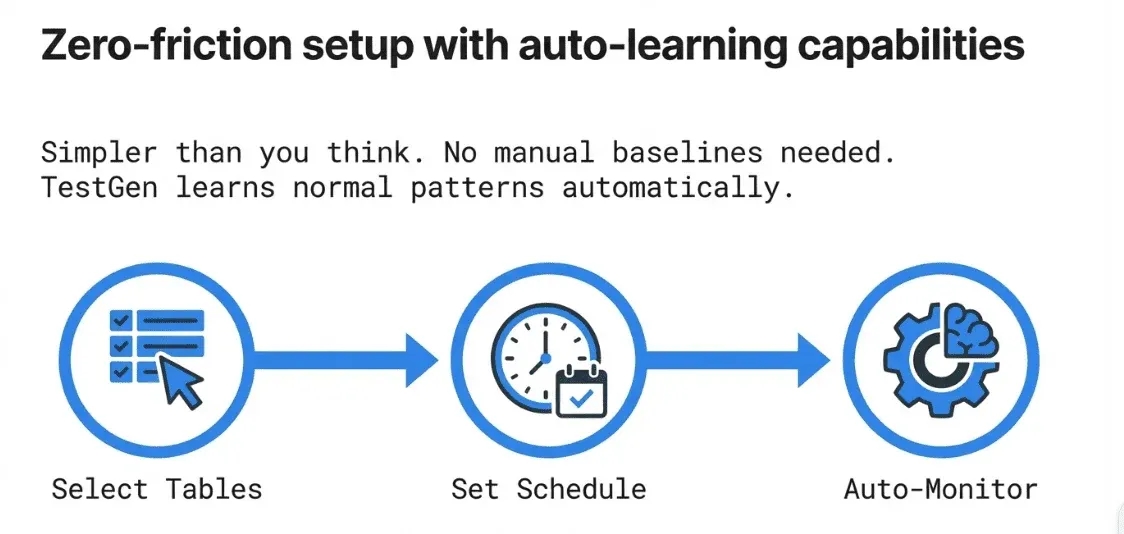
The Monitor Tables workflow in TestGen helps you start monitoring quickly and easily. Just pick the tables you want to watch, set the schedule, and TestGen handles the rest. You don’t have to create thresholds or baseline stats yourself, since TestGen learns your data’s normal patterns and spots anything unusual. For teams that want more control, you can also define custom monitors, set manual thresholds, or override the machine learning-based checks for specific cases. This flexibility lets you cover both the everyday and the edge cases, so you get the level of monitoring that fits your needs.
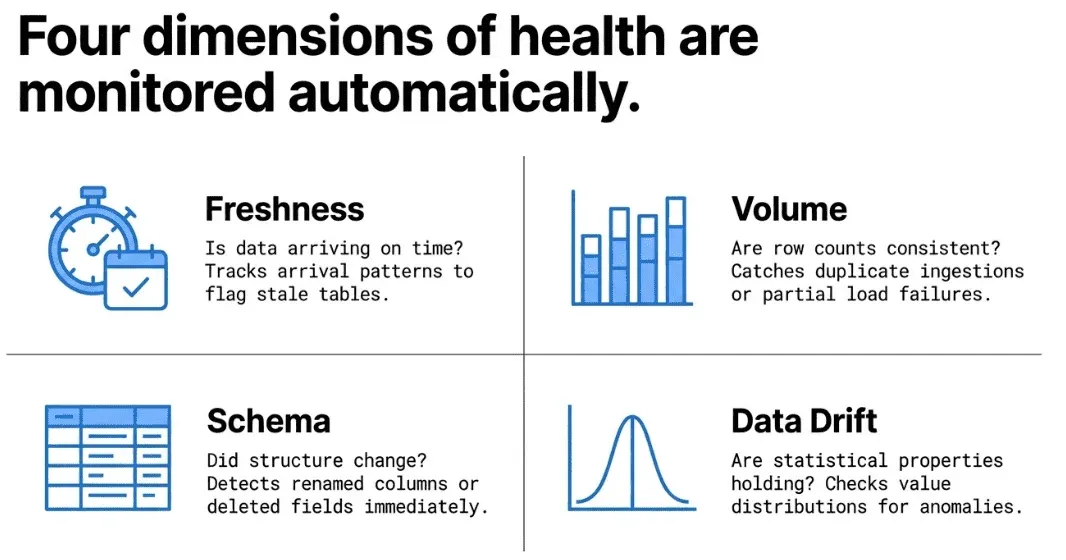
The monitors TestGen generates cover the four dimensions that matter most to data engineers in production:
Freshness — Is your data arriving on time? If a table that normally refreshes every hour suddenly hasn’t received new rows in four hours, you want to know immediately. TestGen tracks data arrival patterns and flags when a table goes stale.
Volume — Are the right number of records showing up? Unexpected spikes or drops in row counts are among the most common signals that something went wrong upstream. TestGen determines whether it’s a duplicate ingestion, a partial load failure, or a row-count issue. TestGen monitors row count trends and alerts you when volume deviates from expected norms.
Schema — Did someone alter a column without telling you? Schema drift is a silent killer in data pipelines. A column that gets renamed, a data type that gets widened, or a field that quietly disappears can break downstream models and reports. TestGen watches your schemas and catches changes the moment they happen.
Data Drift — Are the statistical properties of your data changing in ways that suggest a quality problem? TestGen looks at the actual distributions and characteristics of column values. If a numeric field that normally has values between 0 and 100 suddenly contains values in the thousands, that’s a signal worth investigating. You can add any metric that can be expressed in SQL to monitor for anomalies. Track sales volume, manufacturing output, user conversions, anything your data can tell you about, automatically.
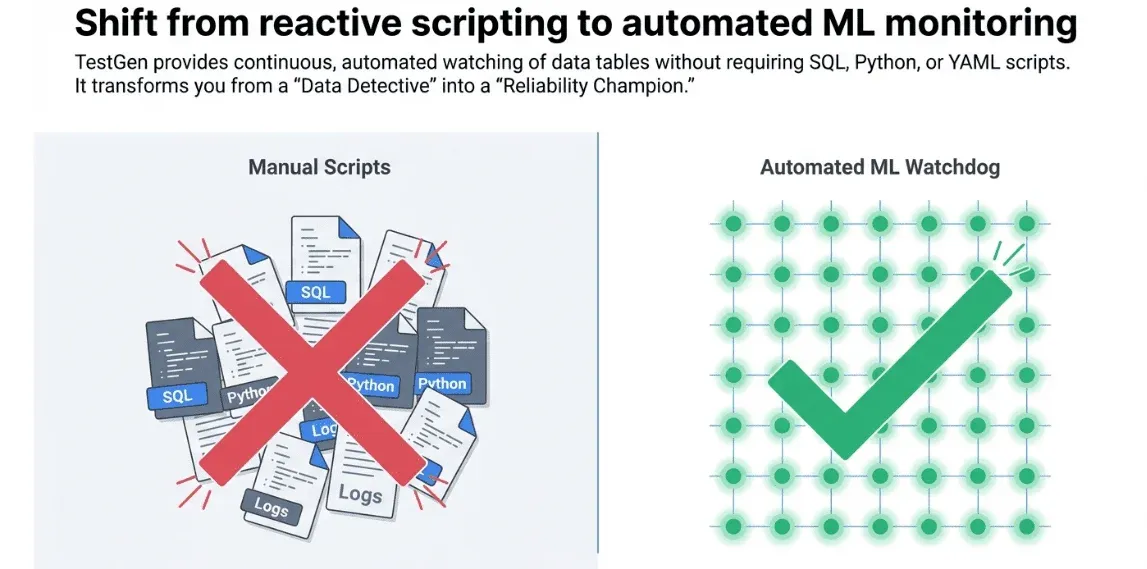
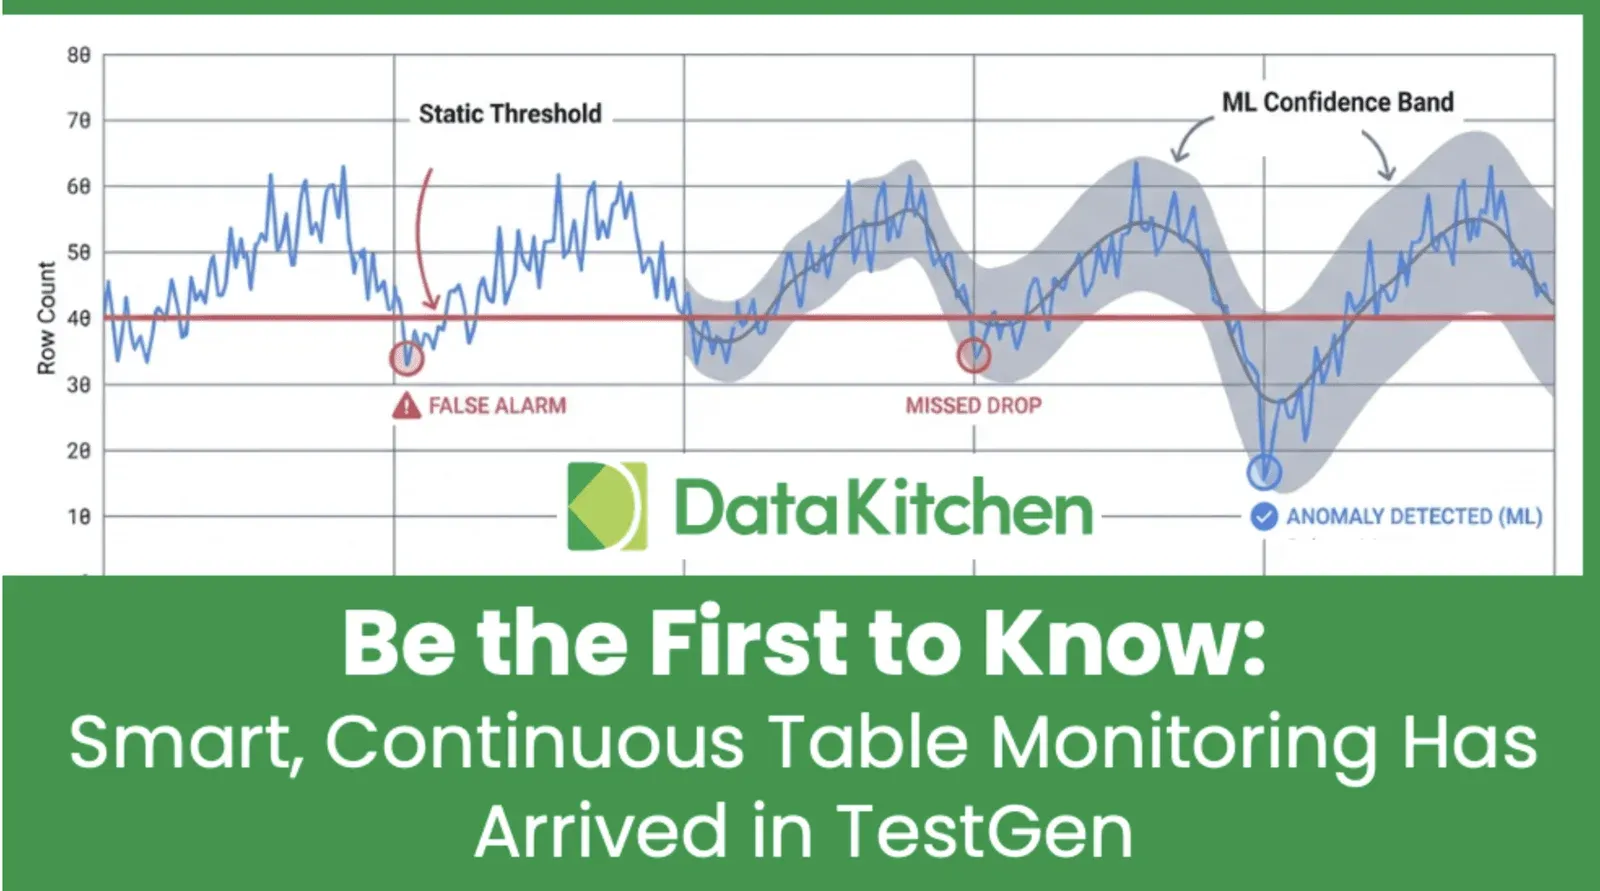
From blunt thresholds to adaptive ML: TestGen’s ML-Based Time Series Anomaly Detection. TestGen stands out from tools that use fixed thresholds or simple rules. Traditional solutions rely on rigid thresholds, creating alerts like “notify me if row count drops by more than 15%” and missing more subtle issues. TestGen advances this limitation by using machine learning models trained on historical time-series data for each table and column. The ML engine learns your data’s natural rhythms, including seasonal patterns, day-of-week changes, and long-term trends, and flags anything unusual. This means fewer false alarms waking you up at night and better detection of subtle, slow problems that fixed thresholds would miss. Other vendors charge extra for this smart detection, but TestGen includes it by default as part of our open source. Why pay $100K for commodity algorithms? When an anomaly is detected, TestGen delivers alerts to your team where they already work: email.
Viewing Monitor Results: A 360° View of Table Health
Once your monitors are running, the View Monitor Results screen gives you a consolidated, actionable view of everything TestGen has observed.
Instead of digging through log files or running random queries to find problems, you get a dedicated UI that shows anomalies in context. The results screen tells you which tables are healthy, which have alerts, and the history of each metric. This is especially helpful when you want to know, “When did this problem actually start?” because the trend data is all right there.
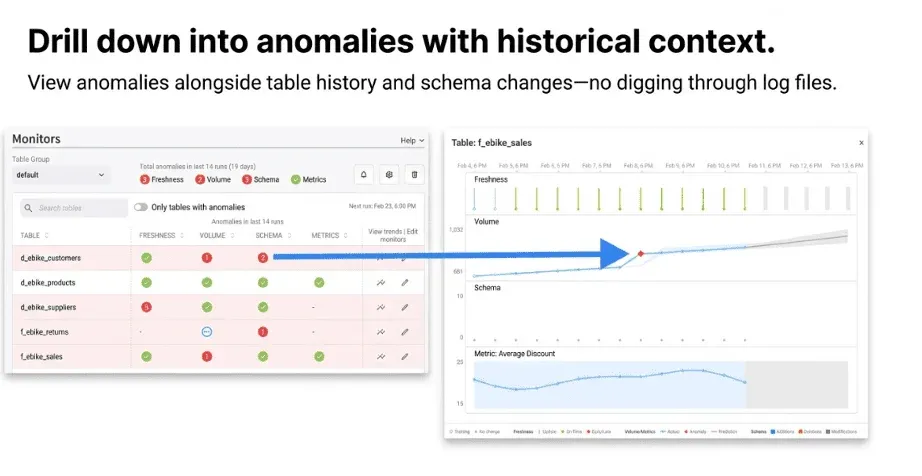
From the monitor results, you can dig into specific anomalies to see how big they are and what caused them. Did row counts drop by 10% or 90%? Did the schema change today or three days ago? This detail helps make monitoring useful rather than noisy alerts you learn to ignore.
The results also feed into TestGen’s broader quality scoring and dashboard capabilities, so monitoring anomalies don’t live in a silo — they connect to the bigger picture of your data estate’s health.
Why This Matters for Data Engineering Sanity
Let’s be direct about what this feature solves for you day-to-day:
You no longer have to manually check whether a nightly batch loaded correctly. You won’t have to wait for users to tell you a dashboard looks off. You don’t need to build and maintain a custom monitoring system or patch together Great Expectations configs and cron jobs. TestGen watches your data so you can focus on building. IT takes minutes to set up, comes with a great UI, and runs on-item for security.
The monitoring works inside your database. TestGen runs queries directly there instead of pulling data out. That means no data copies, no security issues, and no unexpected slowdowns.
Since monitoring is integrated with TestGen’s profiling, test generation, data catalog, and quality dashboards, an anomaly won’t leave you staring at a number alone. You get the full context in one place: the table’s history, column details, and quality test results all in one place.
The Pricing Story: Flat $100 — No Table Tax. Finally, Something That Makes Sense
Here’s something refreshing for teams who have checked prices for other data observability tools and felt sticker shock.
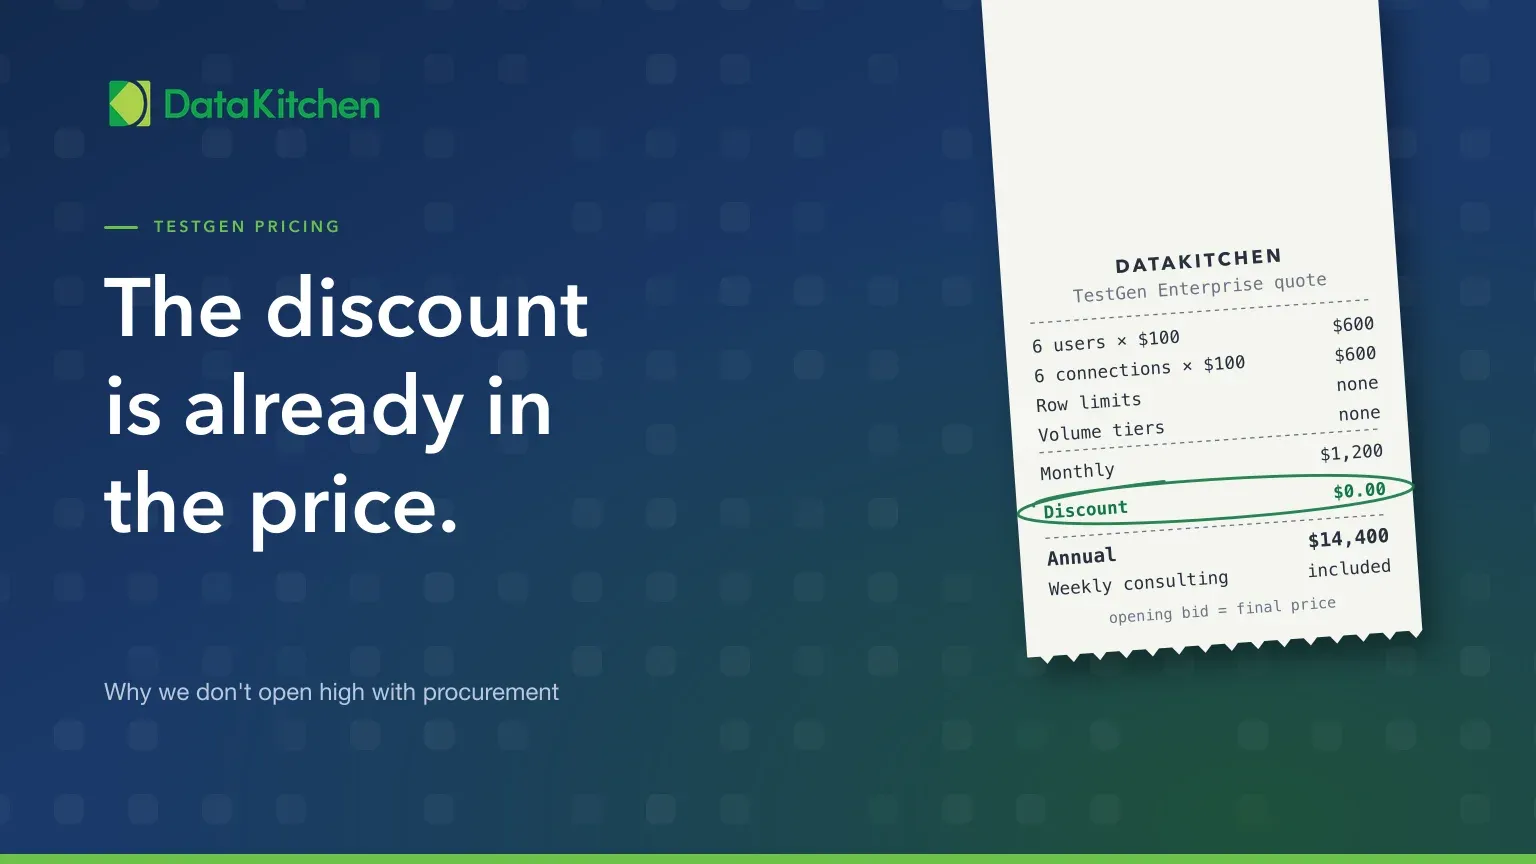
DataKitchen’s Enterprise version of TestGen uses a flat-rate, predictable pricing model: $100 per month, per user, per database connection — and that’s it. Unlimited tables. Unlimited data volume. All features included.
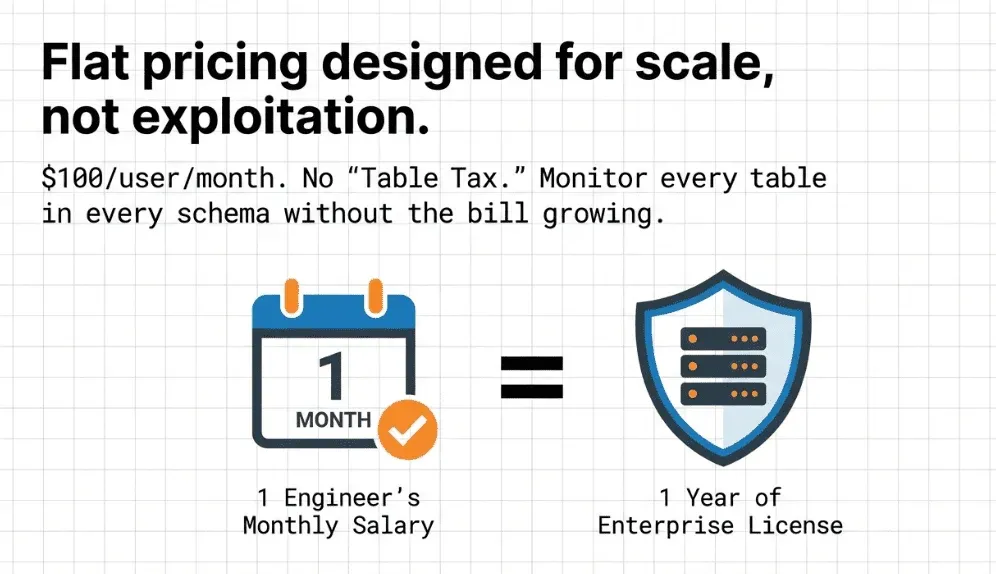
This pricing rejects the “per-table tax” common in data observability. Many vendors charge based on the number of tables you monitor, so the more data you want to protect, the more you pay. That forces teams to pick and choose which tables to watch, hoping they’re right. That’s the opposite of how monitoring should work.
With TestGen’s pricing, there’s no reason to leave any tables unmonitored. You can cover your entire data estate — every table in every schema — without your bill growing out of control. A typical mid-size data team pays just a fraction of what similar closed-source, VC-backed platforms charge for the same coverage.
And if you want to start for free? The open-source version of TestGen is Apache 2.0 licensed and fully functional for individual users. You get one user, one database connection, and the complete feature set running locally or in your own Kubernetes or Docker environment. There’s no feature-gated free tier that forces you to upgrade to the paid plan. It’s a genuine open-source product.
Security and privacy are top priorities for teams adopting new data tools, especially in regulated industries. TestGen securely manages credentials, following best practices for encryption at rest and in transit. Your database credentials are encrypted and never shared outside your configured environment. Since TestGen runs queries directly inside your database and does not move or extract your raw data, your sensitive information stays protected behind your own firewall. TestGen is built with privacy and compliance in mind, making it suitable for environments with strict regulatory requirements. Audit logs and role-based access controls help you monitor and manage who can access monitoring features and data.
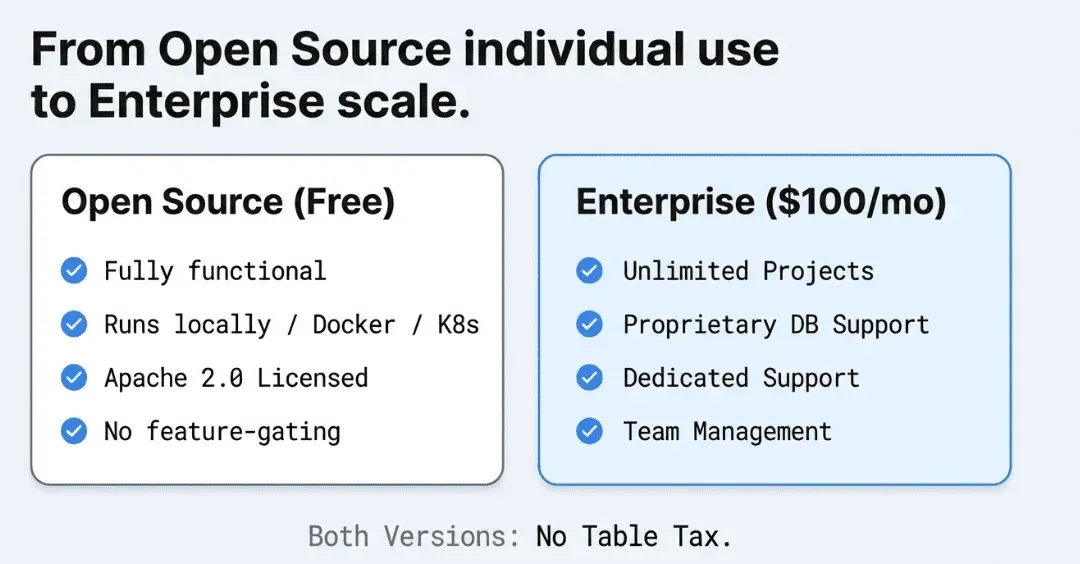
For teams, the Enterprise tier adds unlimited projects, support for proprietary databases, DataKitchen’s dedicated support, and the latest releases — still at that straightforward $100/user/connection rate.
DataKitchen is a profitable, independent company, which means we are not racing to satisfy VC investors by jacking up prices or sunsetting features on a whim. That stability matters when you’re building production monitoring infrastructure.
Getting Started
If you’re ready to stop being the last to know about data problems, TestGen’s monitoring is worth exploring.
- Install the open-source version for free: datakitchen.io/install/testgen
- Review the monitoring documentation: [https://docs.datakitchen.io/testgen/monitor-tables/)
- See the full pricing details: datakitchen.io/pricing
- Request a demo: datakitchen.io/request-a-demo
- Release Note: Version 5.0.2
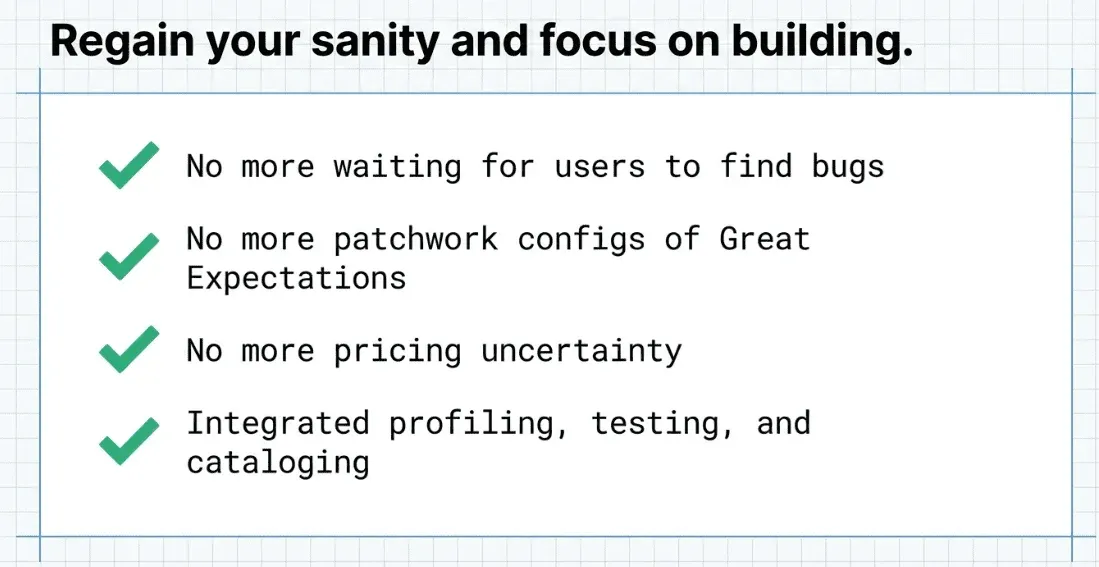
The days of learning about data problems from an angry business analyst should be over. With TestGen’s table monitoring, you’re watching everything automatically and continuously — all for a price your boss will appreciate.
FAQ
What are the key points in this blog?
TestGen adds continuous, automated table monitoring so data engineers stop learning about breakage from an angry analyst. It watches freshness, volume, and schema across the estate without hand-set thresholds. On the enterprise side, the positioning is roughly 90 percent of the features of dedicated observability vendors at about 5 percent of the price.
What is continuous table monitoring?
Continuous table monitoring watches tables for behavioral change over time rather than checking values against rules. It tracks whether a table updated on schedule, whether row counts moved outside their normal range, and whether the schema shifted. Because it learns from each table’s own history, it does not require you to know in advance what normal looks like.
How is monitoring different from data quality testing?
A test compares your data against a number you typed. A monitor learns the pattern from history and flags deviation on its own. That difference matters at scale: nobody can specify an expected row count for four thousand tables, but a monitor can derive one for each. Tests catch wrong values; monitors catch tables behaving strangely.
What does TestGen table monitoring watch for?
Freshness, meaning whether the table updated when it should have. Volume, meaning whether row counts moved outside their learned range. And schema, meaning whether columns were added, removed, or changed type. These are the failures that pass every content check, because the data that did arrive is perfectly valid and simply incomplete or late.
Why are data engineers usually the last to know about a data problem?
Because a pipeline that completes successfully looks the same as one that produced correct data. Green DAGs, no errors, no alerts. The first signal is a person downstream noticing a number looks wrong, which happens after the report has already been read. Monitoring inverts the order so the engineer sees it before the analyst does.
How does TestGen compare to dedicated data observability vendors?
The short version is roughly 90 percent of the features at about 5 percent of the price. The observability market is crowded and the core detection mathematics is widely available, so most of the price difference reflects go-to-market cost rather than capability. The open-source build is free, which makes the comparison easy to run on your own data.