Data Quality vs. Data Observability: The Pets and Cattle of Your Data Estate
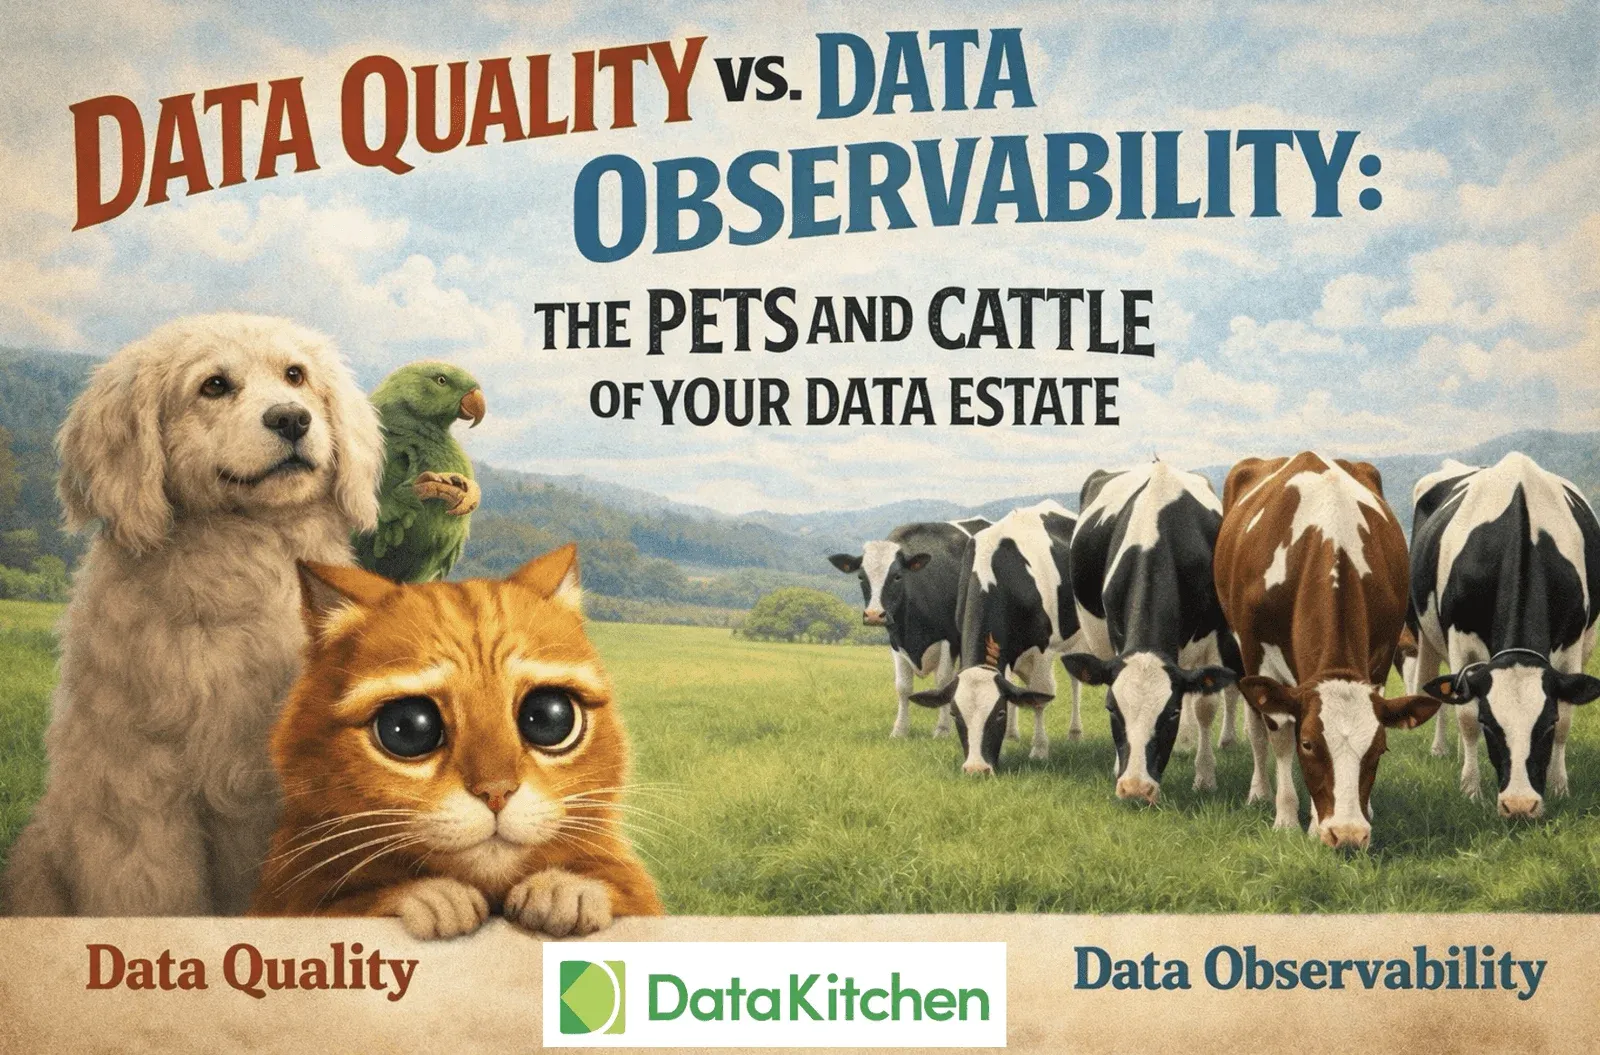
If you’ve spent any time in DevOps circles, you’ve heard the phrase “cattle, not pets.” Randy Bias popularized this analogy around 2012 to explain a fundamental shift in how we think about infrastructure. Pets are precious, unique systems you know intimately and nurture individually. Cattle are herds you manage collectively—you don’t name them or know their personalities, you just need to know they’re healthy enough to go to market.
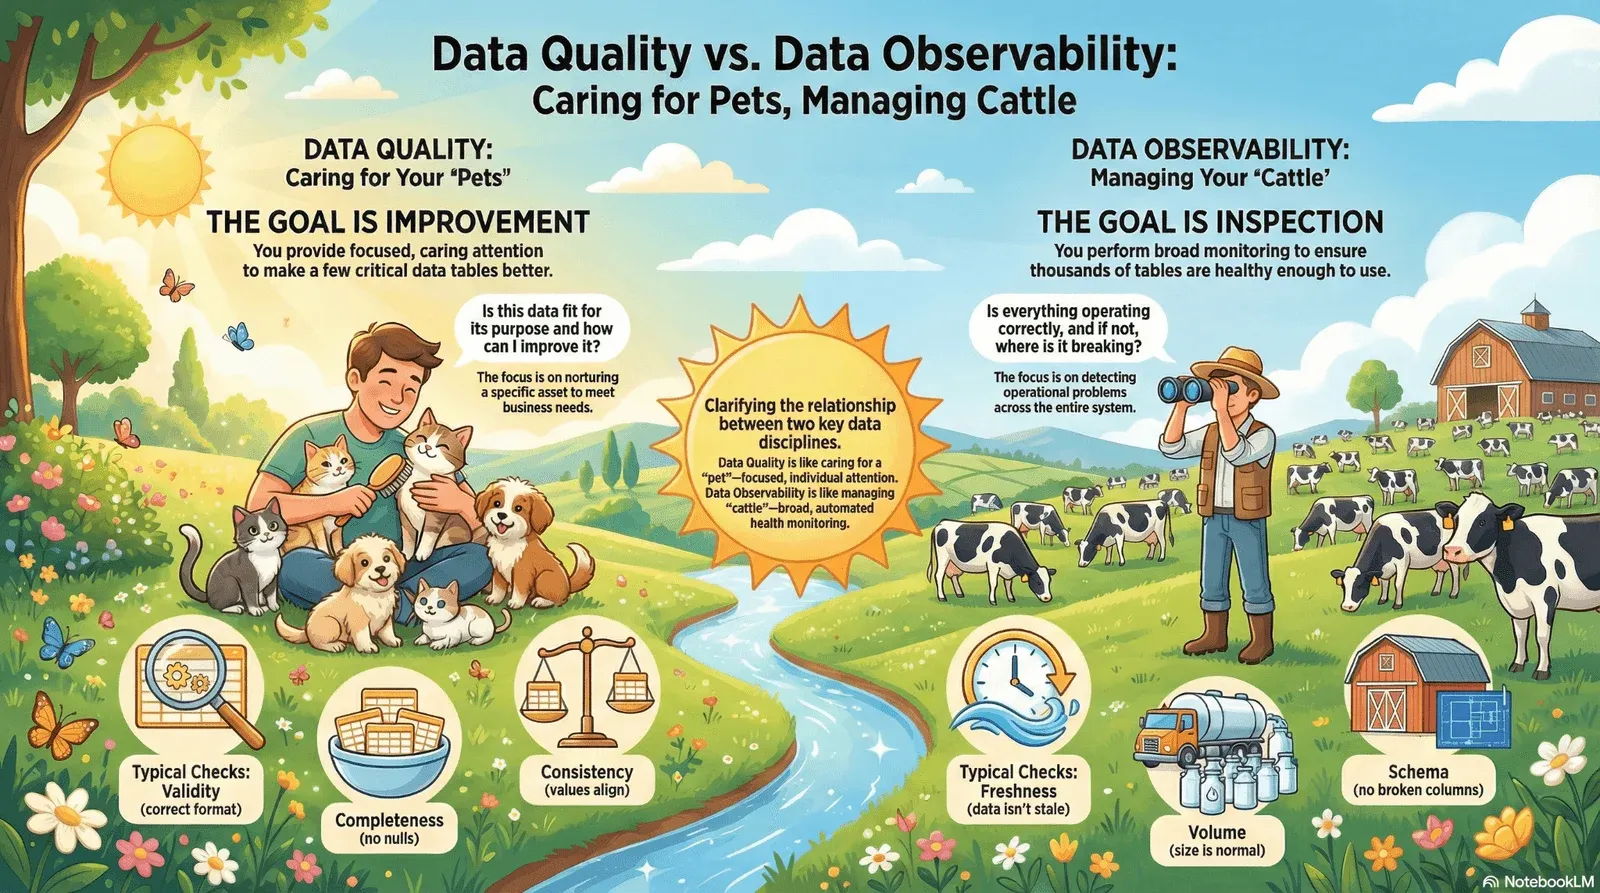
As Bias put it: “In the old way of doing things, we treat our servers like pets, for example, Bob the mail server. If Bob goes down, it’s all hands on deck. In the new way, servers are numbered, like cattle in a herd. When one server goes down, it’s taken out back, shot, and replaced on the line.”
This framework provides a useful lens for understanding two distinct but complementary disciplines that data engineering leaders must master: data quality and data observability. Both aim to increase trust in your data. Both require data quality checks. But they operate at different scales, serve different purposes, and demand different tooling.
Data Quality Is Caring for Your Precious Pets
Your pet tables are the ones you know and love—those lovingly hand-modeled star schemas, business-critical fact tables, and gold-layer marts. You know their names, their purpose, their refresh schedules, and their quirks. Like a cherished family pet, each one gets individual attention. You care about their well-being. You want them to thrive.
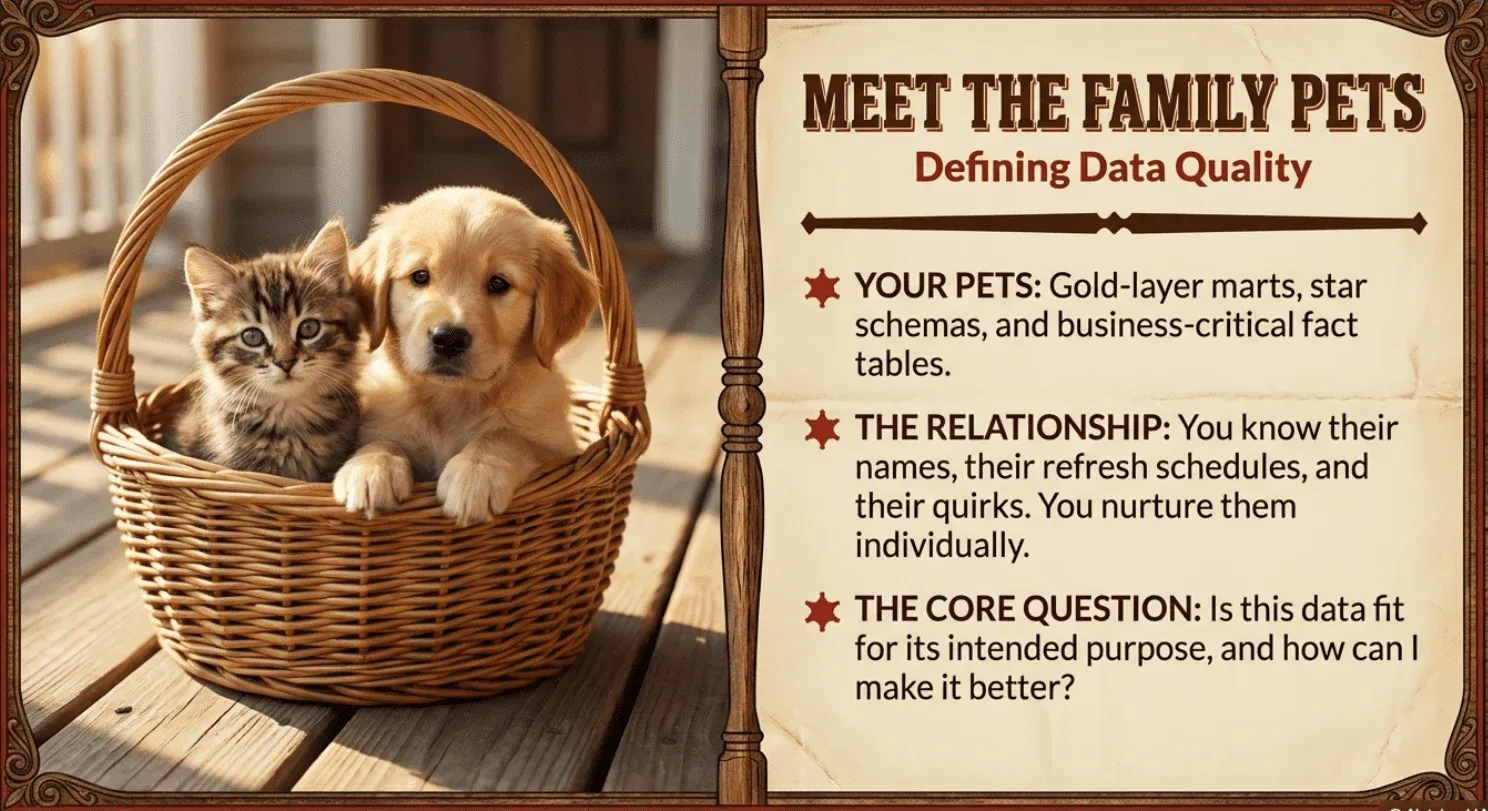
Data quality is the pet approach: focused, caring attention on a limited set of tables at a time, with the explicit goal of making them better.
Data quality asks: Is this data fit for its intended purpose, and how can I improve it?
You Care for Pets Because You Want Them to Improve
When you have a precious pet, you don’t just check that it’s alive—you invest in its health and development. You track how it’s doing over time. You notice when something’s off and take action. You want it to flourish.
Data quality work is the same. You’re not just monitoring—you’re actively improving the data to ensure it meets the needs of downstream consumers. This requires dashboards that drive action, not vanity metrics that look impressive but change nothing.
As we explore in our Masterclass on the Six Types of Data Quality Dashboards, effective data quality programs need multiple dashboard types serving different audiences and purposes—from executive scorecards that drive accountability to operational views that help engineers prioritize remediation work. These dashboards track progress over time, connect quality issues to business outcomes, and motivate teams to improve data quality.
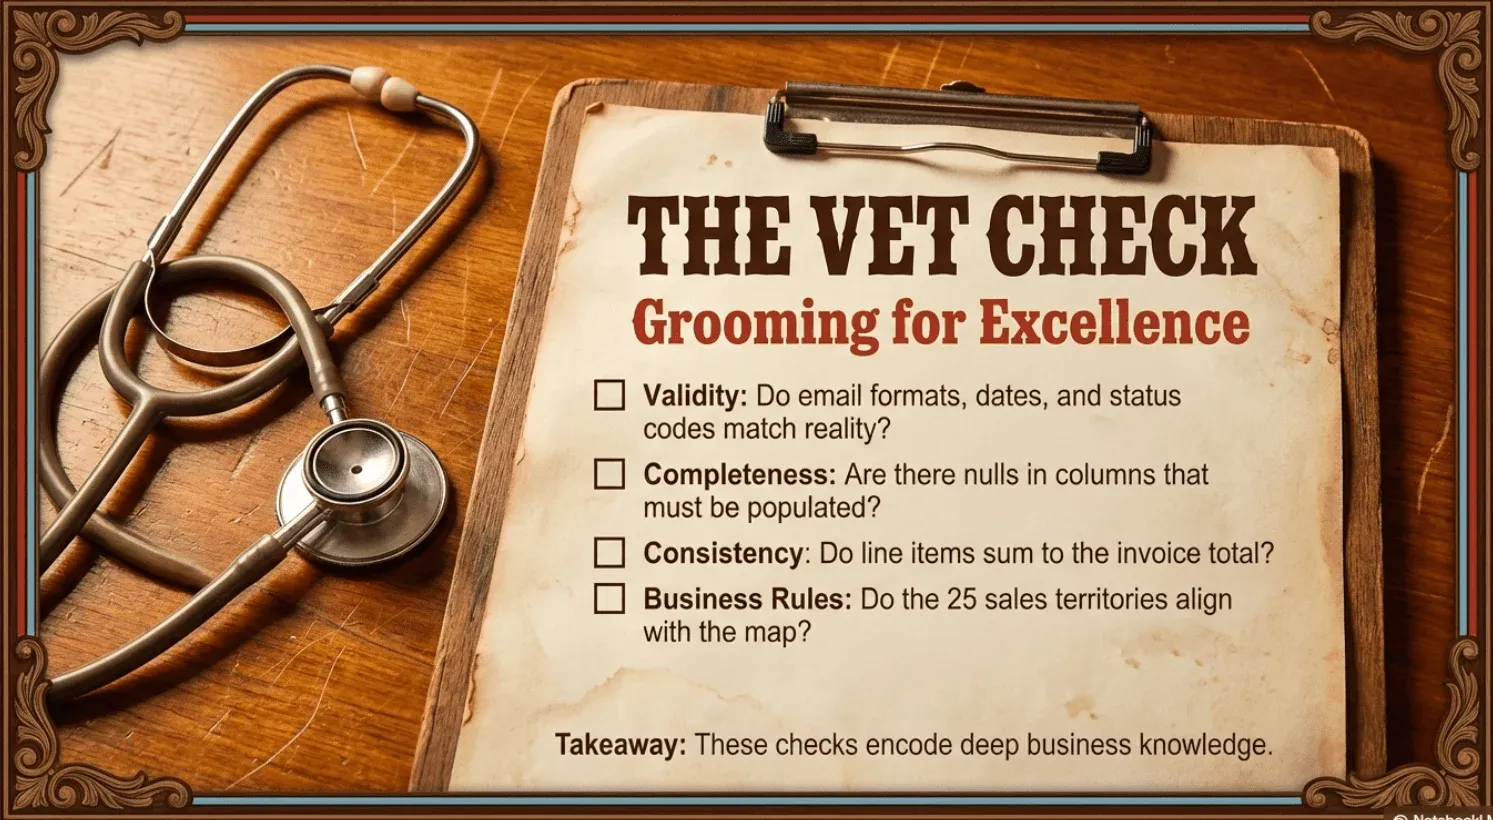
Caring for your pet tables means applying many data hygiene and quality checks:
- Validity checks: Does every value conform to expected formats, ranges, or patterns? Are email addresses properly formatted? Are dates within reasonable bounds? Are status codes drawn from a valid set?
- Completeness checks: Are required fields populated? Are there unexpected nulls in columns that should always have values?
- Consistency checks: Do related values align? Does the sum of line items equal the invoice total? Does every foreign key reference a valid primary key?
- Business rule validation: Does the data satisfy domain-specific requirements? Are there exactly 25 sales territories? Does every transaction have an assigned region?
- Uniqueness and referential integrity: Are identifiers actually unique? Do relationships between tables hold?
- … And Many More
The goal isn’t just detection—it’s improvement. You define what “correct” means, track quality scores over time on dashboards, identify gaps, and drive remediation. You’re making your precious pets healthier and stronger.
Data Observability Is Managing Your Cattle
Your cattle is a database—or data warehouse, or lakehouse—with thousands of tables. You don’t know them all individually. You can’t. No one has time to understand the purpose and semantics of every table in a modern data estate. Many are automatically generated, machine-produced, or simply not owned by any specific person.
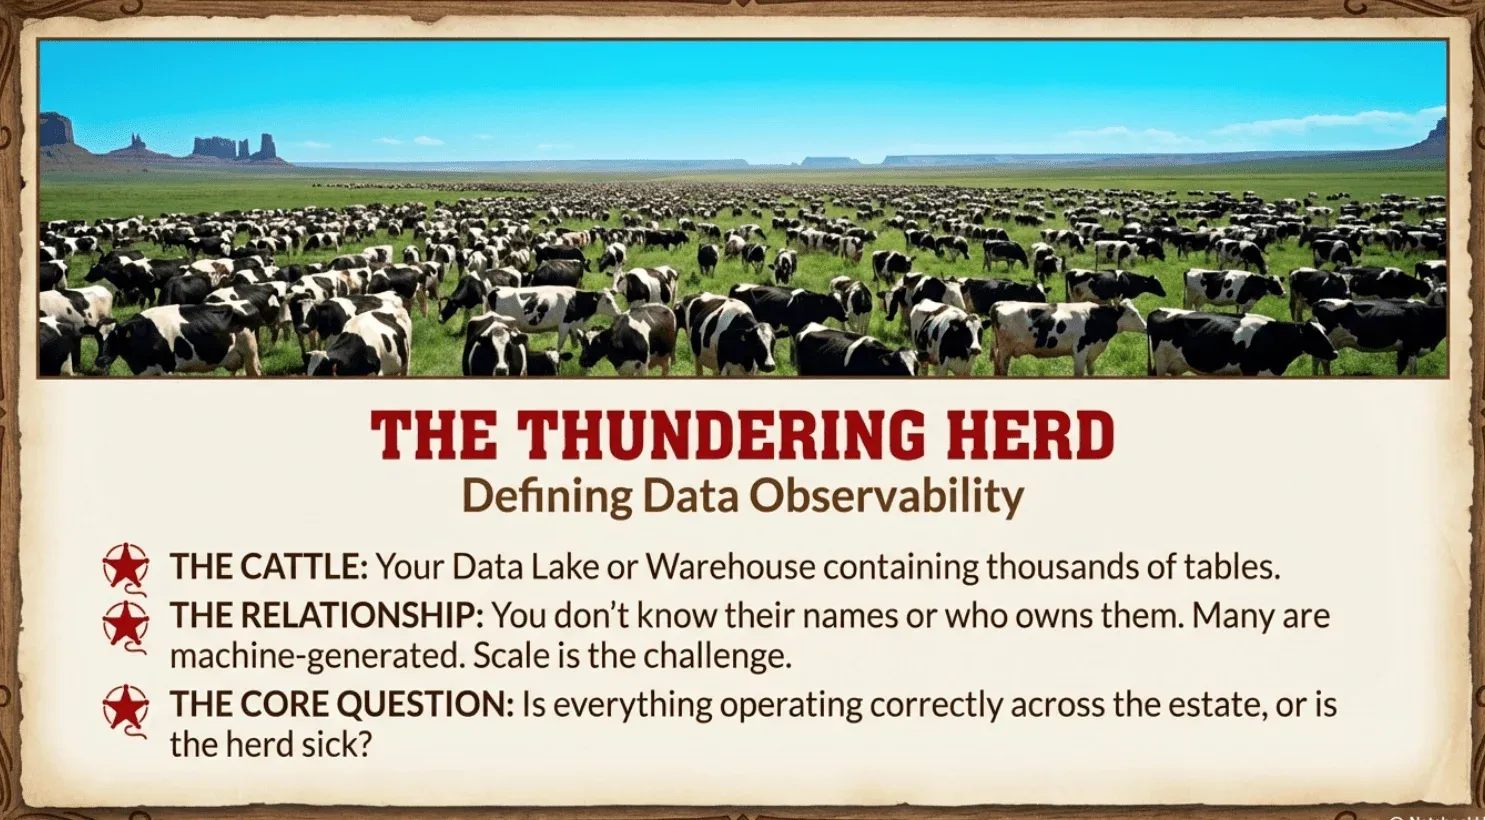
You’re not trying to improve each one. You just need to know: are they healthy enough to go to market?
Data observability is the cattle approach: broad monitoring across your entire herd, checking that each animal is big enough, has all its legs, and is ready to be useful.
Data observability asks: Is everything operating correctly across my data estate, and if not, where is it breaking?
You Check Cattle to Make Sure They’re Market-Ready
When you’re running cattle, you don’t write a unique care plan for each animal or track its personal development over time. You run them through a chute and check the basics: Are they the right size? Do they have all their legs? Any obvious problems? If they pass inspection, they go to market. If something’s wrong, you deal with it.
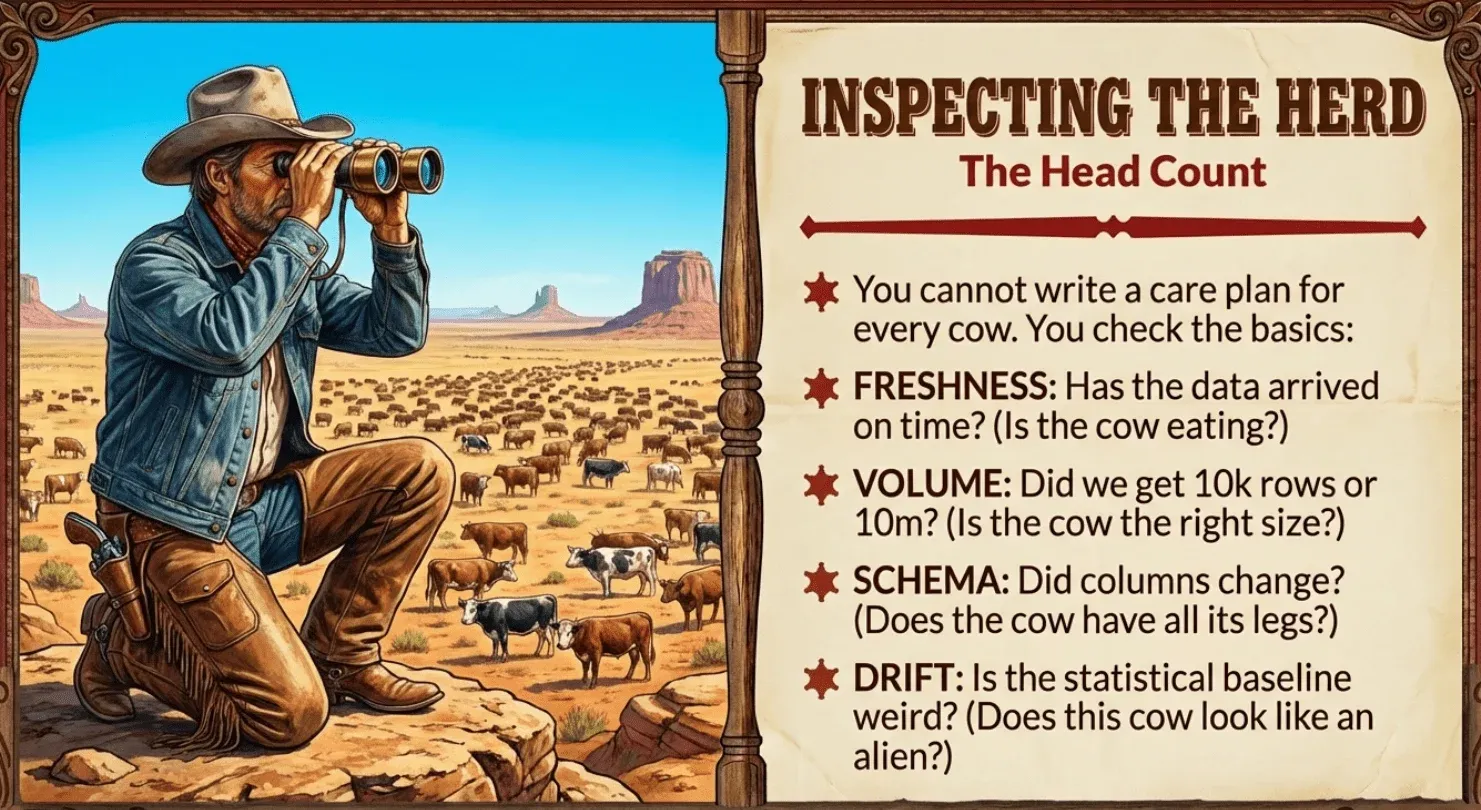
Data observability works the same way. You’re not trying to make each table excellent—you’re checking that it meets basic health standards
- Freshness : Is this table fresh enough? If a table that normally refreshes every hour hasn’t been touched in six hours, something may be wrong upstream. It’s like a cow that hasn’t been eating. You need to investigate.
- Volume : Is the table the right size? A table that normally receives 100,000 rows per day suddenly receiving 10,000—or 10 million—signals a potential issue. Too small or too big, something’s off.
- Schema : Does it have all its parts? Missing columns, type changes, and renamed fields—these are like missing legs or tails. The table might still exist, but it won’t work properly downstream.
- Drift from baseline: Is it within normal bounds? You profile data characteristics—null rates, cardinality, value distributions—and check that current patterns haven’t drifted too far from what’s expected. If a cow suddenly looks completely different from the rest of the herd, you notice.
This is cattle-scale inspection: time series anomaly detection and alerts that tell you when something in the herd isn’t right. You’re not trying to make each table perfect—you’re making sure none of them are broken enough to cause problems when they reach their destination.
Both Disciplines Require Data Quality Tests
Here’s the important nuance: both data observability and data quality rely on data quality checks. The difference is how those checks are generated, applied, and acted upon.
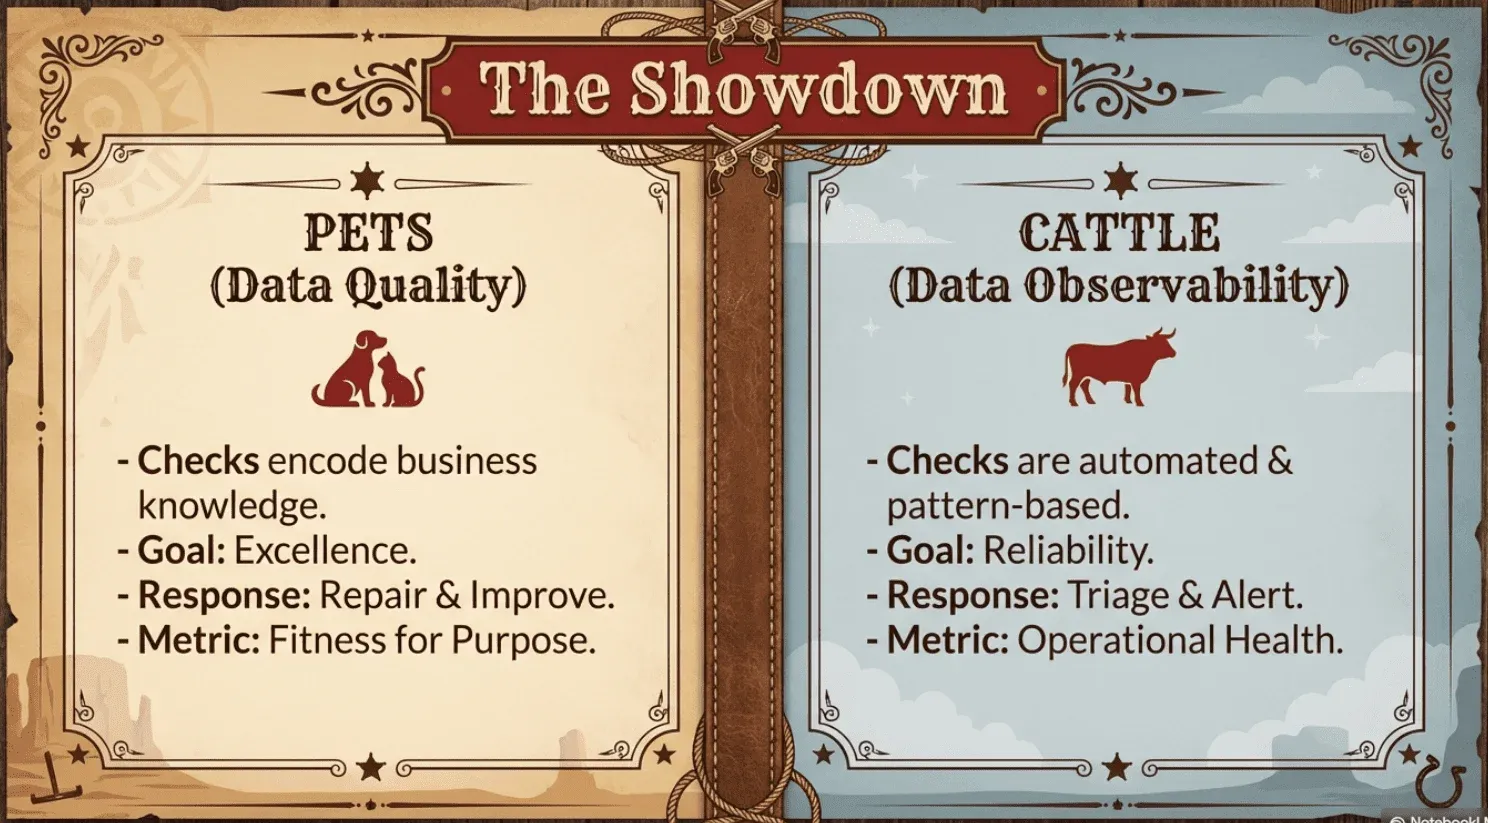
In data quality, checks encode business knowledge and specific requirements. You write checks because you understand what “correct” means for this particular table and use case. You care about this pet and want it to improve. When a check fails, it’s tracked on a dashboard, scored, and prioritized for remediation.
In data observability, checks are largely automated and pattern-based. You profile data to establish baselines, then generate checks that detect deviation from those baselines. You don’t need to understand what each table is for—you just need to know if it’s healthy enough to pass through. When a check fails, you get an alert to investigate.
The checks may look similar—both might verify that null rates stay below a threshold—but the context differs. Quality checks ask, “Does this meet our standard for excellence?” Observability checks ask, “Is this healthy enough to go to market?”
The Operational Models Differ
The distinction between pets and cattle shapes how you respond to issues.
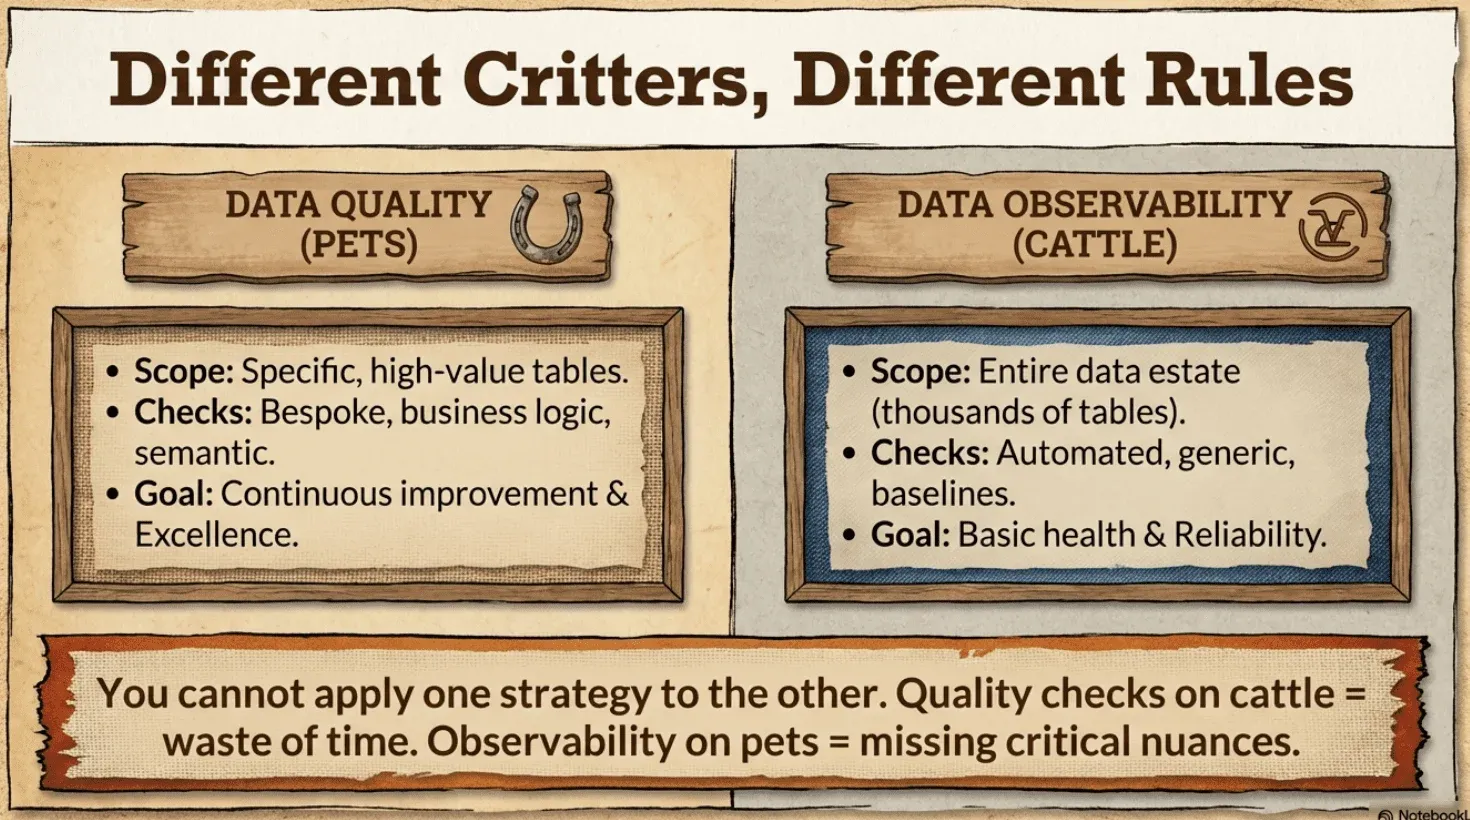
Quality failures require care and improvement. Someone understands that table’s purpose. Someone knows the business impact. The failure isn’t just “something changed”—it’s “our precious data asset isn’t meeting its potential.” The response is root cause analysis, remediation, and tracking improvement over time on your dashboards. You’re nursing your pet back to health.
Observability alerts require triage. You may not know why the table exists or who depends on it. Your job is to confirm something actually looks wrong, assess whether it’s serious, and either fix it quickly or route it to whoever owns that part of the pipeline. You’re not trying to make this table excellent—you’re just making sure it’s not broken. Pull it out of the herd, deal with the problem, move on.
Building a Unified Strategy
These disciplines complement each other naturally:
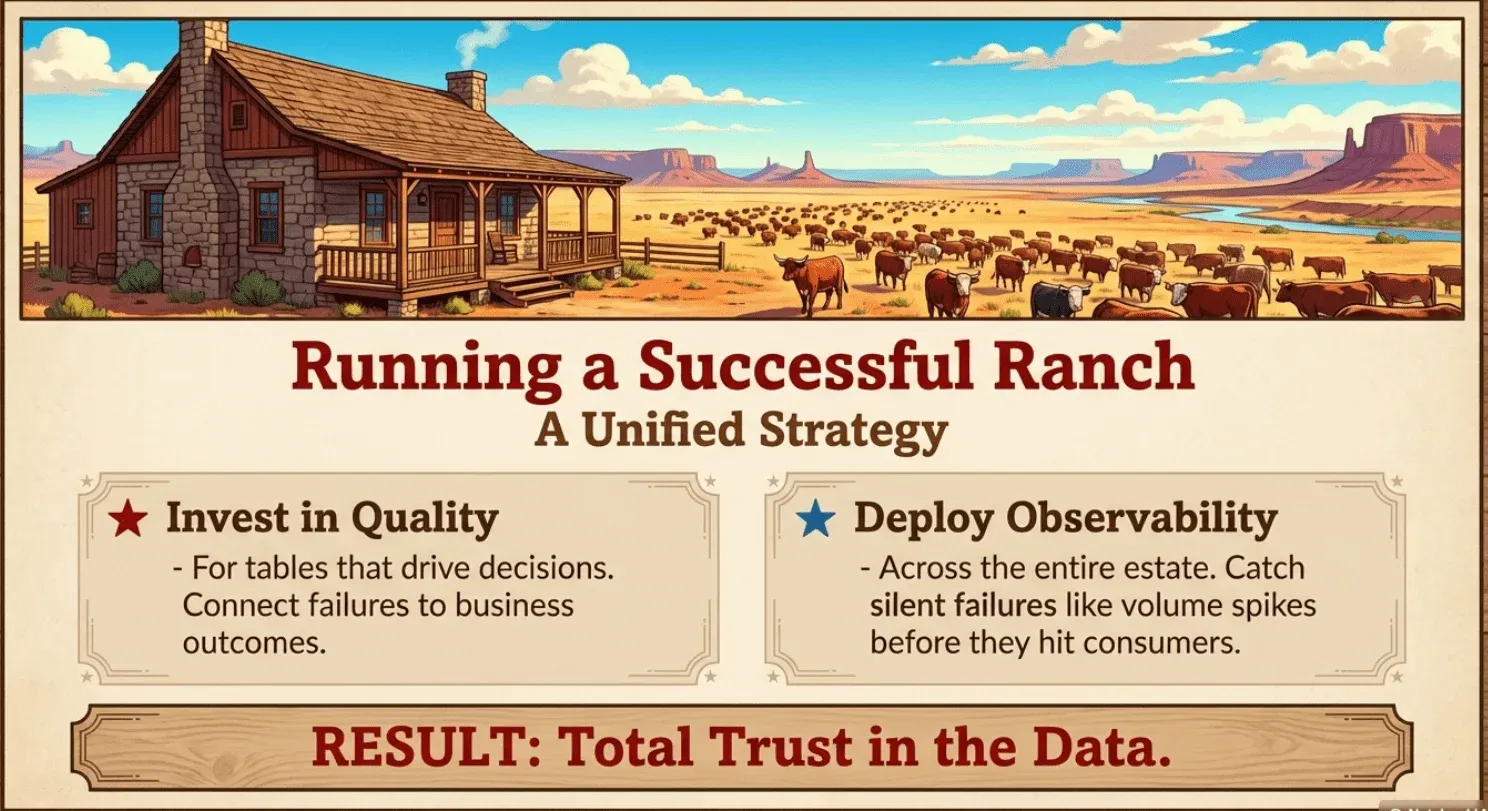
Invest in data quality for your precious pets. Identify the tables that matter most—the ones driving decisions, the ones with clear consumers, the ones you want to make excellent. For these, define what “correct” means, implement comprehensive hygiene and quality checks, and track improvement on dashboards that drive action.
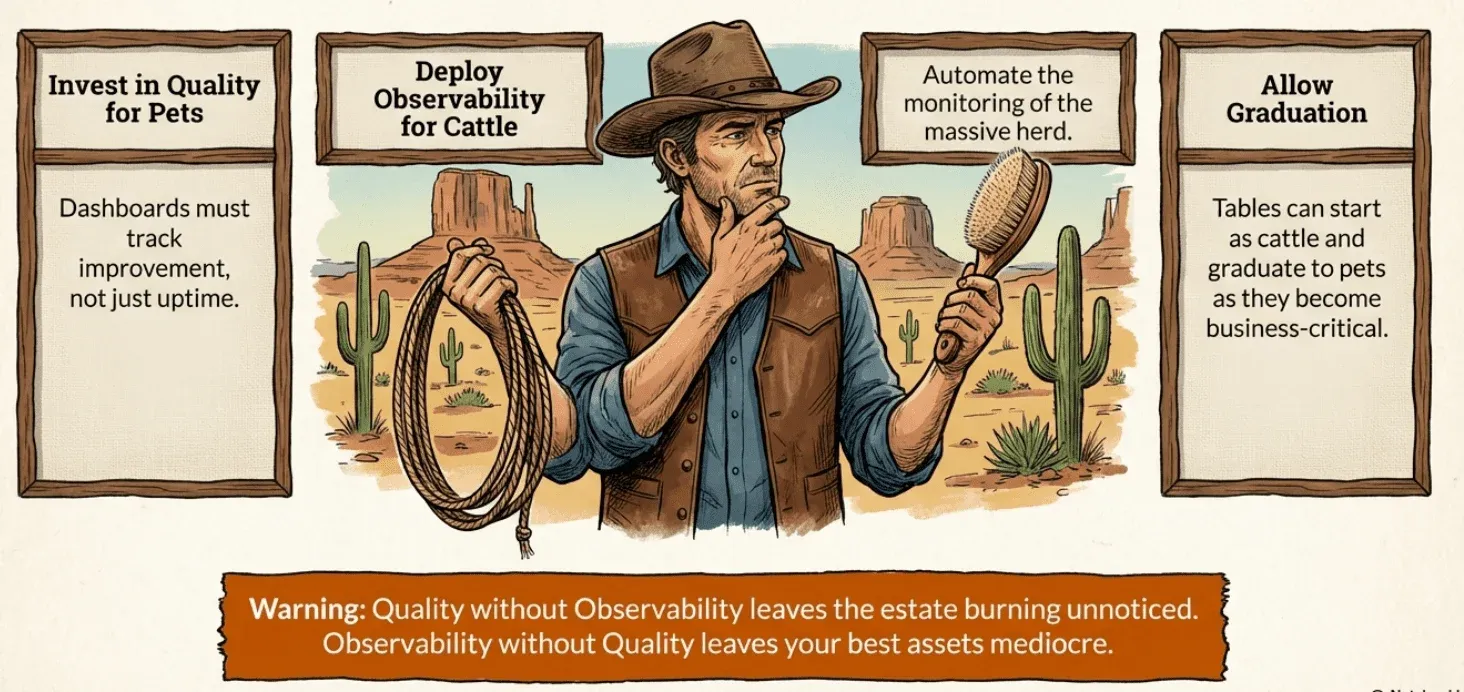
Deploy observability across your cattle. Use automated profiling to monitor all your tables—freshness, volume, schema, and statistical drift. This is your herd inspection. When something fails the basic health check, alerts fire, and you investigate.
Let tables graduate from cattle to pets. Many tables start as cattle—monitored generically through observability because you don’t know their purpose. As you learn more about a table’s importance, you can promote it by adding specific quality checks, tracking scores on dashboards, assigning ownership, and taking steps to improve it.
Recognize that most tables stay cattle. And that’s fine. Not every table deserves the attention you give your pets. Generic observability coverage—checking that they’re fresh enough, the right size, and structurally sound—is sufficient for tables that just need to be healthy enough to serve their purpose.
What This Means for Data Engineering Leaders
Understanding the distinction between data quality and data observability helps you allocate resources appropriately:
For your pets: Invest in dashboards that track improvement over time. Define quality standards and measure against them. Build remediation workflows. Make sure quality failures connect to business outcomes so stakeholders care about improving the data. These are your precious assets—treat them accordingly.
For your cattle: Invest in time series anomaly detection and alerting infrastructure. Automate baseline profiling. Build efficient triage workflows. Don’t try to write bespoke checks for thousands of tables—just make sure they’re healthy enough to pass inspection.
For your organization: Recognize that both disciplines are necessary. Quality without observability means your pet tables are excellent while unknown problems fester across your broader estate. Observability without quality means you catch broken tables but never truly make your critical data assets great.
The Cattle Drive Forward
The distinction between pets and cattle has helped a generation of infrastructure engineers understand modern operations. The same mental model clarifies the relationship between data quality and data observability.
Data quality is caring for your precious pets—focused improvement on specific tables you know and love, tracked through dashboards that drive action and accountability. You want these tables to be excellent.
Data observability is managing your cattle—checking thousands of tables you don’t know individually to make sure they’re fresh enough, the right size, and have all their parts. You just need them healthy enough to go to market.
Both require data quality checks with complete test coverage. Both contribute to trust. The difference is between nurturing something precious and inspecting a herd.
Master both disciplines, and your data estate—the pets you cherish and the cattle you manage—will deliver the trust your organization needs.
DataKitchen pioneered the DataOps methodology. TestGen is our open-source data quality testing and observability tool that handles both pet-scale data quality and cattle-scale observability. Use It Now or talk to us about reasonably priced enterprise deployments.
FAQ
What are the key points in this blog?
The DevOps pets-and-cattle analogy explains the split between data quality and data observability. Pets are the few critical tables you know by name and care for individually with specific business rules. Cattle are the thousands of tables you monitor as a herd for freshness, volume, and schema change. Both are necessary and neither substitutes for the other.
What is the difference between data quality and data observability?
Data quality testing checks the content of data against rules you defined: value ranges, formats, referential integrity, business logic. Data observability watches table-level behavior over time: whether it arrived, whether row counts moved unexpectedly, whether the schema shifted. Quality answers whether the numbers are right; observability answers whether the pipeline behaved.
What does pets and cattle mean for data?
Pets are tables you know individually. They carry your critical business logic, they get hand-written rules, and you notice immediately when one is unwell. Cattle are the rest of the estate, too numerous for individual attention, monitored at herd scale by automated detection. Treating cattle like pets does not scale; treating pets like cattle misses the rules that matter most.
Do you need both data quality testing and data observability?
Yes, because they fail to catch different things. A table can pass every observability check by arriving on time at the expected row count while containing wrong values. A table can pass every content rule while silently not having loaded since Tuesday. Running only one leaves an entire class of failure invisible.
What are the four uses of data quality test coverage?
Test coverage supports four activities every data team performs: the data quality process for persuading sources to improve, data observability for monitoring the estate at scale, data production for stopping bad data before it reaches consumers, and deployment testing for catching regressions before a change ships. The same test does a different job in each.
Which should you implement first?
Start with observability across the whole estate, because it is generated automatically and immediately tells you which tables are actually moving and which are already broken. Then add hand-written quality rules to the pets that observability identifies as important. Doing it in that order means your rule-writing effort is aimed by evidence rather than by guesswork.