NOTE
First published on Medium in October 2018 and republished here in August 2026.
Freedom and employee empowerment are essential to innovation, but a lack of top-down control leads to chaos. Self-service tools enable data analysts to create new analytics very quickly, and they can drift in different directions.
Imagine a team of analysts building reports that tally sales figures and each arriving at a different result. One approach includes drop shipments and sales from distributors and subsidiaries. Another consists of product sales but not services. These different approaches each have their use case, but from a manager’s perspective inconsistency creates the appearance of inaccuracy. You can’t establish a shared reality when everyone has different numbers.
Some managers respond by centralizing analytics. With data and analytics under the control of one group, such as IT, you can standardize metrics, control data quality, enforce security and governance, and eliminate islands of data. All worthy endeavors. However, forcing analytic updates through a heavyweight IT development process is a sure way to stifle innovation. It is one of the reasons some companies take three months to deploy ten lines of SQL into production. Analytics have to evolve and iterate quickly to keep up with user demands and fast-paced markets. Managers instinctively understand that data analytics teams must be free to innovate, which is what the self-service tools market addresses.
Centralizing analytics brings it under control, but granting analysts free rein is necessary to stay competitive. How do you balance the two? How do you empower your analysts to be innovative without drowning in the chaos and inconsistency that a lack of centralized control inevitably produces? Visit any modern enterprise and you will find this challenge playing out repeatedly in budget discussions and hiring decisions. It is a struggle between centralization and freedom.
The analytics supply chain
DataOps processes and tools offer a way to harmonize these opposing forces, empowering data analysts while exerting a measured amount of centralization and control on your end-to-end process. To explore that, we need to review the structure of the analytics supply chain and how the various roles relate to each other.
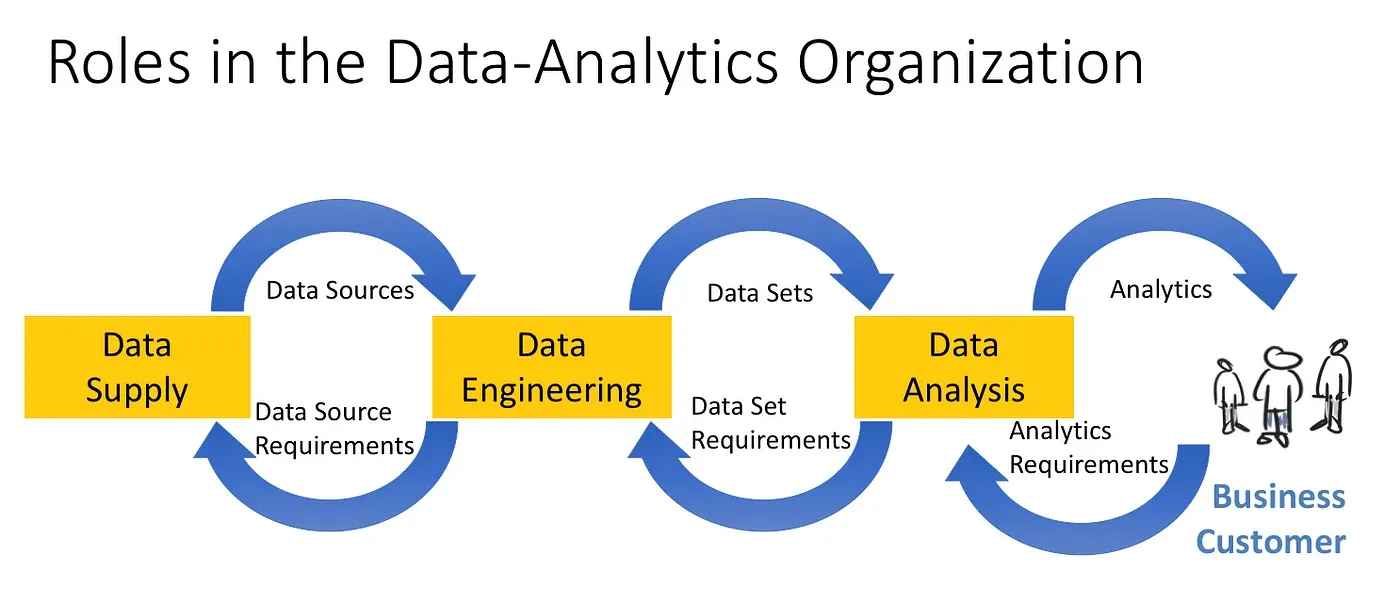
Data supply, data engineering, and data analysis work as a supply chain that fulfils the analytics requirements of business users.
The analytics organization in a DataOps enterprise consists of three essential job functions: data analysts, data engineers, and data suppliers. Think of the three roles as groups forming a supply chain. Data suppliers extract data for data engineers, who create targeted data sets. Data analysts consume those data sets and generate analytics for business use cases. The three functions work in an interlinked fashion, with data and analytics flowing toward the business user and feedback and requirements flowing back the other way. Each group focuses on its immediate customer, its right-hand neighbor, but together they share the mission of delivering analytic insight to business users. While they share that mission, the three groups operate in different business contexts.
Data analysts
Data analysts directly support business users who work in fast-paced markets that continuously evolve. A successful analyst finds ways to respond quickly to user requests. If new analytics are needed, the analyst pulls that together. New charts and graphs, updates, changes to calculated fields, integrations of new data sets: top-performing analysts do whatever it takes to address user requirements.
Analysts choose tools and processes oriented toward this business context. They use powerful, self-service tools such as Tableau, Alteryx, and Excel to quickly create or iterate on charts, graphs, and dashboards. They organize their work into daily sprints, so they can deliver value regularly and receive feedback from users immediately.
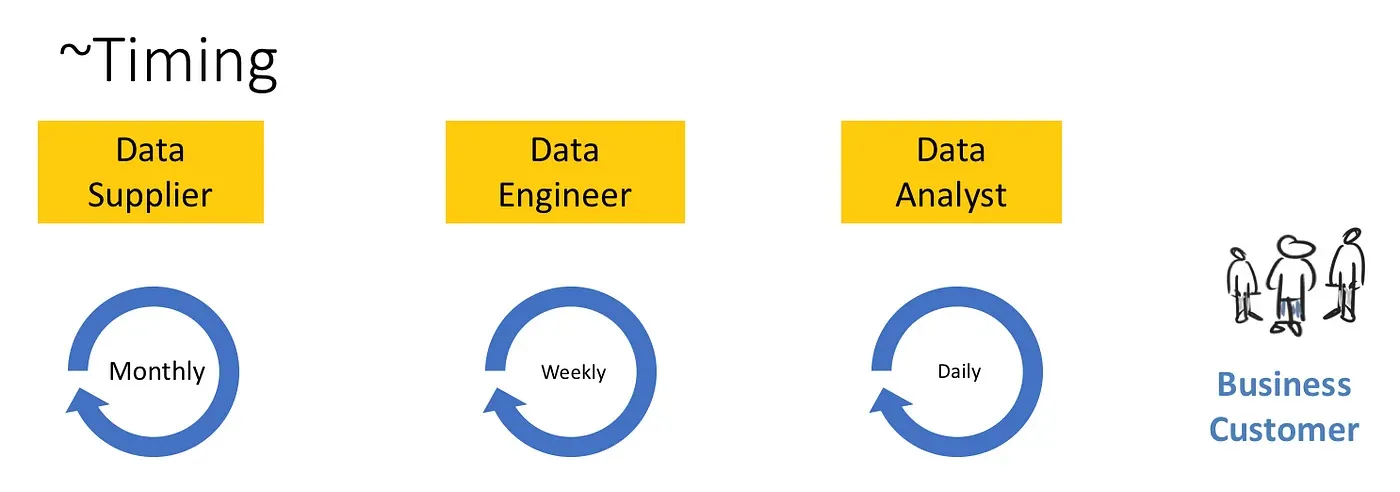
Suppliers, engineers, and analysts run different cycle times, driven mainly by their tools, methods, and proximity to demanding users. Agile tools like Jira are an excellent way to manage the productivity of analyst daily sprints.
The data analyst is the tip of the innovation spear. Organizations must give data analysts maximum freedom to experiment. There is a lot more data in the world than companies can analyze. Not everything can be placed in data warehouses. Not all data should be operationalized. Companies need data analysts to play around with different data sets to establish what is predictive and relevant.
When freedom is not free
As their body of analytics grows, data analysts can get bogged down in non-value-add tasks. Self-service tools do not include mechanisms that promote and enable reuse. The data analyst may end up copying a calculated field into many reports and then having to manage changes to that algorithm manually. It becomes a revision control nightmare. New data sets are often integrated using labor-intensive and error-prone manual steps. This becomes a heavy burden, consuming the majority of an analyst’s time. Help and support from data engineering addresses these challenges for the team.
Some companies mistakenly ask data engineering to create data sets for every idea. It is better to let analysts lead on implementing new analytic ideas and proving them out before considering how data engineering can help. Ask:
- Have the new analytics proven to be useful to many users?
- Have calculations been reused in many reports, charts, or dashboards?
- Can automation reduce duplication of effort or manual integration errors?
- Does data quality need improvement?
By that standard, the organization focuses its data engineering resources where they return the most. Keep in mind that when analytics move into a data warehouse, some of the benefits of centralization come at the expense of reduced freedom: it is slower to update a data warehouse than a Tableau worksheet. It is important to wait until analytics have earned the right to make this transition. The value created by centralizing must outweigh the restriction of freedom.
Data engineers
Data engineers choose tools and processes that facilitate their objective, which is to produce quality-checked data sets such as data lakes, warehouses, and marts for data analysts. These data sets include field calculations analysts can build on, which promotes reuse. Data engineers can also automate data integration and other processes, minimizing manual steps for the analyst. With the added centralization offered by data engineering, analysts shed non-value-add tasks and keep innovating rapidly.
Data engineers use programmable platforms such as AWS, S3, EC2, and Redshift. These tools require programming in a high-level language and offer greater potential functionality than the tools analysts use. The relative complexity of the tools and the scope of engineering projects fit best in weekly Agile iterations. DataKitchen DataOps Automation streamlines the quality control, orchestration, and data operations parts of the job, so the engineer can stay focused on creating and improving data sets for analysts.
After data sets have proven their value, it is worth considering whether the benefits of further centralization outweigh the cost of a further reduction in freedom. Data suppliers fulfill that greater centralization by providing data sources or extracts for data engineering.
There are several reasons a project may have earned the right to transition to data suppliers. Analytics may provide functionality executives want available to the entire corporation rather than one business unit. It could be standardization, such as the company wanting one algorithm for calculating market share. Or data engineering may have implemented quality control on a data set and want the efficiency of pushing that upstream to the supplier. A data supplier may be an external third party or an internal group, such as an IT master data management team.
Master data management
In master data management, an enterprise links all of its critical data to a common reference. In the pharmaceutical industry there are 20 to 30 public data sets describing physicians, payers, and products. The initial merging and mastery of those data sets may, and in some cases should, be performed by the data engineering team, for the purpose of business analytics.
After the usefulness of the mastered data is established, the company might decide the data has broader uses. They may want the customer or partner list available for a portal or tied into a billing system. That use case requires a higher standard of accuracy than the analytic data warehouse did. It is appropriate at that point to consider moving master data management to a data supplier, such as a corporate IT team adept at larger development initiatives. Initial data mastery may have been good enough for analytic insight, but data must be perfect when it is being used in a billing system.
Their preferences differ across the board:
| Data supply | Data engineering | Data analysis | |
|---|---|---|---|
| Iteration cycle time | Monthly | Weekly | Daily |
| Deliverables | Data extracts | Organized, quality-checked data sets | Insights via charts, graphs, dashboards |
| Customer | Data engineers | Data analysts | Business users |
| Technical tools | RDBMS, MDM, Salesforce | AWS, DataKitchen, Git | Self-service tools |
| Process management | MS Office and others | Jira | Jira |
Data suppliers
Projects transitioned to data suppliers tend to incorporate more process and tool complexity than those in data engineering, which leads to a longer iteration period of one or more months. These projects use tools such as relational databases, master data management, Salesforce, Excel, and sFTP, and they rely on waterfall project management.
The centralization-freedom spectrum
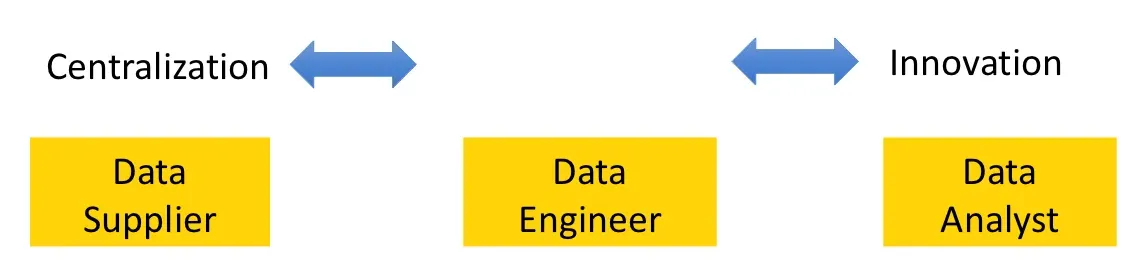
Data suppliers, data engineers, and data analysts sit on a spectrum of centralization and freedom.
Data analysts, data engineers, and data suppliers sit on a centralization-innovation spectrum, with suppliers offering the most centralization, analysts producing the fastest innovation, and engineering serving as the transition space in the middle. The characteristic strengths and weaknesses of each group are strongly influenced by their daily, weekly, and monthly iteration periods.
Organized this way, the company has access to the full spectrum of development: fast innovation, medium-scope development, and longer-term complex projects. For every need, the project has a home. Granting analysts as much freedom as possible keeps the innovation engine turning. Waiting for analytics to stabilize and earn the right to be transitioned means centralization adds value where it should, without infringing on freedom and creativity.
What DataOps contributes
The supply chain model shows how DataOps processes and tools help enterprises empower data analysts while exerting a measured amount of centralization and control on the end-to-end data pipeline. What makes it work is automated orchestration, continuous deployment, and testing and monitoring of the data pipeline. DataOps reduces manual effort, enforces data quality, and streamlines orchestration.
Tests verify that the quantity of data matches business logic at each stage of the pipeline. If a problem occurs at any point, the analytics team is alerted and can resolve it before it develops into an emergency. With 24x7 monitoring, the team can focus on customer requirements for new and updated analytics instead of watching the pipeline.
One engineer, ten analysts, a hundred users
The goal of DataOps is to minimize overhead and free data engineers and analysts to focus on delivering analytics to customers. With automation, a single data engineer supports ten data analysts, who in turn support 100 business professionals. Data suppliers, engineers, and analysts then concentrate their energy on their primary objective, which is making their customers effective.
FAQ
What are the key points in this blog?
Freedom produces inconsistent numbers and centralization produces three-month SQL changes, so neither extreme works. The resolution is an analytics supply chain of suppliers, engineers, and analysts, each with its own cycle time. Work moves upstream toward more centralization only after it has earned the right, meaning the value of standardizing outweighs the freedom lost.
Why does centralizing analytics slow a company down?
Because it forces every analytic update through a heavyweight development process. Standardized metrics, controlled quality, and enforced governance are worth having, but the same process is why some companies take three months to deploy ten lines of SQL. Analytics has to iterate as fast as the market it describes.
What is the analytics supply chain?
Three roles working as a chain. Data suppliers extract data for data engineers, who build targeted data sets, which data analysts consume to produce analytics for business users. Data and analytics flow toward the user while requirements and feedback flow back, and each group serves its immediate neighbor.
Why do the three roles have different cycle times?
Because their tools and their distance from the user differ. Analysts use self-service tools and work in daily sprints. Engineers program platforms like AWS, S3, EC2 and Redshift, which fits weekly iterations. Suppliers handle master data management and integration projects that run a month or more.
When should analytics move from an analyst to data engineering?
When the work has proven itself. Ask whether the analytics are useful to many users, whether calculations have been reused across reports, whether automation would remove duplicated effort or manual integration errors, and whether data quality needs improving. Moving too early spends engineering effort on ideas that have not earned it.
What does freedom cost an analyst who has no engineering support?
Time. Self-service tools include no mechanism for reuse, so a calculated field gets copied into many reports and every change to it becomes manual revision control. New data sets get integrated by hand, which is slow and error-prone. That overhead can consume the majority of an analyst’s week.