NOTE
First published on Medium in September 2018 and republished here in August 2026.
Some companies take six months to write 20 lines of SQL and move it into production.
The last thing an analytics professional wants to do is introduce a change that breaks the system. Nobody wants to be the object of scorn, the butt of jokes, or a cautionary tale. If that 20-line SQL change is misapplied, it can be a career-limiting move.
Analytics systems grow so large and complex that no single person in the company understands them end to end. A large company often institutes slow, bureaucratic procedures for introducing new analytics in order to reduce fear and uncertainty. They create a waterfall process with specific milestones. There is a lot of documentation, checks and balances, and meetings. Lots of meetings.
Impact analysis
One of the bottlenecks in an analytics release process is called impact analysis. It gathers experts on all of the various subsystems (data feeds, databases, transforms, data lakes and warehouses, tools, reports) so they can review the proverbial 20 lines of SQL and try to anticipate whether and how it will adversely affect data operations.
Imagine you are building technical systems that integrate data and produce models and visualizations. How does a change in one area affect other areas? In a traditional established company, that information is locked in various people’s heads. The company may think it has no choice but to gather these experts together in one room to discuss and analyze proposed changes. This is the impact analysis meeting. The process includes the company’s most senior technical contributors, the backbone of data operations. Naturally, these individuals are extremely busy and subject to high-priority interruptions. Sometimes it takes weeks to gather them in one room. It can take additional weeks or months for them to approve a change.
The impact analysis team is a critical bottleneck that slows down updates to analytics. A DataOps approach to improving analytics cycle time adopts process optimization techniques from the manufacturing field. In a factory environment, a small number of bottlenecks often limit throughput. This is the Theory of Constraints. Optimize the throughput of bottlenecks and your end-to-end cycle time improves. Goldratt’s The Goal is the book on this.
Get the knowledge out of people’s heads
The impact analysis meeting is a bottleneck because it relies on your top technical experts, one of the most oversubscribed resources in the company. What if you could extract all the knowledge and experience trapped in the brains of your company’s experts and code it into a series of tests that would perform the impact analysis for you? That would give you a quick way to test out changes to analytics without bureaucratic procedures and meetings. If the tests pass, you deploy with confidence. No more waiting on the impact review team.
Automating impact analysis
Manual testing moves the bottleneck from impact review to the testing team. Manual testing is performed step by step, by a person. This tends to be expensive, because it requires someone to create an environment and run tests one at a time. It is also prone to human error.
DataOps automates testing. Environments are spun up under machine control and test scripts, written in advance, are executed in batch. Automated testing is much more cost-effective and reliable than manual testing, but the effectiveness of automated testing depends on the quality and breadth of the tests. In a DataOps organization, members of the analytics team spend 20 percent of their time writing tests. Whenever a problem is encountered, a new test is added. New tests accompany every analytics update. The breadth and depth of the test suite continuously grow.
One advantage of automated testing is that it is easier to run, so it gets executed repeatedly and regularly. Manual testing is often too expensive and slow to run on a regular basis. To ensure high quality, you have to be able to consistently and regularly test your data and code.
These concepts are new to many data teams, but they are well established in the software industry, where the cycle time of releases has been reduced by orders of magnitude through automation and process improvements: from 12 months to three weeks, and then from three weeks to three minutes. Automating impact analysis can have a similar effect on your organization’s analytics cycle time.
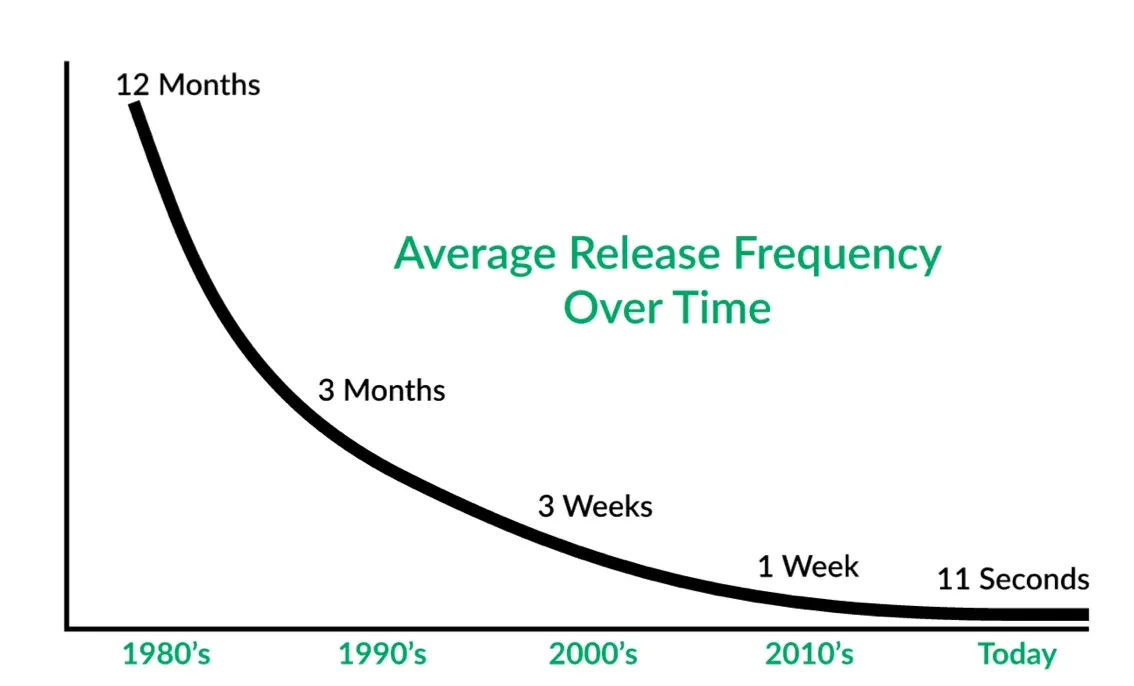
Software developers have reduced the cycle time for new releases by orders of magnitude using automation and process improvements.
Analytics is code
At this point some of you are thinking this has nothing to do with me. I am a data analyst or scientist, not a coder. I am a tool expert. What I do is just a sophisticated form of configuration. This is a common point of view in data analytics, and it leads to a mindset that slows down analytics cycle time.
Tools vendors have a business interest in perpetuating the myth that if you stay within the well-defined boundaries of their tool, you are protected from the complexity of software development. This is ill-considered. Don’t get us wrong, we love our tools. But don’t buy into that.
The analytics market divides into two segments: tools that create code and tools that run code. The point is that data analytics is code. The data professional creates code and must own, embrace and manage the complexity that comes along with it.
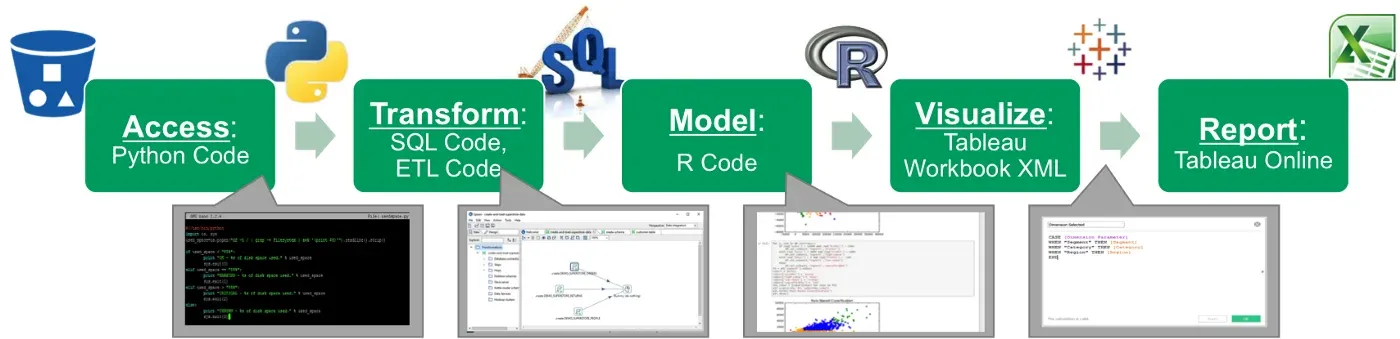
From data access to visualization to reports, there is code running at every stage of the data operations pipeline.
From data access to visualization to reports, there is code running at every stage of the data operations pipeline. Python, SQL, R are all code. The tools of the trade (Informatica, Tableau, Excel) are code too. Open an Informatica or Tableau file and it is XML. It contains conditional branches, loops, and you can embed Python or R in it. Informatica presents a UI that creates ETL in an XML format, which is then converted to Java and executed on the machine.
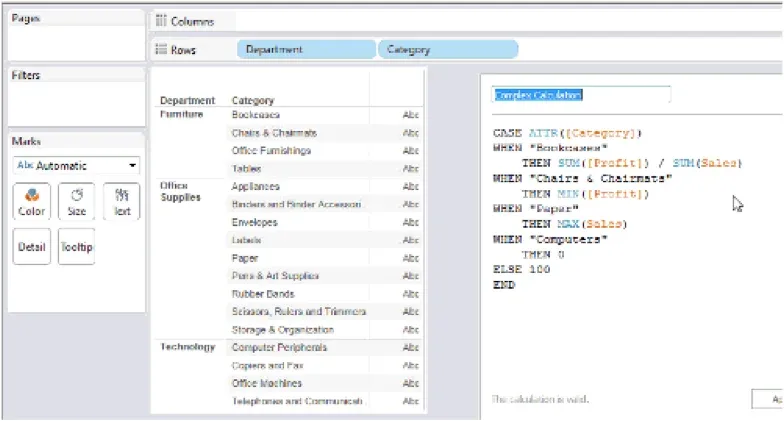
A Tableau calculated field is a conditional expression. The tool presents a form; what you are writing is code.
Remember our 20-line SQL change that took six months to implement? The problem is that analytics systems become so complex that they can easily break if someone makes one misbegotten change. The average data analytics pipeline encompasses many tools, which are code generators, and runs a lot of code. Between all of the code and people involved, data operations becomes a combinatorially complex hairball of systems that could come crashing down with one little mistake.
Imagine you have analytics that sort customers into five bins based on some conditional criterion. Deep inside your tool’s XML file is an if-then-else construct responsible for sorting the customers correctly. You have numerous reports based on a template that contains this logic. They provide information to your business stakeholders: top customers, middle customers, gainers, decliners, whales, profitable customers.
There is a team of IT engineers, database developers, data engineers, analysts and data scientists managing the end-to-end system that supports these analytics. One of them makes a change. They convert the sales volume field from an integer into a decimal. Perhaps they convert a field that was US dollars into a different currency. Maybe they rename a column. Everything in the analytics pipeline is so interdependent that the change breaks all of the reports containing the if-then-else logic on which the original five categories are built. All of a sudden your five customer categories become one category, or the wrong customers are sorted into the wrong bins. None of the dependent analytics are correct, reports are showing incorrect data, and the VP of sales is calling you hourly.
At an abstract level, every analytic insight produced, every deliverable, is an interconnected chain of code modules delivering value. The data analytics pipeline is best represented as a directed acyclic graph. Whether you use an analytics tool like Informatica or Tableau, an integrated development environment like Visual Studio, or even a text editor, you are creating code, and that code interacts with all of the other code in the graph that represents your pipeline.
To automate impact analysis, think of the end-to-end data pipeline holistically. Your test suite should verify software entities on a stand-alone basis as well as how they interact.
Types of tests
The software industry has decades of experience ensuring that code behaves as expected. Each type of test has a specific goal:
- Unit tests. Aimed at each software component as a stand-alone entity.
- Integration tests. Focused on the interaction between components, to confirm they interoperate correctly.
- Functional tests. Verification against a functional specification or user stories.
- Regression tests. Rerun on every change to prove the application still functions.
- Performance tests. Verify responsiveness, stability and availability under a given workload.
- Smoke tests. Quick, preliminary validation that the major system functions are operational.
Tests target data, code, or both
It is also helpful to frame the purpose and context of a test. Tests can target data or code. In the previous post we discussed tests that run as part of the data operations pipeline: location balance, historical balance, and statistical process control. Those tests are directed at the data flowing through an operations pipeline. The code that runs the processing steps is fixed, tightly controlled and only changed via a release process. Data moving through operations, on the other hand, is variable. New data flows through continuously. DataOps calls this the Value Pipeline.
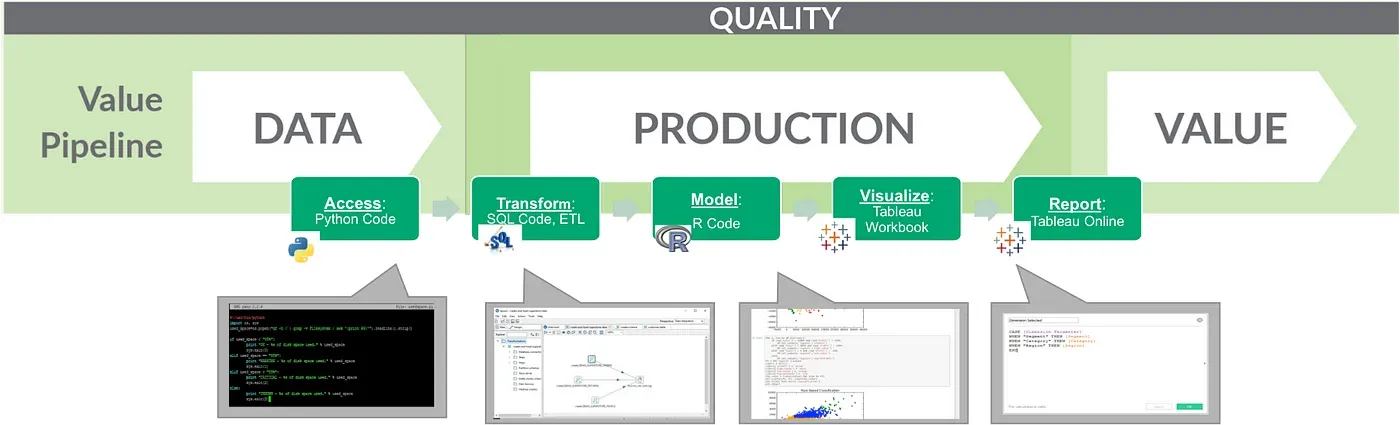
Data operations: the Value Pipeline.
The development of new analytics follows a different path, the Innovation Pipeline, which delivers new insights into the data operations pipeline, regulated by the release process. To safely develop new code, the analyst needs an isolated development environment analogous to the overall system. If the database is terabytes in size, the data professional might copy it for test purposes. If the data is petabytes in size, it may make sense to sample it, for example taking 10 percent. If there are concerns about privacy or other regulations, sensitive information is removed. Once the environment is set up, the data typically remains stable.
| Data fixed | Data variable | |
|---|---|---|
| Code fixed | Value Pipeline | |
| Code variable | Innovation Pipeline |
In the Innovation Pipeline, code is variable but data is fixed, so tests target the code. The unit, integration, functional, performance and regression tests mentioned above are aimed at vetting new code. All tests run before promoting new code to production, and code changes should be managed in a version control system such as Git. A good test suite serves as an automated form of impact analysis that can run on any and every code change before deployment.
Some tests are aimed at both data and code. A test that confirms a database has the right number of rows helps your data and code work together. Ultimately both data tests and code tests need to come together in an integrated pipeline, so that quality holds on both sides.
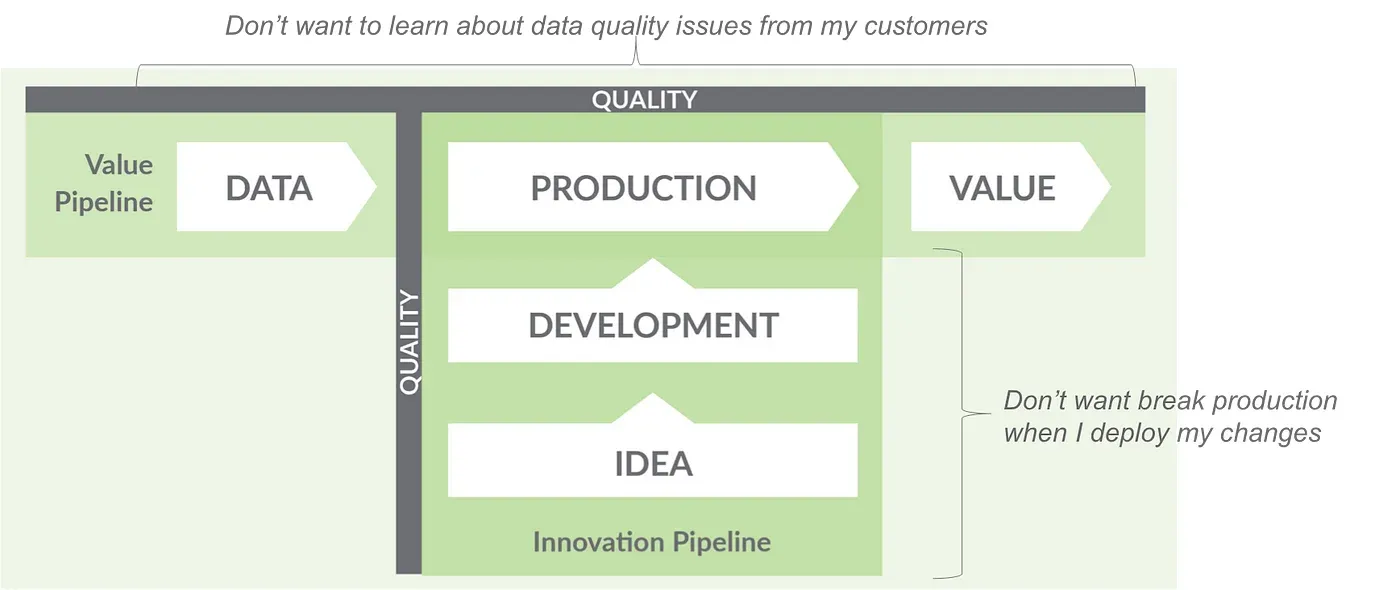
The two pipelines answer two different fears, and quality has to hold across both.
Conclusion
A unified, automated test suite that tests and monitors both production data and analytic code is the linchpin that makes DataOps work. Robust and thorough testing removes or minimizes the need to perform manual impact analysis, which avoids a bottleneck that slows innovation. Removing constraints speeds innovation and improves quality by minimizing analytics cycle time. With a highly optimized test process, you will be able to expedite new analytics into production with a high level of confidence.
20 new lines of SQL? You’ll have it right away.
FAQ
What are the key points in this blog?
An impact review board is a bottleneck that runs on your scarcest people, which is why a 20-line SQL change can take six months. Encoding what those experts know as automated tests turns impact analysis into something a machine runs on every change. Analytics is code, so it needs both data tests and code tests, and a DataOps team spends about 20 percent of its time writing them.
What is an impact analysis meeting?
It is a meeting that gathers experts on every subsystem, including data feeds, databases, transforms, warehouses, tools and reports, to review a proposed change and anticipate how it might break data operations. The knowledge it depends on lives in people’s heads, so the meeting is the only place it can be applied.
Why is the impact review board a bottleneck?
Because it relies on the company’s most senior technical contributors, who are already oversubscribed and subject to high-priority interruptions. Sometimes it takes weeks just to get them in one room, and weeks or months more to get approval. In Theory of Constraints terms, that meeting sets the throughput of the whole release process.
How does automated testing replace impact analysis?
A test suite encodes the knowledge the experts would have applied in the meeting, then applies it to every proposed change automatically. If the tests pass, the change deploys with confidence and nobody waits on a calendar. The effectiveness depends entirely on the breadth and quality of the tests, which is why every incident should add one.
Why is data analytics considered code?
Because the analytics market divides into tools that create code and tools that run code. Open an Informatica or Tableau file and it is XML containing conditional branches and loops, and it can embed Python or R. SQL, Python and R are obviously code. The data professional owns that complexity whether or not the work happens in an IDE.
What is the difference between the Value Pipeline and the Innovation Pipeline?
The Value Pipeline is data operations: the code is fixed and controlled by a release process while new data flows through continuously, so tests target the data. The Innovation Pipeline is the development of new analytics: the data is held stable while the code changes, so tests target the code. Quality requires both, working together.