Trends in DataOps: Bringing Scale and Rigor to Data and Analytics is a research report written by Wayne W. Eckerson and published by Eckerson Group in August 2019, based on a survey of 175 data and analytics professionals fielded that April. DataKitchen sponsored the research. This page is our summary of what the report asked, what it found, and which of its numbers we still quote seven years later.
NOTE
Eckerson Group wrote and owns this report, and their analysis is theirs. Nothing below is a reproduction of their text: it is our account of their findings, with each figure attributed to the survey it came from. Read the original on Eckerson Group’s site, or take the sponsored PDF we distribute with no form in the way.
What the report set out to measure
Eckerson Group had already published Best Practices in DataOps: How to Create Robust, Automated Data Pipelines in June 2019 (our write-up), profiling practitioners and drawing ten best practices out of what they did. Trends in DataOps is the sequel, and it does the opposite job: instead of describing teams that already run DataOps, it counts how many do.
The survey went out in April 2019 to Eckerson Group’s own member list and drew 175 responses, mostly directors, managers, architects and engineers. Eckerson is straightforward about the skew: roughly two thirds of the pool worked in business intelligence environments, which is Eckerson Group’s core audience. The numbers describe data warehousing teams in 2019, not the whole field. That caveat is worth carrying with the figures, because they get quoted without it.
Adoption in 2019: 27% in, 43% out, 30% halfway
More than a quarter of respondents, 27%, said their organization had a DataOps initiative. Another 43% said it had none. The remaining 30% answered “somewhat,” and Eckerson’s reading of that middle group is the most useful sentence in the section: teams that had stood up a Git repository or experimented with agile techniques, without committing to the practices underneath.
The middle column is where the report’s argument lives. Adopting a tool takes an afternoon. Changing how a team decides what “done” means takes longer, and the rest of the survey keeps landing on that distinction.
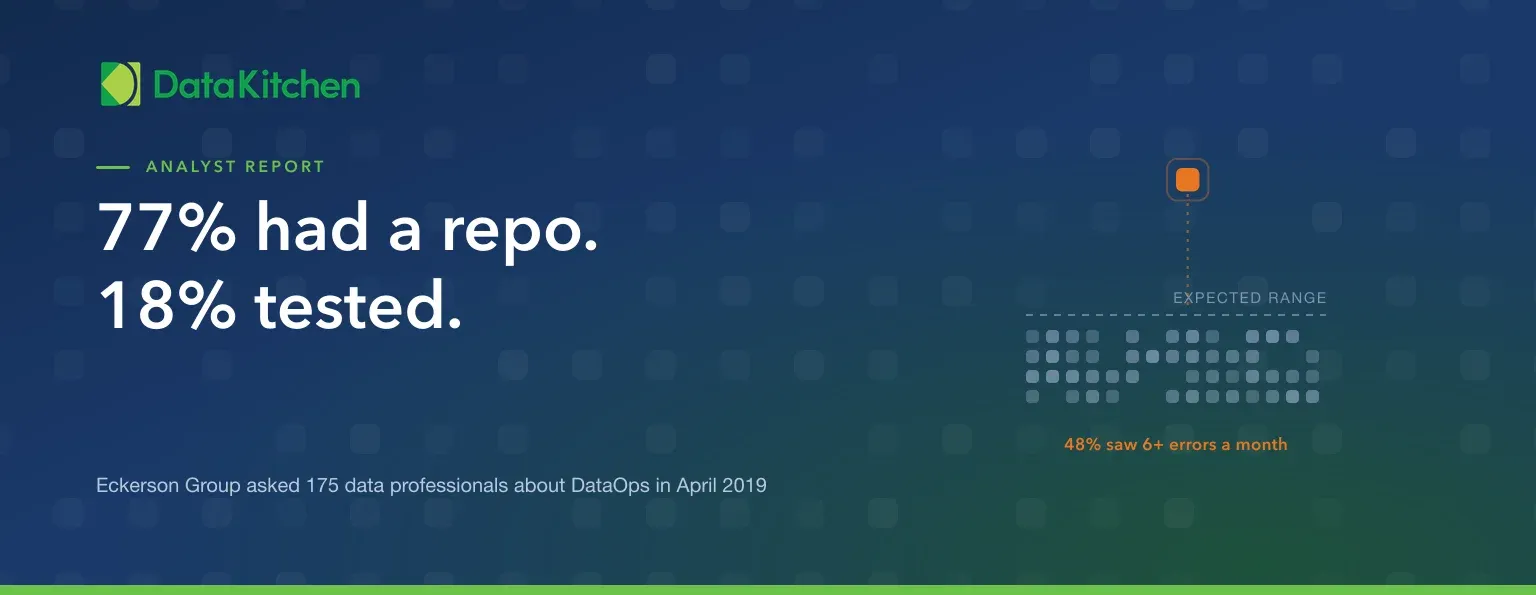
The finding we still quote: 77% had a code repository, 18% had continuous testing
Asked which DataOps tools they actually used, respondents put version control first by a distance and testing last.
| DataOps tool in use | Share of respondents |
|---|---|
| Code repository | 77% |
| CI/CD tools | 45% |
| Performance monitoring tools | 44% |
| Orchestration tools | 37% |
| Configuration repositories | 34% |
| Continuous testing tools | 18% |
Table 1: DataOps tool adoption, from Eckerson Group’s Trends in DataOps (August 2019). Asked of 175 data and analytics professionals surveyed in April 2019.
Eckerson called the 18% surprising, and said why it matters: most DataOps practitioners work test-first, building tests before code and running them at every step of development and on through deployment, so the tests become the pipeline’s early warning system. He expected interest in continuous testing tools to grow.
Our reading of the same table is that the ordering tracks cost of adoption almost exactly. A code repository is the cheapest DataOps tool to adopt: install Git, commit your SQL, and nothing about your data has to change. Continuous testing is the most expensive, because somebody has to decide what correct looks like for every table, and no vendor can decide that for you. The distance between 77% and 18% is the distance between buying DataOps and doing it.
One result there is easy to miss. Organizations with thousands or tens of thousands of sources and targets were far more likely to run performance monitoring (65%) and orchestration software (53%). Eckerson reads that as a maturity signal: at scale, attention shifts from writing pipelines to keeping them running.
Benefits and challenges: the constraint was process, not software
Both questions allowed multiple selections, so neither table totals 100%.
| Benefit of DataOps | Share of respondents |
|---|---|
| Faster cycle times | 60% |
| Happier customers | 55% |
| Deliver new applications more quickly | 50% |
| Fewer defects and errors | 50% |
| Ingest new data sources more quickly | 48% |
| Increased development capacity | 47% |
| Faster change requests | 47% |
| Improved data governance | 42% |
Table 2: Benefits of DataOps, from Eckerson Group’s Trends in DataOps (August 2019), n=175.
| Challenge of DataOps | Share of respondents |
|---|---|
| Establishing formal processes | 55% |
| Orchestrating code and data across tools | 53% |
| Staff capacity | 50% |
| Monitoring the end-to-end environment | 50% |
| Building rigorous tests upfront | 47% |
| Lack of automation tools | 42% |
| Getting business users to buy into the process | 35% |
| Adopting agile methods and teams | 34% |
Table 3: Challenges of DataOps, from the same report and the same 175 respondents.
The top challenge is not a tool. “Establishing formal processes” beat every technical item on the list, and Eckerson’s explanation is that buying DataOps software is easy while using it well requires policies, training and permissions that nobody sells you. One anonymous respondent, quoted in the report, put it better than any vendor could:
Make sure your team is prepared to go slow before it can go fast.
How often things broke, and how long they took
The second half of the survey measured the environment rather than the practice.
| What the survey asked | Result |
|---|---|
| Data errors per month (incorrect data, broken reports, late delivery, customer complaints) | 48% saw more than six; 31% saw three to five |
| Time to build a new data pipeline from scratch | 50% took weeks or months (17% months); 25% days; 18% hours; 8% minutes |
| Time to put a data pipeline into production | 32% took weeks or months; 37% days; 31% minutes or hours |
Table 4: Error rates and elapsed times, from Eckerson Group’s Trends in DataOps (August 2019), n=175. Eckerson reports that these percentages varied little with the scale of the data environment, except on deployment, where organizations with thousands or tens of thousands of sources and targets were more likely to take months (19%).
Eckerson attaches a caveat to the second row that a chart would strip out. His definition of a pipeline covers the whole workflow from ingestion to delivery, and on that definition he calls delivery in days exceptional and treats the “hours” and “minutes” answers as doubtful. Read the fast tail with that in mind.
On use cases the ranking followed the audience: data warehouses and marts (66%), reporting and dashboards (60%), self-service analytics (56%). Among organizations with the most complex environments the order flipped, and data science came first at 64%.
Where DataKitchen’s own audience differed
Eckerson ran the same questionnaire against DataKitchen’s audience of customers and prospects at the same time, and published the comparison inside the report. It is the part we find most useful, and it is not flattering in the way a sponsor might hope.
Active practitioners came out about level: 31% of the DataKitchen audience against 27% of Eckerson’s. Everything else diverged. 52% of our audience answered “somewhat” against 30% of his, so far more were mid-experiment. They were also more likely to run mostly or entirely in the cloud (43%), to apply DataOps to data science projects (62%), to take weeks or months to deploy a pipeline (55%), and to name building rigorous tests upfront as a struggle (64%). Eckerson’s comment was that none of this is surprising given the nature of DataKitchen’s business.
We would put it more plainly. Our audience in 2019 was further ahead on ambition and further behind on cycle time, which is a fair description of who calls a DataOps vendor. People come to us because deployment hurts. DataKitchen published its own key findings from that year’s survey work separately, across a 300-respondent pool, in Key Findings of the 2019 DataOps Survey.
What we would add, seven years on
Four things, and these are DataKitchen’s views rather than Eckerson Group’s.
The 18% aged the least. Continuous testing was the least-adopted item on the 2019 list, and it is still the practice that decides whether the rest of the stack does any good. A repository versions your mistakes. A test catches them. That is why we give the open-source edition of DataOps TestGen away, and why the install is a one-liner rather than a sales call.
The top challenge explains our publishing habits. If 55% of teams stall on establishing formal processes, a feature list is not the useful artifact. A ladder is. That is what the DataOps Maturity Model is for: it names where you are before it names what to buy.
The pattern outlived the percentages. A different population, surveyed two years later, produced the same diagnosis. DataKitchen’s 2021 Data Engineering Survey of 600 data engineers found 97% reporting burnout, with too much time spent finding and fixing errors tied for the largest cause at 50%. The 2019 numbers are dated. The bottleneck they describe is not.
One place we read the framework differently. The report’s core toolset lists automated testing and performance management as separate boxes, which was the standard view in 2019 and is how most tool categories are still drawn. Running these systems since then has convinced us the boxes are one box. A monitor watching job exit codes and CPU reports a green pipeline that delivered a truncated file, because nothing failed. Only a test that knows what the data should look like catches that, which is the argument behind DataOps Observability and behind observing a Data Journey rather than a server.
Where to get the report
The report belongs to Eckerson Group. Three places to go next:
- Trends in DataOps: Bringing Scale and Rigor to Data and Analytics on eckerson.com, the source for everything above.
- The sponsored PDF, 21 pages, no form.
- Best Practices in DataOps, the June 2019 companion, which we also summarise here. Eckerson recommends reading the two together, and he is right: this one counts, that one explains.
FAQ
What are the key points in this blog?
Eckerson Group’s Trends in DataOps, written by Wayne W. Eckerson and published in August 2019, surveyed 175 data and analytics professionals that April. It found 27% with a DataOps initiative against 43% with none, a code repository in use at 77% of organizations but continuous testing at only 18%, establishing formal processes as the top challenge at 55%, and 48% of respondents seeing more than six data errors a month.
Who wrote Trends in DataOps, and who paid for it?
Wayne W. Eckerson wrote it and Eckerson Group published it in August 2019. DataKitchen sponsored the research. Eckerson Group holds the copyright and did the analysis; this page is DataKitchen’s summary of their work rather than a copy of it, and the report is available on Eckerson Group’s own site.
How many organizations had adopted DataOps in 2019?
In Eckerson Group’s April 2019 survey of 175 respondents, 27% said their organization had a DataOps initiative, 43% said it had none, and 30% answered somewhat. Eckerson read that middle group as teams that had stood up a Git repository or tried some agile techniques without committing to the wider practice.
Which DataOps tools were most widely used in 2019?
A code repository, by a wide margin, at 77% of Eckerson Group’s 2019 respondents. CI/CD tools followed at 45%, performance monitoring at 44%, orchestration at 37% and configuration repositories at 34%. Continuous testing tools came last at 18%, which Eckerson called surprising given that test-first development is central to DataOps.
What was the biggest obstacle to DataOps adoption?
Establishing formal processes, selected by 55% of Eckerson Group’s 2019 respondents. It outranked every technical challenge, including orchestrating code and data across tools at 53%, staff capacity at 50%, monitoring the end-to-end environment at 50% and building rigorous tests upfront at 47%. Buying the tools was never the hard part.
How long did it take teams to build and deploy a data pipeline in 2019?
Half of Eckerson Group’s 2019 respondents took weeks or months to build a new pipeline from scratch, 17% of them months. On deployment, 32% took weeks or months, 37% took days, and 31% managed minutes or hours. Eckerson noted his definition covers ingestion through delivery, which makes the fastest answers hard to credit.
Are the 2019 DataOps survey numbers still valid?
Cite them with the year attached: they describe a 2019 population that skewed toward business intelligence and data warehousing teams. The pattern has proved more durable than the percentages. DataKitchen’s 2021 survey of 600 data engineers found 97% reporting burnout, with time spent finding and fixing errors tied for the largest cause at 50%.