
Why Becoming Data-Driven Is Hard
Most enterprise companies recognize the need to be data-driven, yet 60% of data projects fail to move past preliminary stages, and 87% of data science projects never make it to production. More surprisingly, the number of data-driven companies has actually fallen from 37% to 31% since 2017, despite increased investment, according to Gartner.
Why? Because becoming data-driven is hard. Data teams are caught between the competing demands of data consumers, data providers, and supporting teams. Typically, data consumers live in an “Amazon world” and expect trusted, original insight on-demand. Yet data providers often send inaccurate, late, or error-prone data sets. The flawless collaboration demanded of stakeholders often just isn’t there.
Taken together, the need to manage complex toolchains and data, as well as collaborate with other organizations, roles, locations, and data centers, saps the data team’s time. In fact, most data teams spend more time fixing errors and addressing operational issues than innovating and providing business value. According to Gartner, only 22% of a data team’s time is spent on new initiatives and innovation. As a result, many data teams are not meeting expectations, or worse, are beaten down and disempowered.
| Where a data team’s time goes | Average proportion | Gartner’s definition |
|---|---|---|
| Execution | 56% | Delivering on data management requirements using its own resources for implementing and maintaining production initiatives |
| Enablement | 23% | Facilitating and educating the business on data management practice, and supporting data management functions in the business |
| Innovation | 22% | Driving data management in support of data innovation, data monetization and enhanced analytical insights |
Figure 1 in the original paper charts this split as a single stacked bar. The numbers matter more than the picture, so they are a table here. Source: March 2020 Gartner survey, “Data Management Struggles to Balance Innovation and Control.” The same figures anchor the 2021 Data Engineering Survey, which found 97% of 600 data engineers reporting burnout.
What Is DataOps?
In data analytics, DataOps provides the path forward. Research shows that “organizations that adopt a DevOps- and DataOps-based approach are more successful in implementing end-to-end, reliable, robust, scalable and repeatable solutions,” says Gartner’s Sumit Pal (Gartner, November 2018).
DataOps is a set of technical practices, cultural norms, and architectures that enables:
- Rapid experimentation and innovation for the fastest delivery of new insights to customers
- Low error rates
- Collaboration across complex sets of people, technology, and environments
- Clear measurement and monitoring of results
DataOps draws on the principles of Agile, DevOps, and Lean manufacturing to transform data processes. Supported by automation, it puts the focus on the underlying systems and managing the ‘data factory.’ Companies that implement DataOps realize multiple, simultaneous benefits. They:
- Experience orders of magnitude improvements in cycle time. They are able to deploy new analytics quickly and confidently, often delivering in hours or days instead of weeks or months.
- Lower or even eliminate costly and embarrassing errors, enabling organizations to build a strong culture of trust with their data customers.
- Dramatically increase productivity. Better intra- and inter-team collaboration means less time spent on meetings and bureaucracy and more on innovation.
NOTE
For a fuller definition of the discipline itself, see What is DataOps?
A Maturity Model Can Help You Get Started
Because DataOps impacts your end-to-end analytic lifecycle, implementing DataOps can feel overwhelming. Even though a majority of respondents in a 2020 Seagate/IDC survey said that DataOps was “very” or “extremely” important, only 10% have implemented DataOps fully across the enterprise. Success requires a mindset shift and most companies struggle with where to begin and how to even make modest progress towards their goals. A DataOps Maturity Model can be an incredibly useful tool to help organizations understand where they are today and how to get where they need to go.
What Is Important in DataOps?
To begin a DataOps initiative, it is first important to understand what is important (and what isn’t) for DataOps success. DataOps requires a focus on the state of your data operations and processes, not the next new feature or tool. Typically, data teams can spend far too much time worrying about data types (e.g., batch, streaming, big, small, structured, unstructured), database types (e.g., Hadoop, Spark, graph, NoSQL, object stores), data tools (e.g., ETL, BI, data science, data prep, catalog), or specific design paradigms (e.g., lakes, warehouses, ML models).
DataOps employs automated orchestration to simplify complex toolchains, environments, and team collaboration, so that the data team can quickly and continuously deliver high-quality, error-free insight. To implement DataOps, organizations need to prioritize improvements in the six following areas:
- Error Rates
- Measurement
- Cycle Time
- Team Culture
- Collaboration
- Customer Happiness
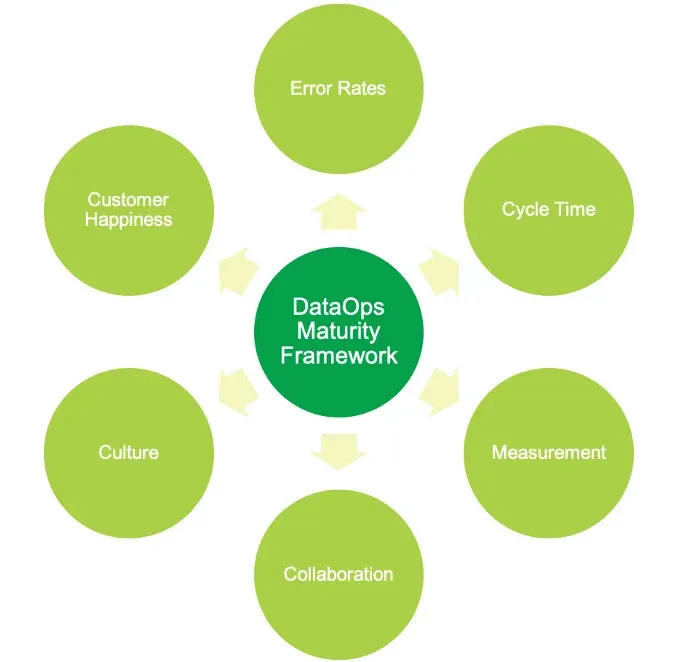
Each of these areas can be improved by implementing core DataOps capabilities such as automated testing and monitoring, toolchain orchestration, version control, sandbox creation and management, and continuous deployment. The table below is the mapping the original Figure 3 draws: business constraints on the left, and the DataOps capabilities that relieve them on the right.
| Business constraint | DataOps capabilities that address it |
|---|---|
| Errors | Automated testing, monitoring, orchestration |
| Slow deployment | Automated testing, continuous deployment, sandbox creation and management |
| Poor collaboration | Sandbox creation and management, version control, code review |
| No measurement | Process metrics |
| Unhappy customers | No single capability. Trust and responsiveness follow from low error rates and short cycle time. |
| Poor team culture | No single capability. Agile and Lean principles, with errors treated as an opportunity to improve. |
The mapping above is drawn from the paper’s own per-dimension prose rather than reconstructed from the figure’s artwork, and the last two rows are left general because the paper names no specific capability for them.
A DataOps Maturity Model
Maturity models are commonly used to measure an organization’s ability to continuously improve in a particular discipline. This document outlines a maturity model measurement approach for building, monitoring, and deploying data and analytics according to DataOps principles. With this model, teams can understand where they are today, and what needs to be done to move up the curve.
The model provides a structure for reviewing your organization’s capabilities across the six different DataOps dimensions. Results will enable you to customize strategies to get started or improve. A robust DataOps program will be optimized across all the dimensions.
A DataOps Maturity Assessment asks questions across the six categories that form the dimensions of the DataOps Maturity Model. Along each dimension, progress toward maturity can be categorized as:
| Level | Name | What it means |
|---|---|---|
| 5 | Optimized | Focus on continuous improvement and change |
| 4 | Quantitative | Processes are measured and controlled |
| 3 | Consistent | Automated processes are being applied across the entire data analytic development lifecycle |
| 2 | Basic | Processes are documented and partly automated |
| 1 | Struggle | Processes are unrepeatable, poorly controlled, manual, and reactive |
The Six Primary DataOps Dimensions
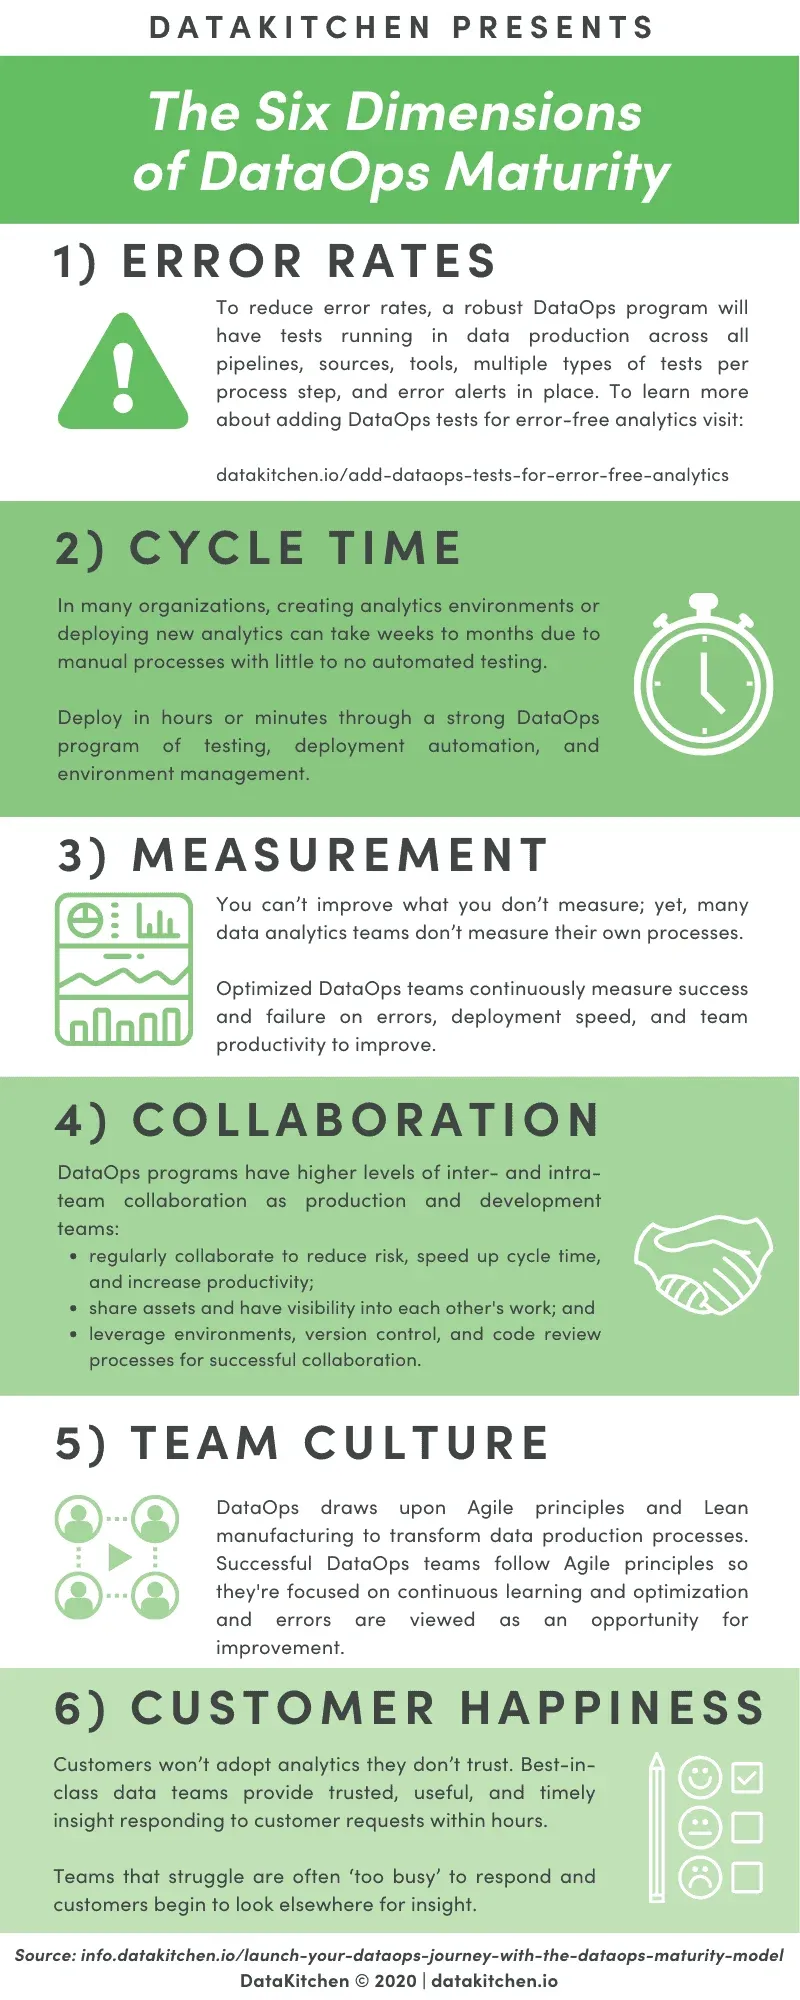
Every company is on a journey toward achieving excellence and will have strengths and weaknesses. Just because an organization is large, does not mean that it is excellent. In fact, the flaws in a process or methodology become particularly noticeable when a team grows. Low ratings on any dimension should not be viewed as a negative, but instead as an opportunity for improvement.
The paper devotes a figure to each dimension, Figures 4 through 9, showing the progression from struggling to optimized. The table below carries the two endpoints the paper describes for all six dimensions in one place. The five-level scale above applies between them.
| Dimension | Level 1: Struggle looks like | Level 5: Optimized looks like |
|---|---|---|
| Production error rates | No automated tests in production. Costly and embarrassing errors, often discovered by customers. | Tests running in production across all pipelines, sources, and tools, with multiple types of tests per process step and error alerts in place. Typically less than one error per year. |
| Deployment cycle time | Creating analytic environments or deploying new analytics runs weeks to months. Manual processes with little or no automated testing. In the worst case, development happens in the production environment that also hosts live data operations. | New analytics and new development environments in hours, or even minutes. Error-free automated deployment through a full suite of tests. |
| Collaboration | Unreliable processes, chance meetings, and often yelling when things go wrong. Analytic and line-of-business teams at war with each other. | High levels of inter- and intra-team collaboration. Production and development teams collaborate regularly to reduce risk, speed cycle time, and raise productivity. Assets are shared between teams, with visibility into each other’s work through environments, version control, and code review. |
| Measurement | No metrics tracked, no reports created, or worse, no data collected at all. | Success and failure measured continuously through detailed process analytics on errors, deployment speed, and team productivity. Metrics regularly shared and reviewed with the team and internal customers, with a focus on improvement. |
| Team culture | Waterfall principles. Errors go undiscovered or are hidden, and blame is passed around when things go wrong. | Agile principles as a strong part of the overall company culture. Focus on continuous learning and optimization, with errors viewed as an opportunity for improvement. |
| Customer happiness | Teams are often ‘too busy’ to respond. Customers begin to look elsewhere for insight. | Responses to customer requests within hours, and consistently timely, useful insight. |
Production Error Rates
Organizations that follow DataOps principles typically have less than one error per year. That is orders of magnitude better than the industry norm. In a recent DataOps survey, only 3% of the companies surveyed approached that level of quality. Eighty percent of companies surveyed reported three or more errors per month. Thirty percent of respondents reported more than 11 errors per month.
To reduce the level of errors, robust DataOps programs use automated testing, monitoring, and orchestration in their production pipelines. Inspired by statistical process control, they will have tests running in production across all pipelines, sources, and tools, multiple types of tests per process step, and error alerts in place.
In contrast, teams that struggle will have no automated tests in production. This results in costly and embarrassing errors, often discovered by customers. For the breadth of tests a production pipeline needs, see add DataOps tests for error-free analytics.
TIP
Install Open Source DataOps TestGen to score your own error-rate dimension against a real database this week, instead of estimating it.
Deployment Cycle Time
Many organizations experience lengthy cycle times for creating analytic environments or deploying new analytics that run weeks and months. This is often due to manual processes with little to no automation or automated testing in place. In the worst case scenario, development work is done in the production technical environment that also hosts live data operations.
Deployment cycle time can be shortened through a strong program of testing, deployment automation, and environment management. Optimized DataOps programs can deploy new analytics and create new development environments in hours, or even minutes. In DataOps, error-free automated deployment is realized through a full suite of tests.
Well-Coordinated Inter- and Intra-Team Collaboration
Organizations with an optimized DataOps program have high levels of inter- and intra-team collaboration. In these organizations, production and development teams regularly collaborate to reduce risk, speed cycle time, and achieve overall greater productivity. They are able to share assets between teams and have visibility into each other’s work. These teams also leverage environments, version control, and code review processes for successful collaboration.
On the contrary, organizations that struggle tend to have unreliable processes, chance meetings (and often yelling when things go wrong). Analytic and line-of-business teams are often at war with each other.
Success and Failure Measured
You can’t improve what you don’t measure, yet it is surprising how many data analytics teams don’t measure their own processes. Optimized DataOps teams continuously measure success and failure through detailed process analytics on errors, deployment speed, and team productivity. Metrics are regularly shared and reviewed with the team and internal customers, with a focus on improvement. Conversely, teams that struggle don’t track metrics or create reports, or worse, don’t collect any data at all.
Team Culture
DataOps draws upon the principles of Agile and Lean manufacturing to transform processes that manage data on its journey toward value creation. Successful DataOps teams follow Agile principles which are a strong part of the overall company culture. These organizations are focused on continuous learning and optimization and errors are viewed as an opportunity for improvement.
On the opposite end of the spectrum are companies that follow waterfall principles. Errors go undiscovered or are hidden and blame is passed around when things go wrong.
Happy Customers
Customers won’t adopt analytics they don’t trust. At the end of the day, delivering trusted, timely insight is a critical measure of success. Best-in-class data teams will respond to customer requests within hours and always provide timely, useful insight. Teams that struggle are often ‘too busy’ to respond. Customers begin to look elsewhere for insight — the death knell for a data analytics team.
What Does Good Look Like?
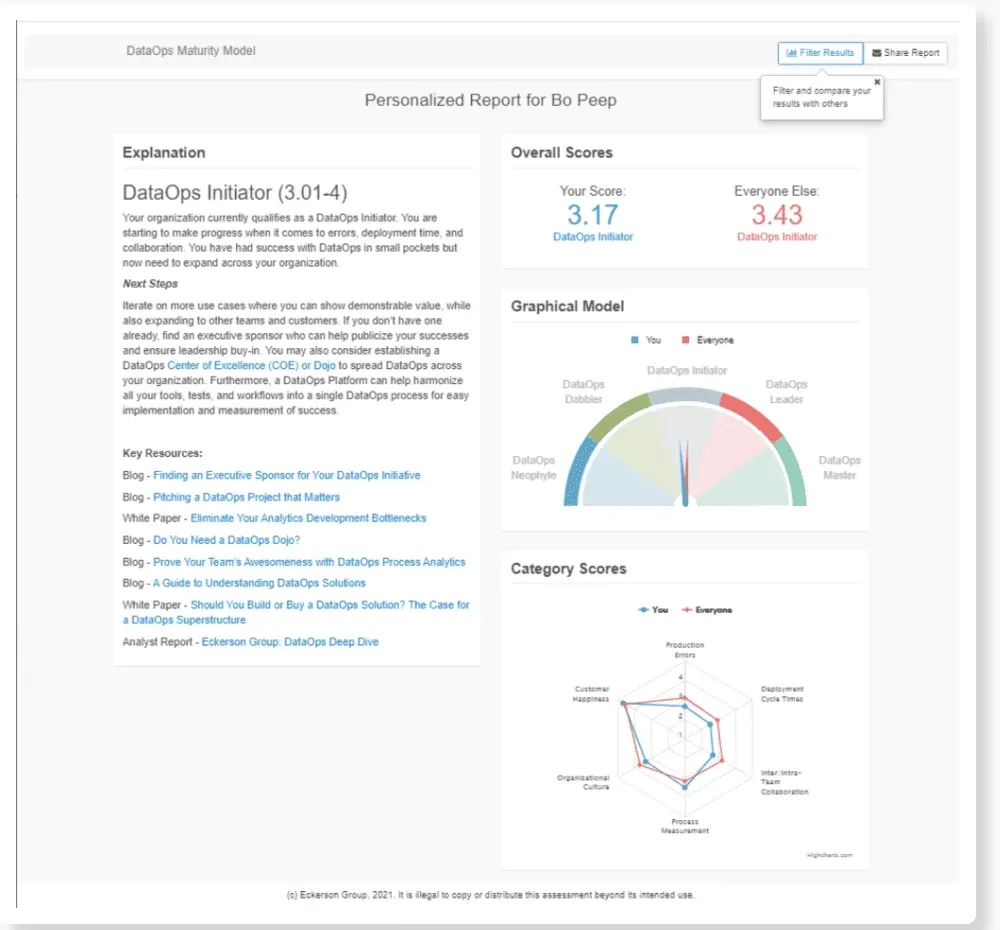
No company will initially excel across all six dimensions. Typical results are lopsided: strong on one or two dimensions, weak on the rest. The results of your maturity assessment will help your organization plan a roadmap for success. The goal of a DataOps maturity assessment is to provoke a discussion across your organization, to identify areas for improvement, and to guide investment in the processes and tools that can help.
The good news is that success in one particular dimension does not have to be traded-off against others. In organizations that don’t practice DataOps, this is a common practice. They often trade speed for quality (or vice versa). For example, in order to reduce fear and uncertainty over errors, a team may establish practices, like documentation, checks and balances, and lots of meetings, that lengthen their cycle time and reduce productivity. With DataOps practices in place, you can excel in both speed and quality. Best-in-class data organizations do well across the board, leading to overall greater productivity and lower costs.
By focusing on the right areas, a data team can start to look more like Bristol Myers Squibb (formerly Celgene), a company that is now several years into their DataOps journey. This team initially overcame obstacles that prevented analytics responsiveness and quality. Data was organized in silos, using a variety of technologies and isolated platforms. Without the right processes and tools in place, the data engineering and analytics teams spent a majority of their time on data engineering and pipeline maintenance. This distracted them from their main mission: producing analytic insights that help the business attain its objectives.
After implementing DataOps, they now achieve excellence across all critical dimensions. Figure 11 in the paper plots that as a radar chart with every axis at the top of the scale; the underlying results, dimension by dimension, are below.
| Dimension | Bristol Myers Squibb after DataOps |
|---|---|
| Production error rates | Very, very few errors or missed SLAs |
| Deployment cycle time | Weekly cycle time of new changes, features, and data |
| Measurement | Detailed process metrics |
| Team culture | Agile culture |
| Collaboration | High inter- and intra-team coordination |
| Customer happiness | High customer satisfaction |
The Journey to Excellence
As most organizations come to recognize the benefits of a DataOps program, adoption is often a no-brainer. DataOps provides the foundation for analytic excellence. It streamlines the development of new analytics, shortens cycle time, and automates the data analytic pipeline, freeing the team to focus on value-add activities. It also controls the quality of the data flowing through the pipeline so users can trust their data. With DataOps in place, the team is productive, responsive, and efficient.
Because implementation of DataOps requires a mindset shift, one of the biggest challenges becomes where and how to start. The DataOps Maturity Model provides a quick objective way for organizations to assess the maturity of their DataOps initiative and breaks down the critical elements of a DataOps program into concrete, actionable areas for improvement.
Ready to get started? Take the DataOps Maturity Assessment to score your organization across all six dimensions and see how you compare with everyone else.
Related Reading
- The DataOps Maturity Assessment — score your own organization across the six dimensions
- 6 Steps to an Enterprise DataOps Transformation — the program that runs once the assessment names your weakest dimension
- 7 Steps to Implement DataOps — the technical practices that move the error-rate and cycle-time scores
- 2021 Data Engineering Survey — the same Gartner time-allocation data, and what the innovation squeeze does to engineers
- Warring Tribes into Winning Teams — the collaboration dimension, in depth
- What is DataOps? — the discipline this model measures
- Infographic: 6 Dimensions of DataOps Maturity — the one-page version to share with colleagues
FAQ
What is the main point of this paper?
Most companies accept that they need DataOps and stall on where to start. A maturity model breaks that stall by scoring an organization on a five-level scale from Struggle to Optimized, across six dimensions of DataOps practice: error rates, cycle time, collaboration, measurement, team culture, and customer happiness. The lowest score tells a team which concrete improvement to make first.
What are the six dimensions of the DataOps Maturity Model?
Error rates, cycle time, collaboration, measurement, team culture, and customer happiness. Each one can be improved by implementing core DataOps capabilities such as automated testing and monitoring, toolchain orchestration, version control, sandbox creation and management, and continuous deployment. A robust DataOps program ends up optimized across all six rather than strong in one.
What are the five levels of DataOps maturity?
Level 1 Struggle: processes are unrepeatable, poorly controlled, manual, and reactive. Level 2 Basic: processes are documented and partly automated. Level 3 Consistent: automated processes are applied across the entire data analytic development lifecycle. Level 4 Quantitative: processes are measured and controlled. Level 5 Optimized: the focus is continuous improvement and change.
How many errors should a data team expect per month?
Organizations that follow DataOps principles typically have less than one error per year, orders of magnitude better than the industry norm. In a DataOps survey, only 3% of companies surveyed approached that level of quality. Eighty percent reported three or more errors per month, and 30% of respondents reported more than 11 errors per month.
How do you reduce error rates in a data pipeline?
Use automated testing, monitoring, and orchestration in production pipelines. Inspired by statistical process control, a robust program runs tests in production across all pipelines, sources, and tools, with multiple types of tests per process step and error alerts in place. Teams that struggle have no automated tests in production, so customers find the errors first.
How long should it take to deploy new analytics?
Optimized DataOps programs deploy new analytics and create new development environments in hours, or even minutes. Many organizations instead experience cycle times of weeks and months, usually because processes are manual with little or no automated testing. Shortening cycle time takes a strong program of testing, deployment automation, and environment management.
What does good collaboration look like in a data team?
Production and development teams collaborate regularly to reduce risk, speed cycle time, and achieve greater productivity. They share assets between teams and have visibility into each other’s work, and they lean on environments, version control, and code review to do it. Teams that struggle rely on unreliable processes and chance meetings, and analytic and line-of-business teams end up at war.
Why does measuring your own process matter in DataOps?
You can’t improve what you don’t measure, and it is surprising how many data analytics teams don’t measure their own processes. Optimized teams continuously measure success and failure through detailed process analytics on errors, deployment speed, and team productivity, then share and review those metrics with the team and internal customers with a focus on improvement.
What kind of team culture does DataOps require?
An Agile one, where continuous learning and optimization are the norm and errors are treated as an opportunity for improvement rather than a reason to assign blame. DataOps draws on the principles of Agile and Lean manufacturing. At the other end of the spectrum are waterfall organizations where errors go undiscovered or get hidden and blame is passed around.
How do you know whether your data customers are happy?
Customers won’t adopt analytics they don’t trust, so delivering trusted, timely insight is a critical measure of success. Best-in-class data teams respond to customer requests within hours and consistently provide useful insight. Teams that struggle are often too busy to respond, and their customers begin to look elsewhere — the death knell for a data analytics team.
Do you have to trade speed for quality?
No, and assuming you do is a symptom of not practising DataOps. Organizations without DataOps routinely trade one for the other. To reduce fear about errors, a team adds documentation, checks and balances, and meetings, which lengthen cycle time and reduce productivity. With DataOps practices in place a team can excel at both speed and quality.
What results has a company seen from working the six dimensions?
Bristol Myers Squibb, formerly Celgene, is several years into its DataOps journey and is now optimized across all six dimensions: very few errors or missed SLAs, weekly cycle time for new changes, features and data, detailed process metrics, an Agile culture, high inter- and intra-team coordination, and high customer satisfaction. Its data had previously sat in silos across isolated platforms.
How do you take the DataOps Maturity Assessment?
The assessment asks questions across the six categories that form the dimensions of the DataOps Maturity Model and returns a score per dimension plus a comparison against other organizations. The result is a roadmap rather than a grade: it is designed to provoke a discussion across your organization, identify areas for improvement, and guide investment in processes and tools.
Get the PDF
The full paper is on this page. Fill in the form for a PDF copy to keep or share.