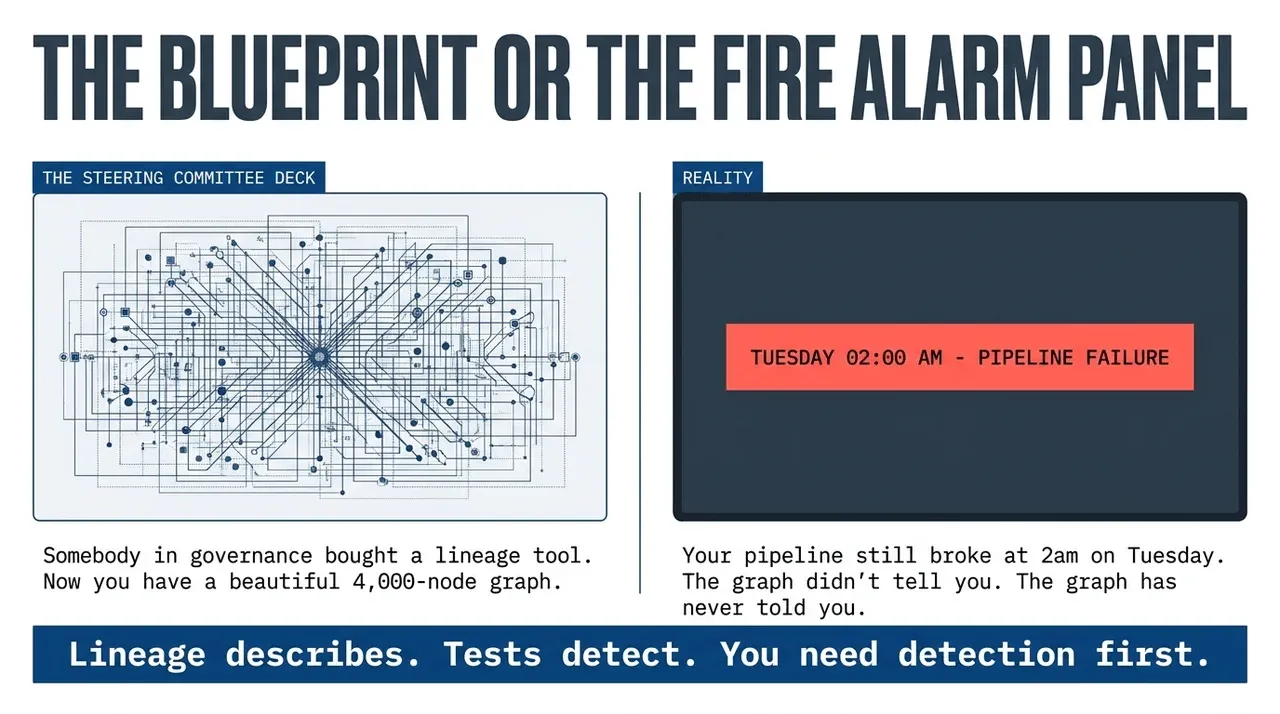
Somebody in governance bought a lineage tool. Now you have a graph. It has 4,000 nodes, the lines glow when you hover over them, and it looks fantastic in a steering committee deck.
Your pipeline still broke at 2am on Tuesday. The graph didn’t tell you. The graph has never told you.
I’ve been building data and analytics systems for close to 30 years. I have never once fixed a production data problem by looking at a lineage diagram. Not one time. I’ve looked at plenty of them. When the CMO’s sales number was wrong on a Monday morning, the lineage graph sat there as decoration while someone on my team ran SQL by hand to find the bad rows.
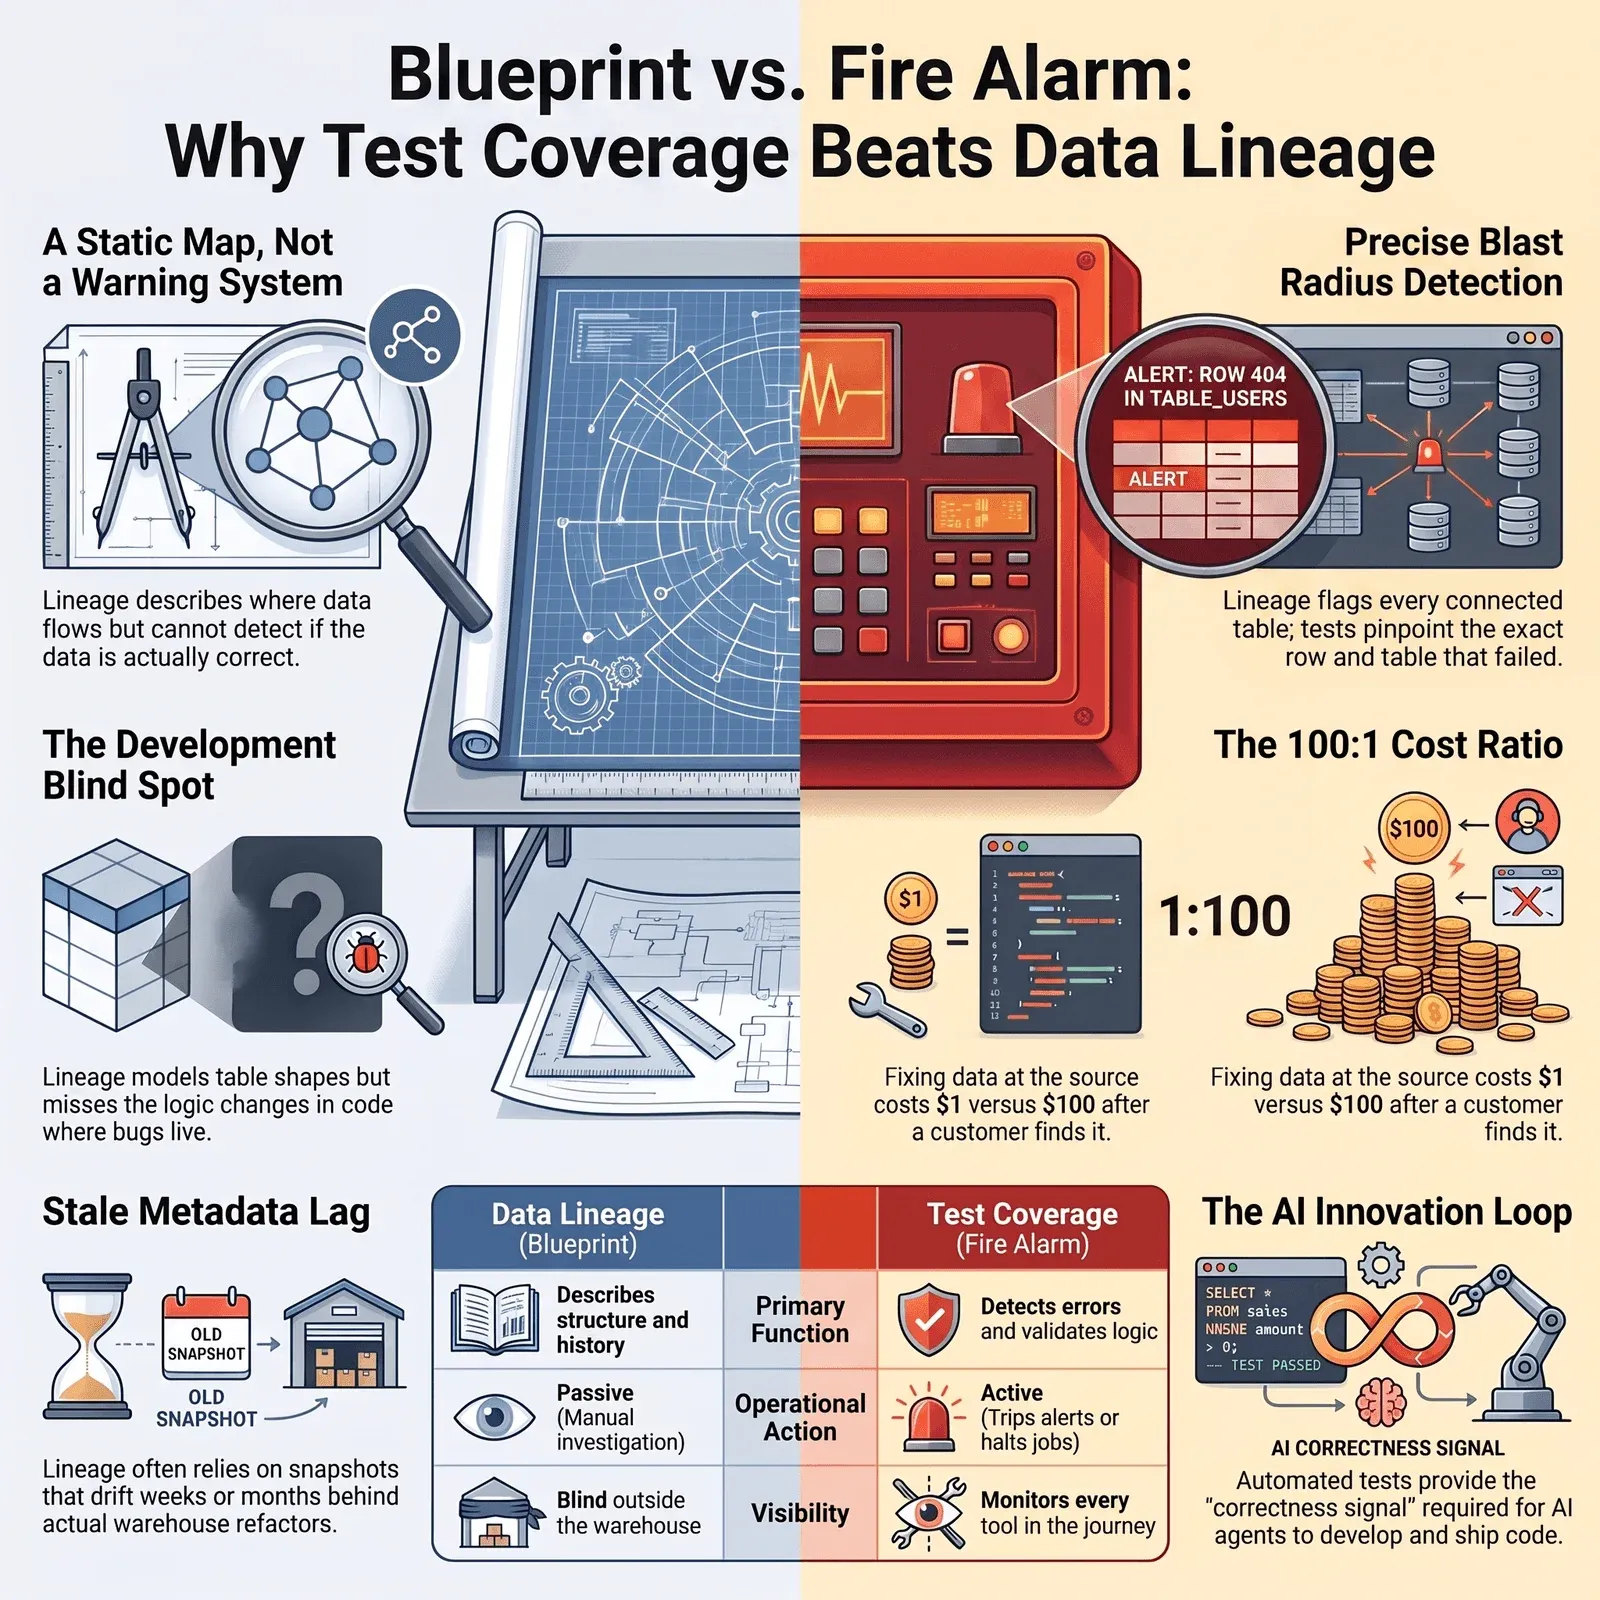
That’s the whole argument of this post. Lineage describes. Tests detect. You need detection first.
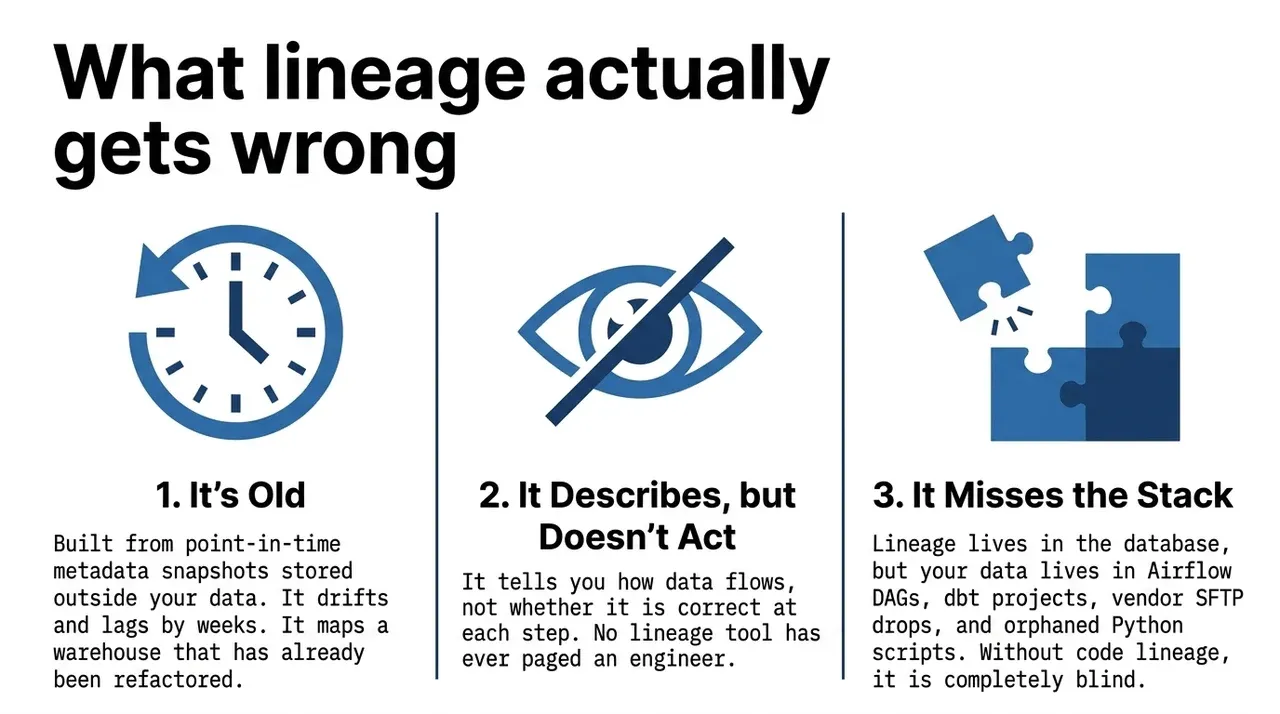
What lineage actually gets wrong
It’s old. Lineage gets built from snapshots of metadata taken at a point in time and stored in a system that isn’t your data. It drifts. It lags by weeks, sometimes months. The graph you’re looking at describes a warehouse that’s been refactored twice since the last scan.
It describes, and it doesn’t act. Lineage answers where data came from and where it goes. It doesn’t answer the question you actually have at 2am, which is whether the number is right and which step broke it. As we put it in Data Quality Testing Is At The Core of Four Critical Data Team Processes, lineage tells you how data flows, not whether the data is correct at each step. No lineage tool has ever paged you.
It misses most of your stack. Lineage lives in the database. Your data doesn’t. Your data goes through an Airflow DAG, a dbt project, a Python script somebody wrote in 2019 before leaving the company, a vendor SFTP drop, a Tableau extract, and a reverse ETL job pushing back into Salesforce. Chad Sanderson makes this point in his Shift Left Data Manifesto: without code lineage, your data lineage is blind outside the warehouse. Most of your failures live in exactly that blind spot.
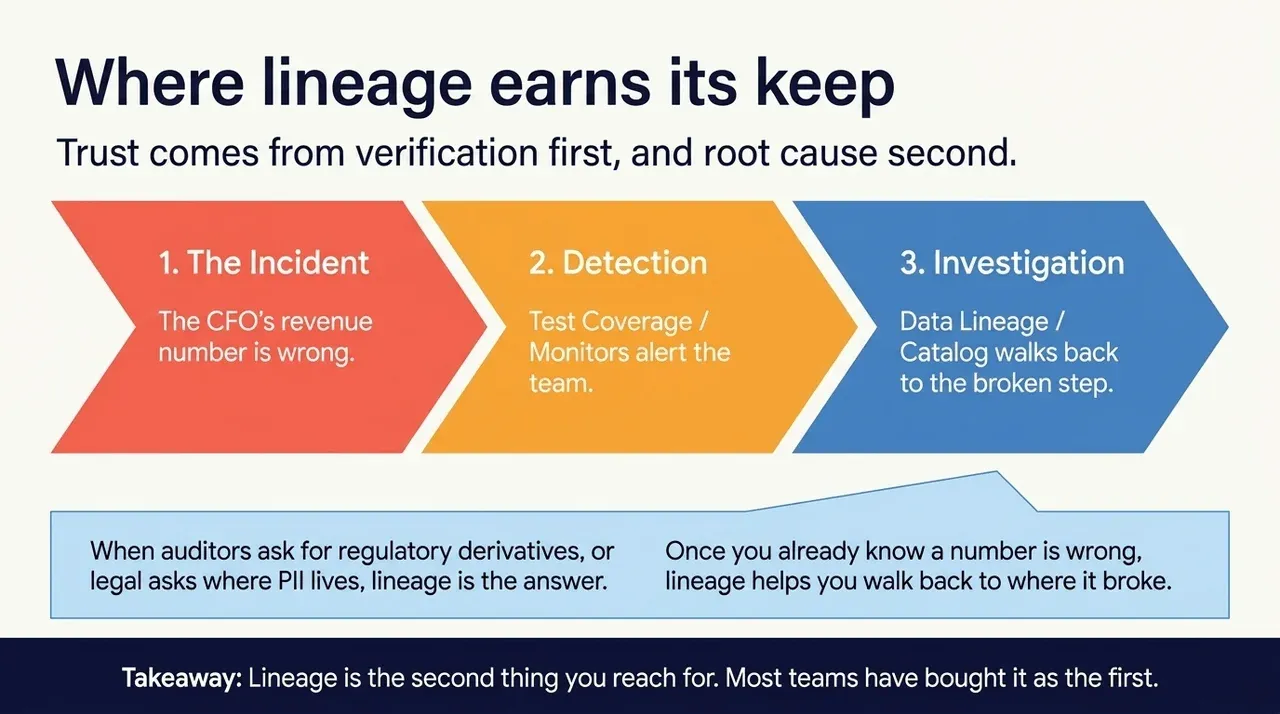
Where lineage earns its keep
Trust comes from verification first and root cause second. Lineage is a root cause tool. It’s a good one.
When legal asks where customer PII lives, lineage answers that. When an auditor asks how a regulatory figure got derived, lineage answers that. When a new engineer joins and needs to understand how 300 tables relate, lineage plus a data catalog beats reading DDL for a week. And once you already know a number is wrong, lineage helps you walk back to where it went wrong.
Notice the order. Every one of those uses starts after somebody already knows something is broken. Lineage is the second thing you reach for. Most teams have bought it first.
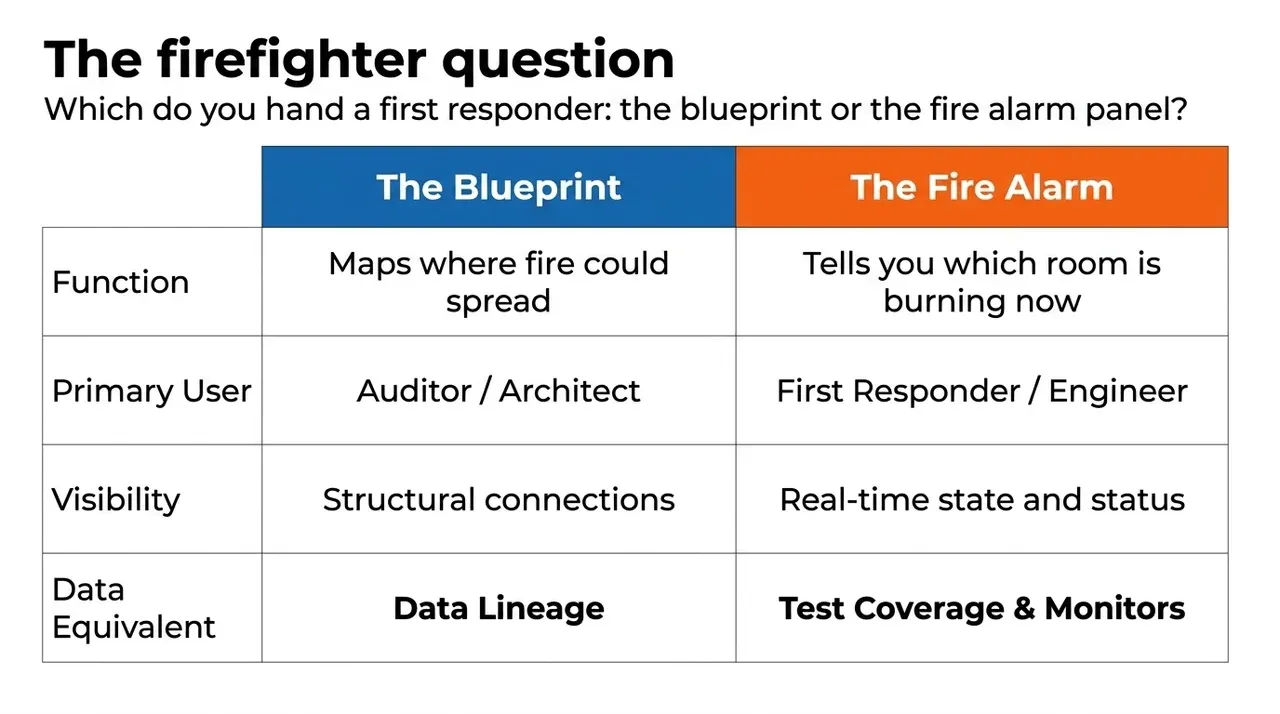
The firefighter question
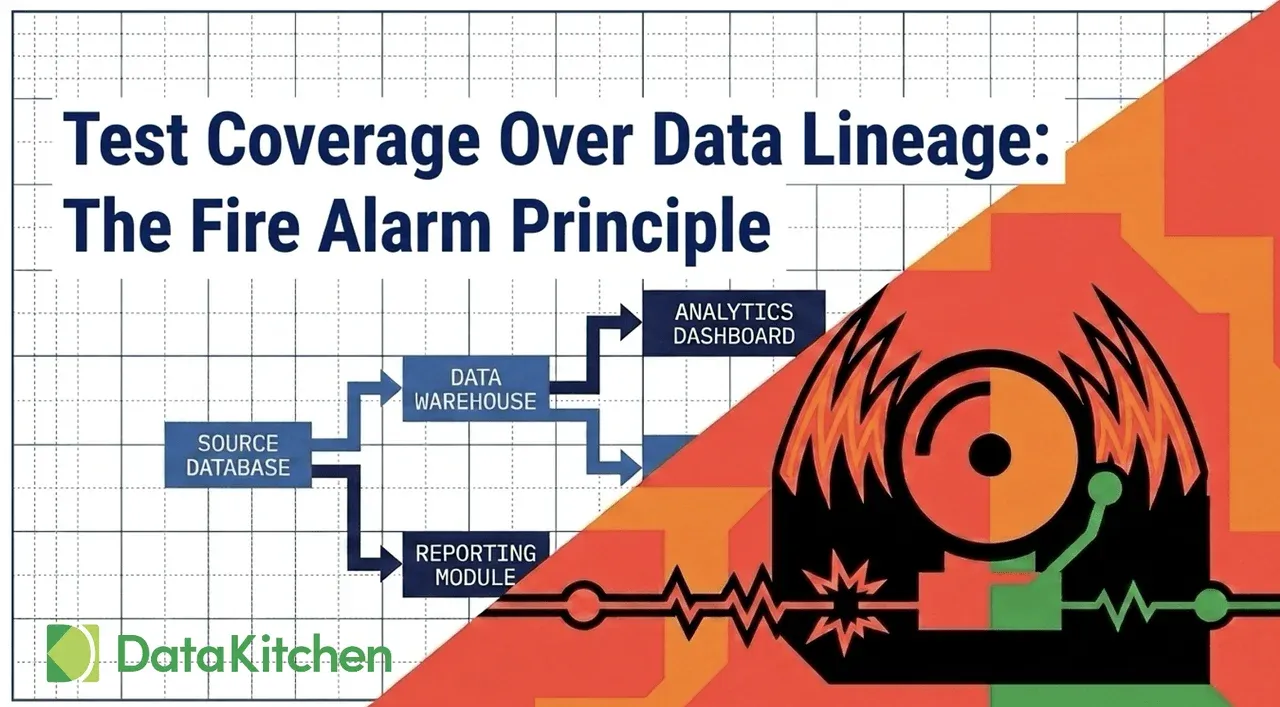
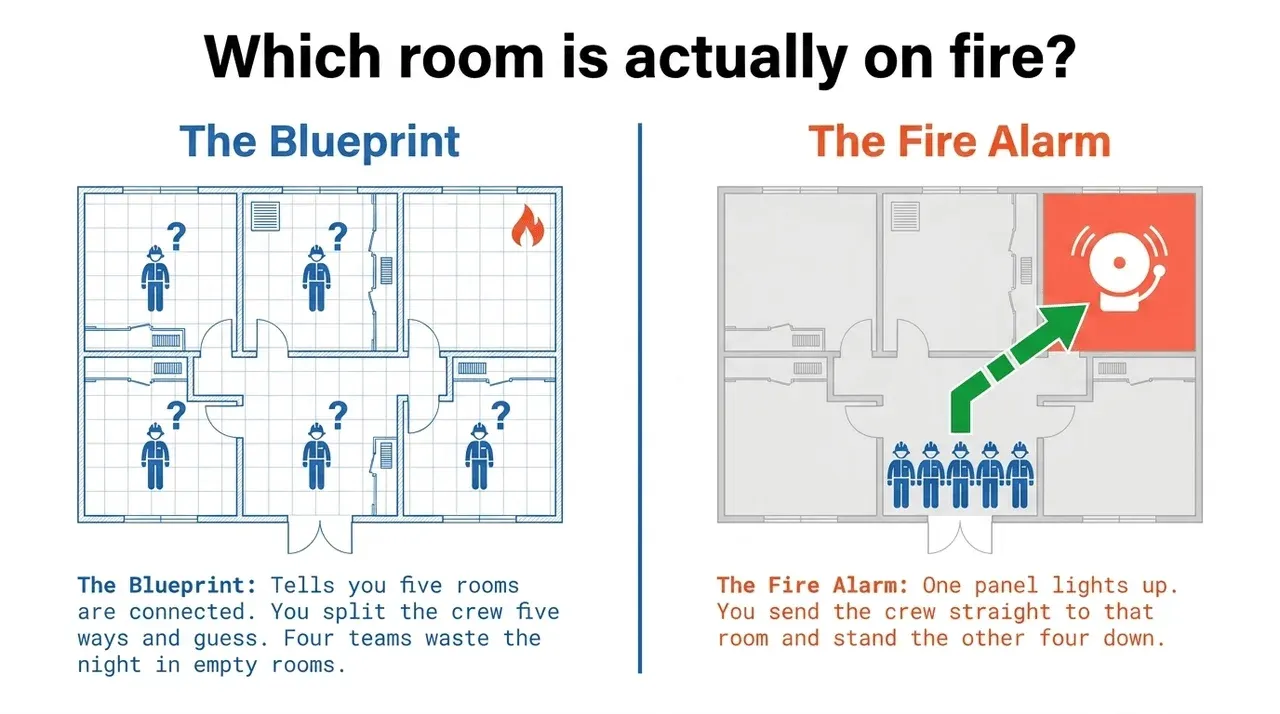
A firefighter walks into your building. Which do you hand them: the blueprint or the fire alarm control panel?
The blueprint tells them where fire could spread. The panel tells them which room is burning right now. They’ll take the panel. They’ll look at the blueprint later, once the fire is out and somebody wants to know how it got from the kitchen to the third floor.
Lineage is your blueprint. Tests and monitors are your fire alarm panel.
Which room is actually on fire?
A room is on fire. It connects to five others. Two share a door. One shares a ceiling vent. One is fed off the same service duct. One is two floors up on the same shaft.
You have the blueprint. It tells you all five rooms are connected. It does not tell you which one has smoke in it. So you split the crew five ways, and guess what? Four of those teams spend the night standing in a room where nothing is happening.
Now put a fire alarm in every room. One panel lights up. You send the crew to that room first and stand the other four down.
Same building. Same blueprint. Completely different night.
The same question in SQL
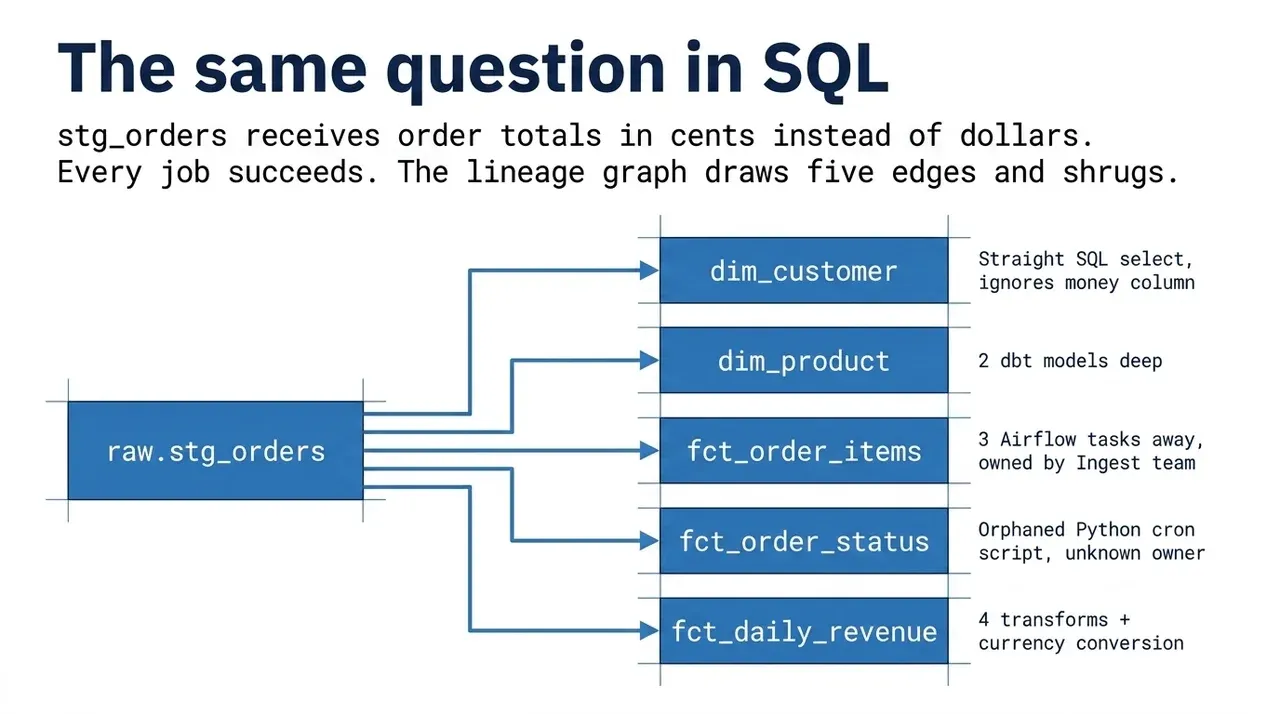
A source system in your APAC region starts sending order_total in cents instead of dollars. Nobody told you. The schema didn’t change. The row counts didn’t change. Every job in the chain succeeded.
stg_orders feeds five tables, and none of those paths look like another.
Path 1 is dim_customer. One hop, and it never touches the money column.
select
    customer_id,
    email,
    min(order_ts)::date as signup_date
from raw.stg_orders
group by customer_id, email;
Path 2 is dim_product, two dbt models deep.
-- models/int_product_orders.sql
select product_id, order_id
from raw.stg_orders;

-- models/dim_product.sql
select p.product_id, p.sku, p.category, count(o.order_id) as order_count
from raw.products p
left join {{ ref('int_product_orders') }} o using (product_id)
group by 1, 2, 3;
Path 3 is fct_order_items, three Airflow tasks away, and the ingest team owns it.
select o.order_id, l.item_id, l.qty
from raw.stg_orders o
join raw.order_lines l using (order_id);
Path 4 is fct_order_status, built by a Python job on its own cron that isn’t in the DAG at all.
# status_sync.py, runs at 04:15, nobody on the call remembers who owns it
df = read_sql("select order_id, status, updated_at from raw.stg_orders")
write_table("analytics.fct_order_status", df)
Path 5 is fct_daily_revenue, four transforms and a currency conversion away.
-- models/int_orders_clean.sql
select order_id, order_ts::date as order_date, region_code, currency_code, order_total
from raw.stg_orders
where status <> 'cancelled';

-- models/int_orders_usd.sql
select order_date, region_code, order_total * fx.rate_to_usd as order_total_usd
from {{ ref('int_orders_clean') }} o
join ref.fx_rates fx using (currency_code);

-- models/fct_daily_revenue.sql
select order_date, sum(order_total_usd) as order_total
from {{ ref('int_orders_usd') }}
group by order_date;
Those are your doors and your vents. One is a straight select. One belongs to a team you have to Slack. One runs on a cron nobody claims. And the last one takes a number that is now 100 times too big and multiplies it by the exchange rate.
Not one of those five steps threw an error. Every model built. Every task went green.
Your lineage graph draws an edge for all five and stops there. It won’t tell you which of the five finished running this morning. It won’t tell you who owns the job. And it won’t tell you which one is wrong. Five names and a shrug.
Now put tests on all five. These are the kinds of tests TestGen creates:
dim_customer       row_count_vs_7d_avg      count(*) within 20% of the trailing 7-day average
dim_product        referential_integrity    every product_id exists in raw.products
fct_order_items    qty_range                qty between 1 and 500
fct_order_status   freshness                max(updated_at) within 6 hours
fct_daily_revenue  revenue_vs_30d_avg       daily total within 3x the trailing 30-day average
That last one is the alarm in the room that’s burning:
-- fct_daily_revenue: revenue_vs_30d_avg
-- Returns rows = test fails.
select
    order_date,
    sum(order_total) as daily_revenue
from analytics.fct_daily_revenue
where order_date = current_date - 1
group by order_date
having sum(order_total) > 3 * (
    select avg(daily_revenue)
    from analytics.revenue_history
    where order_date between current_date - 31 and current_date - 1
);
Run the suite, and you get an answer instead of a map:
TEST RUN   2026-07-27 06:00 UTC

  dim_customer        row_count_vs_7d_avg      PASS
  dim_product         referential_integrity    PASS
  fct_order_items     qty_range                PASS
  fct_order_status    freshness                PASS
  fct_daily_revenue   revenue_vs_30d_avg       FAIL   4,182,900.00  expected ~41,829.00

  4 passed, 1 failed
That’s the panel lighting up. You know which room is on fire. You go fix the conversion in int_orders_usd, and you tell the other four owners to stand down before they open their own investigations. With the blueprint alone, all five teams search their own tables until somebody gets lucky.
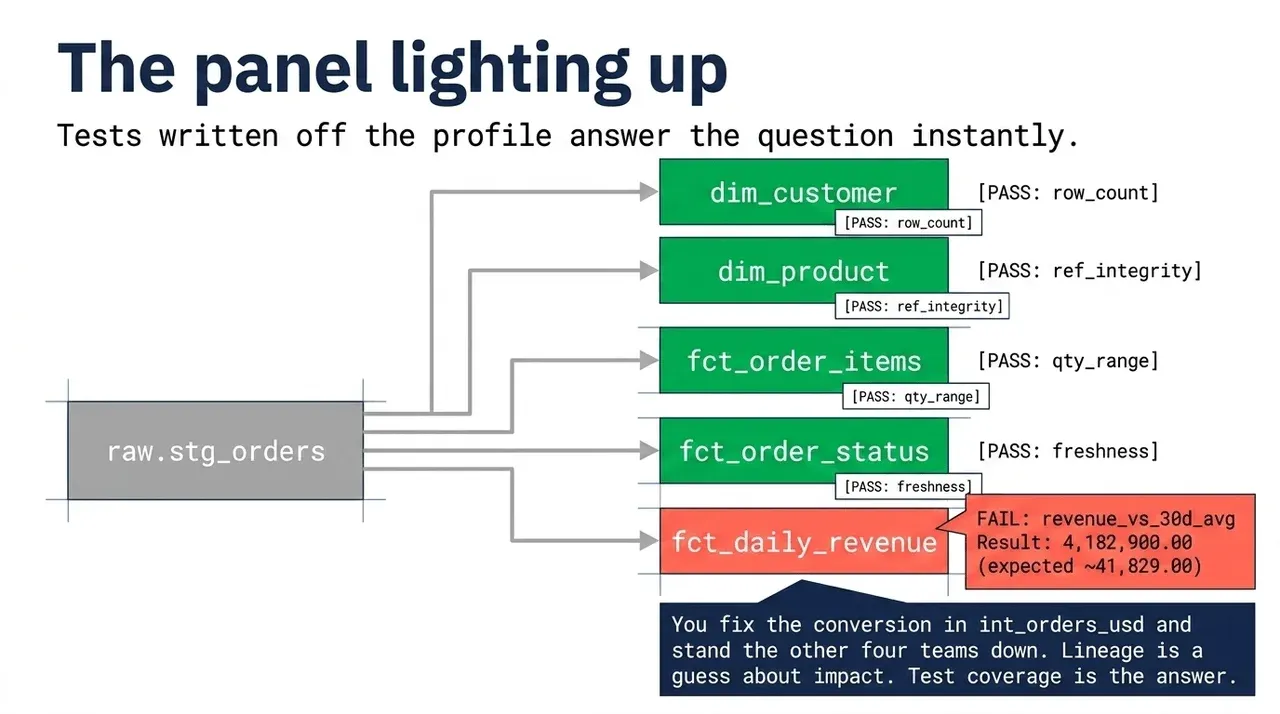
Lineage is a guess about impact. Test coverage is the answer.
Lineage is blind during development
Production isn’t even where lineage disappoints you most. Development is.
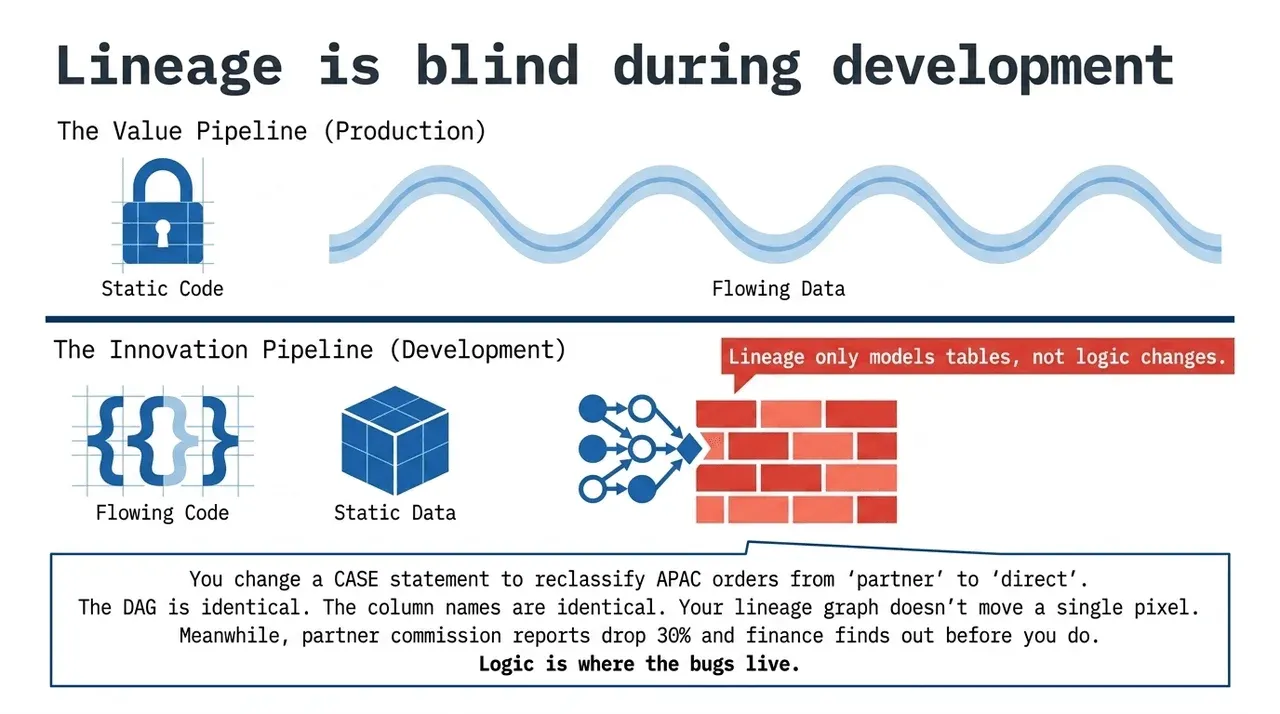
In production, your code is static and your data changes. That’s the Value Pipeline. In development, it’s the reverse: your data is static and your code changes. That’s the Innovation Pipeline, and it’s the one lineage cannot see into at all, because lineage models tables and columns while your changes live in logic.
You change a CASE statement in a dbt model:
-- before
case
    when region_code in ('NA', 'EMEA') then 'direct'
    else 'partner'
end as channel

-- after
case
    when region_code in ('NA', 'EMEA', 'APAC') then 'direct'
    else 'partner'
end as channel
What does your lineage graph show? stg_orders.region_code feeds fct_sales.channel. Same edge before, same edge after. The DAG is identical. Column names are identical. Nothing in the graph moves.
Meanwhile, you just reclassified every APAC order from partner to direct. The partner commission report drops 30%. The sales comp file that goes out Friday is wrong. Finance will find it before you do.
Lineage models the shape of your system. It doesn’t model the logic. Logic is where the bugs are. No software engineer ships to production based on an abstract dependency graph. They run the test suite. Data teams need the same discipline: real test data, real tools, real code, and automated tests that run on every change.
Your AI agent can’t read a lineage graph either
This is where the argument stopped being academic.
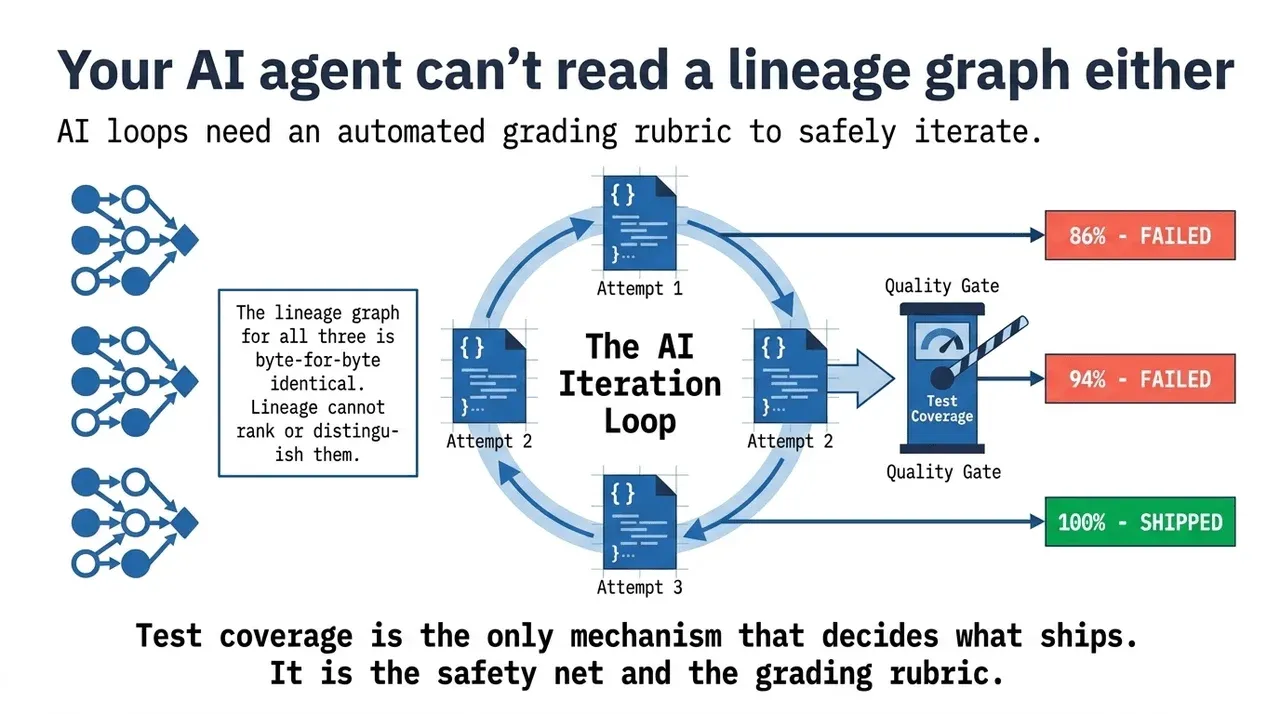
An AI coding agent doesn’t write a transform and hand it over. It writes a solution, runs it, reads the output, works out what broke, and tries again. That loop runs for 20 minutes, an hour, sometimes longer, with nobody watching. We use Claude Code this way every day in our consulting work, and the loop is genuinely fast.
The loop needs one thing to function: a signal for what “correct” means. That signal is your test suite. Without it the agent can’t tell whether it fixed the bug or broke something upstream, and it can’t tell when it’s finished. So it stops and asks you. Every iteration. At which point you’ve bought a very expensive autocomplete.
Here’s the part that ties back to lineage. Picture three isolated branches, three different strategies, three parallel agent sessions, all working from the same brief on one slow SQL transform. They come back like this.
parameterized time window   86%   cross-period consistency check still failing
staging table logic         94%   edge case: partially fulfilled cancelled orders
full rebuild from raw      100%   clean, 8 minute rebuild
Three implementations. One shipped. And the lineage graph for all three is byte-for-byte identical, because they read the same sources and write the same target. Lineage can’t rank them. Lineage can’t even distinguish them. The only thing that separated a transform worth promoting from two worth deleting was the test pass rate.
That’s the whole job now. When an agent can produce three plausible answers in the time you used to spend producing one, your test coverage stops being hygiene and becomes the mechanism that decides what ships. It’s the safety net and the grading rubric at the same time. And you don’t need full coverage to start. Even 50% coverage on your most business-critical transforms changes what you can safely hand off. Buying the graph instead of the tests is one of seven ways AI-generated pipelines break.
The stakes went up too. A schema drift that used to mean one broken report now means an AI system producing confidently wrong answers at whatever rate it can query. The full pattern is here, and none of it works without the tests.
What to build instead
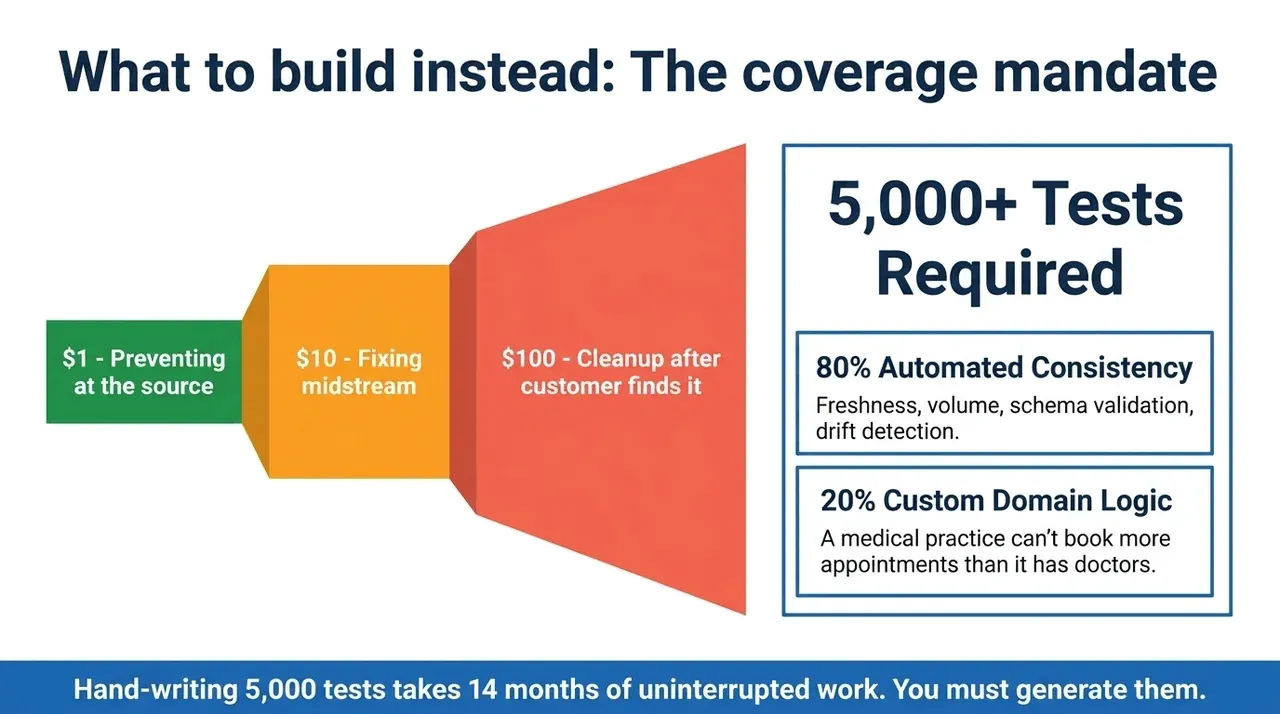
Start with test coverage, and mean it. The rule of thumb is a minimum of two tests per table, two per column, and one custom test per significant business metric. Every tool gets an error log check. Every job gets a status check and a timing check. Apply it at every layer, bronze through gold.
There’s a third approach, which our definitive guide to test coverage calls hope-based testing. Manual inspection and intuition. Somebody eyeballs the row counts on Monday and declares it fine. Most teams are running this one right now and calling it a data quality program.
About 80% of that coverage comes from automated consistency tests: freshness, volume, schema validation, referential integrity, and drift detection that catches gradual statistical shifts a threshold alert would sleep through. The other 20% is domain logic that no tool can infer from your data. A medical practice can’t book more appointments than it has doctors. No shipments go out on restricted days. Revenue lands inside a historically plausible range. That 20% is where your business knowledge becomes a quality gate, and it’s the part you have to write yourself.
Be honest about what each half buys you. Automated anomaly monitors are broad and shallow. They cover far more tables than anyone would hand-craft tests for, and they will also ping you about things that don’t matter until your team starts ignoring the channel. The custom tests are the ones with teeth. Wire them as tripwires that halt processing rather than as alerts somebody reads later.
The economics are not subtle. Preventing a data quality problem at the source costs about $1 per record. Fixing it midstream costs $10. Cleaning it up after a customer finds it costs $100. That ratio is why coverage has to shift left, into development, rather than living as a dashboard somebody checks after the fact.
Do the coverage math on a normal warehouse, and you get somewhere north of 5,000 tests. At 30 minutes each, handwriting them costs about 14 months of uninterrupted work, assuming you take no meetings and never go on vacation. That’s why most teams have 40 tests on their four favorite tables and nothing anywhere else.
Nobody writes 5,000 tests by hand. Generate them.
Then add process lineage
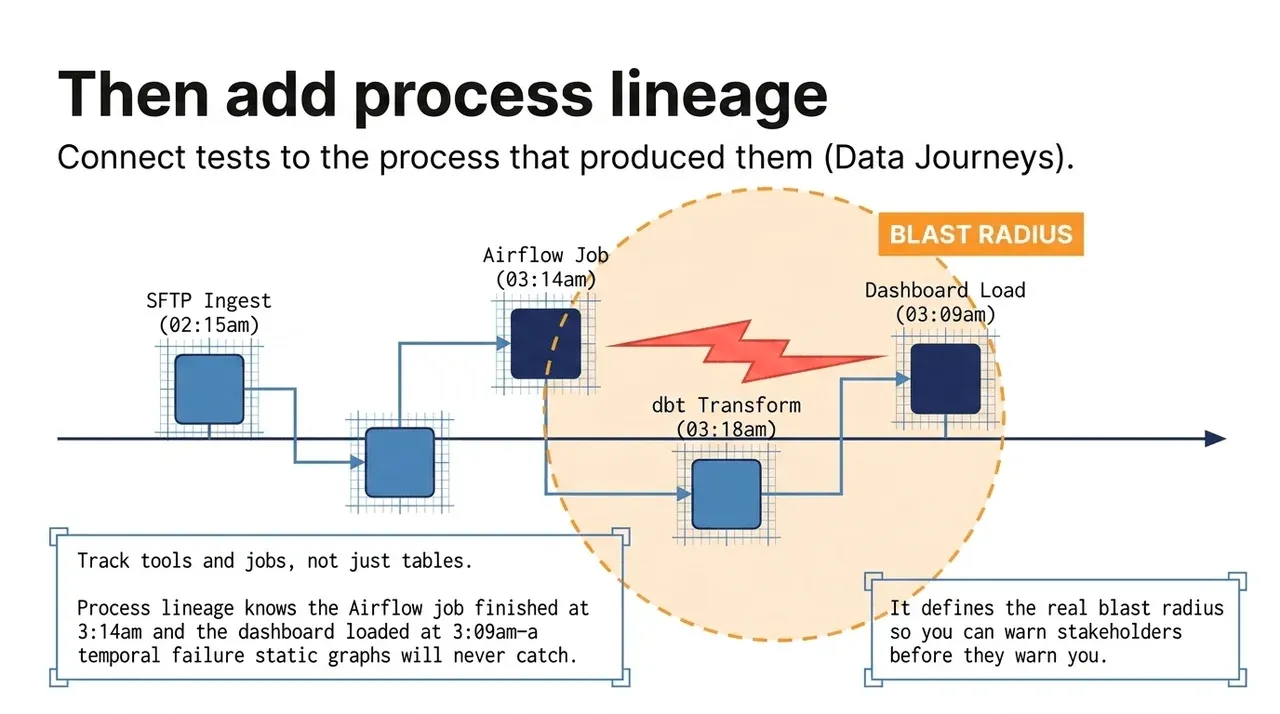
Once tests exist, connect them to the process that produced them. That’s what the five pillars of a Data Journey give you: run-time lineage across every step, down the stack, for data at rest and in use, with expectations set and alerts wired up.
Process lineage tracks the tools and jobs, not just the tables. It knows the Airflow job finished at 3:14am and the dashboard loaded at 3:09am, which is the kind of problem no static graph will ever surface. It also gives you the real blast radius. When an ingested file comes in short, you find out which reports, models, and exports are affected, and you can tell those people before they tell you.
Static lineage tells you which tables touch which tables. Process lineage tells you which tests passed, which broke, and which report went red because of the change you pushed an hour ago. Keep the static version around for the auditors. We wrote more about how the pieces fit together in You complete me, said data lineage to Data Journeys.
Start here
Data test coverage > data lineage
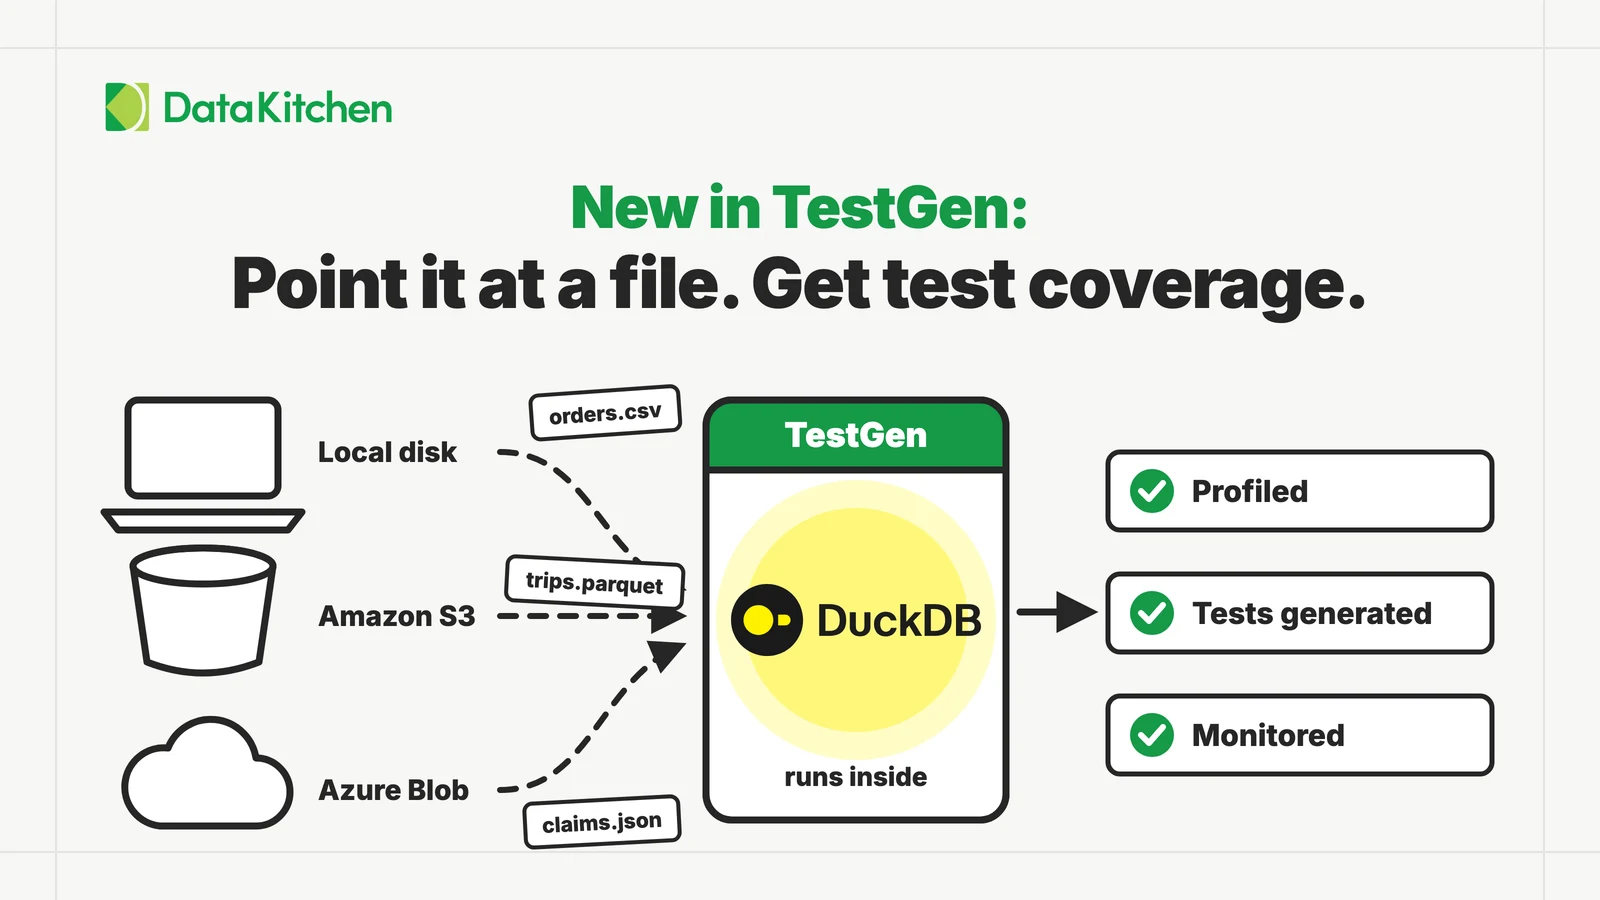
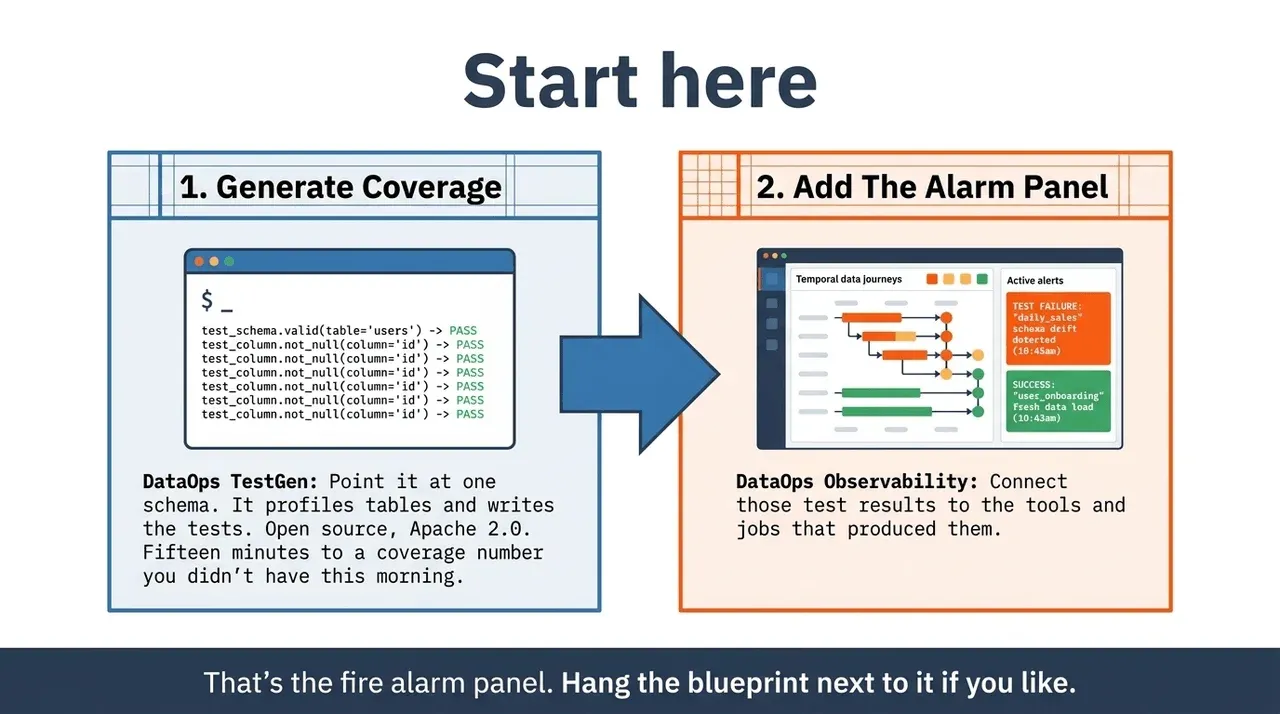
Install the open-source DataOps TestGen and point it at a single schema. It profiles the tables, then writes tests for functional dependency violations, referential integrity gaps, distribution shifts, cardinality surprises, pattern violations, value range problems, type mismatches, and freshness and volume drift. No YAML. It runs on a dozen warehouses including Snowflake, Databricks, Postgres, BigQuery, Redshift, and SQL Server, and it’s Apache 2.0. Fifteen minutes from docker compose up to a coverage number you didn’t have this morning.
Data test coverage + process lineage >> data lineage
Once you have coverage, add DataOps Observability to connect those test results to the tools and jobs that produced them. That’s the fire alarm panel. Hang the blueprint next to it if you like.
TL;DR
Data lineage maps dependencies between tables. It does not detect errors. Four limits: it is built from stale metadata snapshots, it describes flow rather than correctness, it misses tools outside the warehouse (Airflow, dbt, Python, SFTP, BI), and it is unchanged by a logic edit that breaks your numbers. Example: a source sends order_total in cents; lineage flags five downstream tables, and you guess, while tests fail on exactly one. Coverage rule of thumb: two tests per table, two per column, one custom test per business metric, plus error, status, and timing checks on every tool and job. Roughly 80% is auto-generated; 20% is domain logic. Cost per record: $1 at the source, $10 midstream, $100 after a customer finds it. Use lineage for root cause and audit after tests have told you what broke. Tools: DataOps TestGen for coverage, DataOps Observability for process lineage.
FAQ
What are the key points in this blog?
Lineage describes how data flows; tests detect whether it is correct. A lineage graph names five tables downstream of a bad number but cannot say which one is wrong. The post argues for building test coverage first, then adding process lineage for root cause, and lists four specific limits of lineage: stale metadata, description over detection, blind spots outside the warehouse, and no signal on logic changes.
What is the difference between data lineage and test coverage?
Lineage maps dependencies between tables and shows where data came from. Test coverage checks whether the values are correct and fails when they are not. Lineage answers “what is downstream of this table.” Coverage answers “is this number right, and which step broke it.” Only one of those pages you at 2am, and it is not the graph.
Why isn’t data lineage enough for data quality?
Four reasons. Lineage is built from metadata snapshots, so it drifts and describes a warehouse that has been refactored since the last scan. It describes flow rather than correctness. It lives in the database while your data passes through Airflow, dbt, Python scripts, and BI extracts. And a logic edit that breaks your numbers leaves the graph completely unchanged.
When is data lineage actually useful?
For root cause after detection, and for audit. When legal asks where customer PII lives, lineage answers it. When an auditor asks how a regulatory figure was derived, lineage answers it. When a new engineer needs to understand how 300 tables relate, lineage plus a catalog beats reading DDL for a week. It is a good root-cause tool and a poor detection tool.
What is process lineage?
Process lineage tracks the tools and jobs that produced your data rather than just the tables: which Airflow DAG ran, whether the dbt job succeeded, how long each step took. It connects test results to the runs that caused them. Table lineage tells you the blueprint; process lineage plus test results tells you which room is on fire right now.
Where should you start if you have neither?
Start with test coverage, because detection has to come before root cause. Point open-source TestGen at a single schema and let it profile the tables and generate tests for functional dependency violations, referential integrity gaps, distribution shifts, freshness, and volume drift. Once you can detect problems, add process lineage to connect those results to the jobs that produced them.