A DataOps Engineer owns the assembly line that’s used to build a data and analytic product. Data operations (or data production) is a series of pipeline procedures that take raw data, progress through a series of processing and transformation steps, and output finished products in the form of dashboards, predictions, data warehouses or whatever the business requires. We find it helpful to think of data operations as a factory.
Most organizations run the data factory using manual labor. From surveys, we know that data scientists and other data professionals spend over 50% of their time executing procedures supporting data operations.

Figure 1: Ford assembly line, 1913. Source: Wikipedia
Figure 1 is an automobile assembly line in the early 20th century. We see people lined up in a row hand assembling components. Too many data organizations run data operations like a hundred-year-old car factory. While car companies lowered costs using mass production, companies in 2021 put data engineers and data scientists on the assembly line. Imagine if a car company asked the engineers who designed cars to also build them. That’s the state of data analytics today.

Figure 2: Data operations can be conceptualized as a series of automated factory assembly lines.
A DataOps Engineer transforms the picture above to the automated factory below (figure 2). Processes and workflows are highly engineered and automated. Where are the data engineers, scientists and analytics? They aren’t needed on the factory floor. They are in their offices, where they belong, programming the robots and designing new automated procedures for producing continually improved versions of products, i.e., analytics. The DataOps Engineer designs the data assembly line so that data engineers and scientists can produce insight rapidly and with the fewest possible errors. You might say that DataOps Engineers own the pipelines and the overall workflow, whereas data scientists and others work within the pipelines.
What is DataOps
DataOps is a set of practices, cultural norms and architecture patterns that help data professionals deliver value quickly. DataOps enables:
- Rapid experimentation and innovation for the fastest delivery of new insights to customers
- Low error rates
- Collaboration across complex sets of people, technology and environments
- Clear measurement and monitoring of results
DataOps establishes a process hub that automates data production and analytics development workflows so that the data team is more efficient, innovative and less prone to error. In this blog, we’ll explore the role of the DataOps Engineer in driving the data organization to higher levels of productivity. A more technical discussion will follow in the next edition of this blog series.
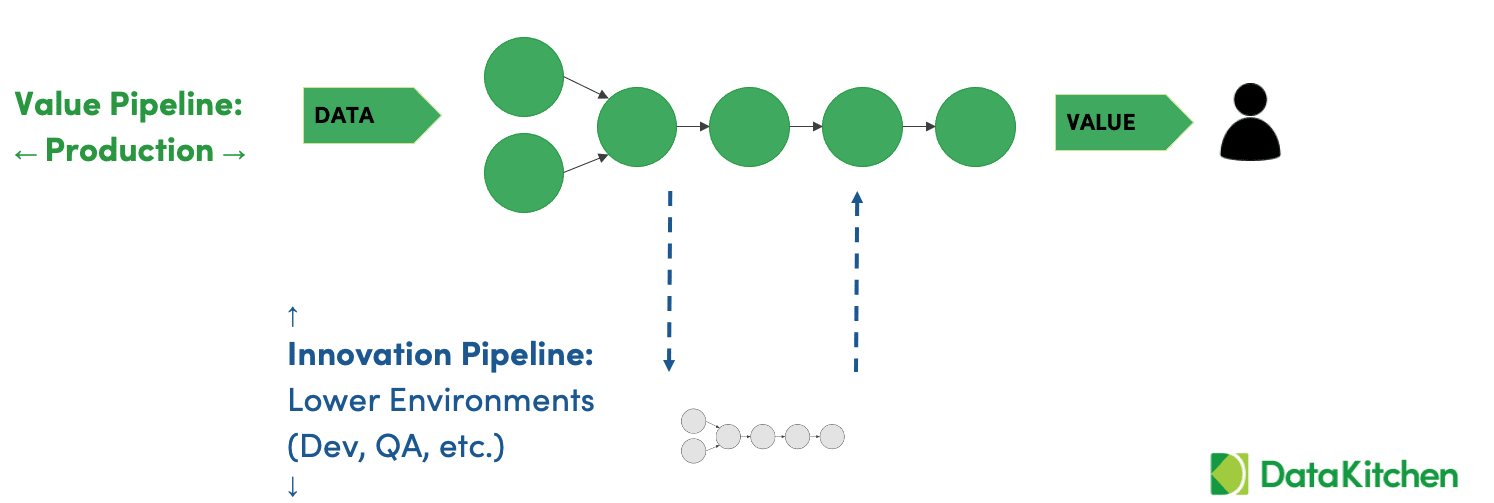
Figure 3: The Value Pipeline (data operations) and the Innovation Pipeline (analytics development)
Automating the Value and Innovation Pipeline
A data pipeline is a series of steps that transform raw data into analytic insights that create value. These pipelines cut across roles and organizations. Steps in the pipeline are represented in figure 3 by circles. Data engineers, scientists, analysts, governance and other data roles work inside the circles or create pipeline segments that are combined with other pipelines.
The Value Pipeline represents data operations where data progresses on its journey to charts, graphs and other analytics which create value for the organization. The Innovation Pipeline includes analytics development, QA, deployment and the rest of the change management processes for the Value Pipeline. Data professionals work at various points in these pipelines. Collectively, we want to be confident that the Value Pipeline is executing without errors, and we want to seamlessly deploy new analytics without breaking anything or creating side effects. The DataOps Engineer makes the whole system work better. The data organization wants to run the Value Pipeline as robustly as a six sigma factory, and it must be able to implement and deploy process improvements as rapidly as a Silicon Valley start-up.
The data engineer builds data transformations. Their product is the data. The data scientist’s products are models and segmentations. The data analyst’s products are charts, graphs and visualizations. In a sense, the DataOps Engineers draw a line around all of these roles and foster greater collaboration among the data team.
When is a Task “Done”
Many people who work with data have a narrow definition of being “done.” Let’s say a person is building a bunch of SQL or a Jupyter notebook. They complete their work and throw it over the wall with pride. They are “done,” right?
The narrow definition of “done” used by many data professionals is that it worked in a specific environment, without knowing or caring about the challenges of the people who have to deploy, monitor and maintain that component. Such a willfully blind data professional is task-focused, not value-focused. Collaboration will be difficult if you notice the following practices among the data team:
- Throw it over to production – let them figure it out
- Definition of “done” means “it worked for me”
- “I only focus on my little part”
- “Someone else’s problem”
- Willful blindness
- Task – not value – focused
- Project – not product –focused
- “Hope that it works”
- Reliance on manual checks
- Lack of willingness to pull the pain forward
DataOps takes a broader view. “Done” means the component works in production and customers/users are happy with it. Instead of focusing on a narrowly defined task with minimal testing and feedback, DataOps focuses on adding value. Through automated testing, DataOps institutionalizes collaboration through orchestrated testing, monitoring, deployment and task coordination (figure 4).
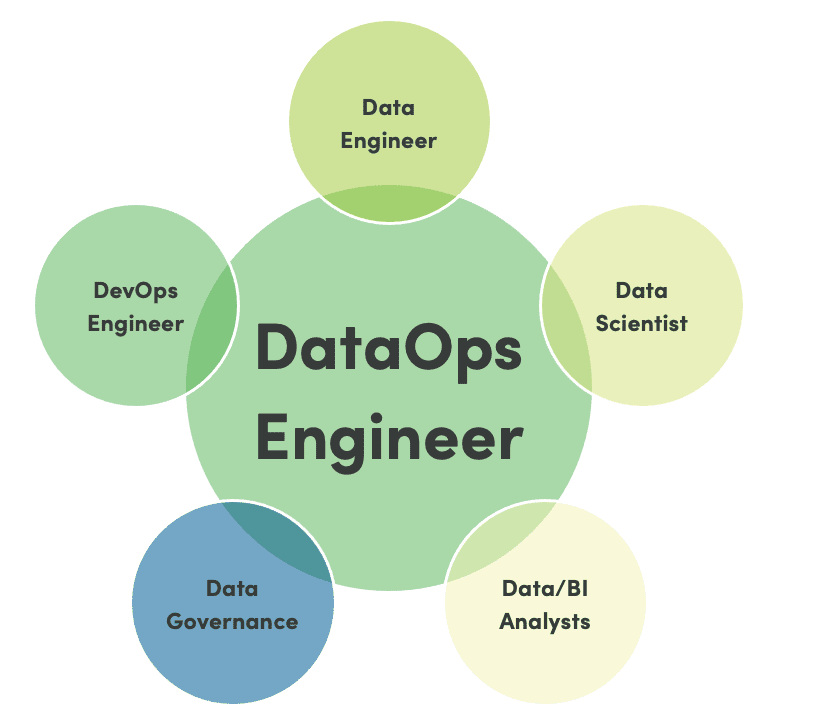
Figure 4: The DataOps Engineer facilitates collaboration among the data team.
Orchestrating Nuggets
Data scientists and analysts create, what we call, nuggets of code. Nuggets could be ETL code that drives an Informatica job, a SQL transformation, some Python or perhaps XML. No matter its consistency or purpose, nuggets must be thoroughly tested before being inserted into larger assemblies (pipelines). Below are examples of the ways that DataOps Engineers work with “nuggets” of code within a DataOps system:
- Add to pipelines
- Create tests
- Run the factory
- Automate deploys
- Work across people
- Measure success
- Enable DataOps self-services
DataOps Engineers are not usually solving data problems by creating the nuggets. They are solving process problems by using automation to test, deploy and maintain the nuggets in a system context. By automating the housekeeping related to nuggets, DataOps Engineers enable nugget creators to work more quickly and iteratively.
DataOps is applying automation to streamline workflows. As a general rule, any operation that is performed manually three times should be automated. The DataOps Engineer creates these automated orchestrations and meta-orchestrations. Below are some common examples of DataOps automation:
- Production orchestration – replace manual procedures that execute data operations with automated orchestrations and meta-orchestrations
- Production data monitoring/testing – create tests so you catch errors before your customers see them, monitor your production and development pipelines in real-time
- Self-service environments – give the data team a way to create on-demand development sandboxes with data and toolchains aligned with production
- Development regression and functional tests – automate development and deployment testing
- Test data automation – create test data for development on-demand
- Deployment automation – deploy with minimal keyboarding
- Shared components – standardize and reuse commonly used “nuggets” and pipelines and horizontal infrastructure
- Process measurement – construct dashboards on every aspect of the data lifecycle for unprecedented process transparency
DataOps Engineering is about taking these invisible processes and making them highly visible through an automated, shared abstraction. DataOps pulls the discovery of errors forward so they can be addressed early and never corrupt user analytics and dashboards.
The DataOps Engineer First Step: Observe The Data Journey
In the data world, we focus a lot on the data. If the data in your database needs to be corrected, has been transformed with errors, or is not clearly understood, then using that data will be a problem. However, you have many data tools in front of that database and behind that database: Talend, Azure Data Factory, DataBricks, Custom Tools, Custom Testing Tools, ETL Tools, Orchestrators, Data Science Tools, Dashboard Tools, bucket stores, servers, etc. Those tools work together to take data from its source and deliver it to your customers.
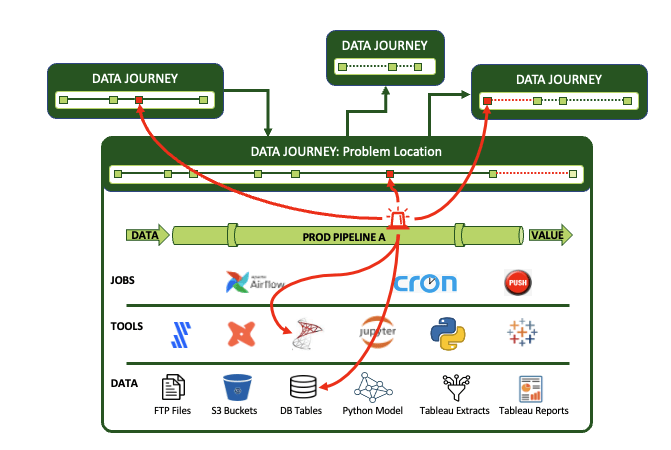
That set of multi-tool set of expectations is a ‘Data Journey. The Data Journey concept is about observing, not changing, your existing data estate. Data Journeys track and monitor all levels of the data stack, from data to tools to servers to code to tests across all critical dimensions. It supplies real-time statuses and alerts on start times, processing durations, test results, costs, and infrastructure events, among other metrics. With this information, you can know if everything ran on time and without errors and immediately detect the parts that didn’t.
The Challenges of Automation
The challenges of implementing data automation mirror some of the difficulties that we’ve reviewed above:
- No owner
- Not enough time spent on automation
- No one seems to care
- Everyone focused on tasks at hand instead of building better processes
- Perception that automation work is less prestigious than data work
- Unlike software dev, data can’t be automated
- Manual work is the way we have always done it
When a task like automation is not recognized as important, no one takes responsibility for it. In many data organizations, there is a view that being a data scientist is the highest form of contribution. Given the impact of automation on team productivity, it should come as no surprise that top DevOps Engineers are some of the most highly compensated individuals in the software industry. We’ve come a long way from the era in which release engineers were considered second-class citizens.
The DataOps Engineer Second Step: Automate
The goal of the DataOps Engineer is to automate the organization’s processes:
- Reduce waste.
- Promote reuse. Prevent “reinventing of the wheel.”
- Lower errors and mean time to failure.
- Promote version control.
- Highlight gaps and improve testing.
- Ensure data security standards are applied to pipelines.
- Make reports on every aspect of the data team’s processes and the data lifecycle.
The DataOps Engineer is a cousin of the DevOps Engineer but with familiarity with data ecosystem tools and methods. What’s great and challenging about the role is that it requires several different skills in a wide range of domains. The skillset for a DataOps Engineer is as follows:
- A Scripting Language: Python, Bash
- Data Language: SQL
- Source Code Control: git
- DataOps Tool: DataKitchen
- DevOps Configuration Tool: Terraform, Puppet, Docker/K8s
- Process Skills: Agile methods & tools like JIRA
- Familiarity with the toolchain your data engineers, scientists, analysts and governance team use
As a manager or team leader, you may be wondering whether you neDataOps-type DataOps Engineer and how much of your team’s resources need to be devoted to DataOps. There is no one right answer that fits all organizations. Cutting-edge software development teams spend about 23% of their time on DevOps. Data teams currently spend about 3% of their time on DataOps type tasks. We recommend increasing this level to about 15%. That could be achieved by involving everyone or by hiring a dedicated resource. The point is that investment in DataOps will pay back big time.
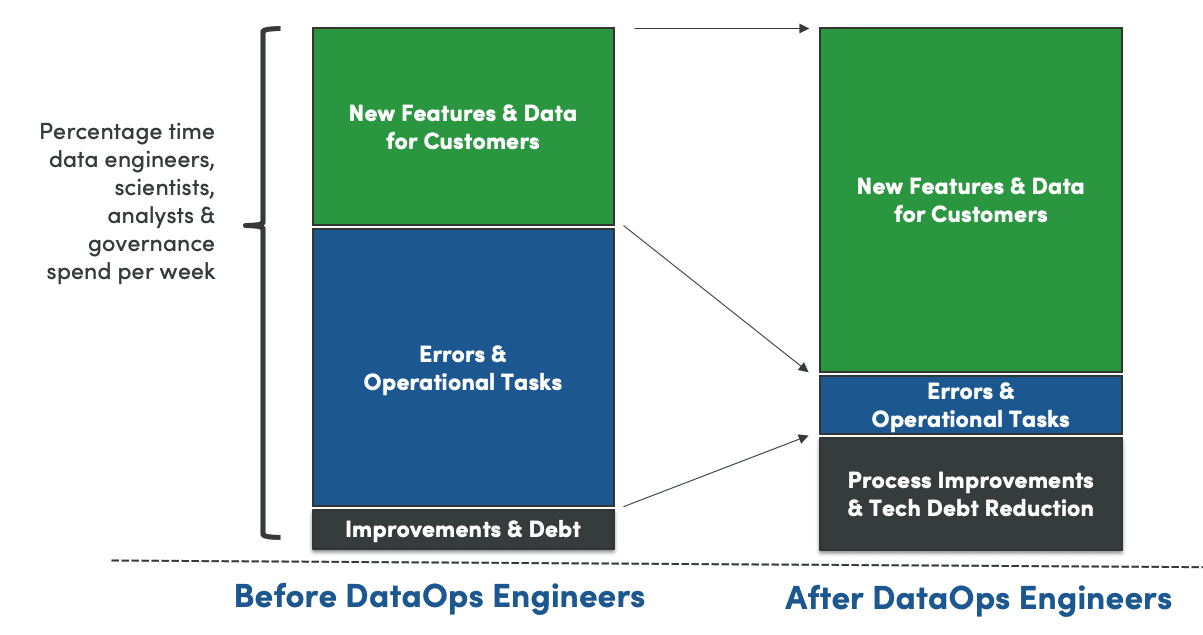
Figure 5: Time allocation before and after DataOps
The investment in DataOps impacts the whole team (figure 5). With DataOps, data engineers, scientists, analysts, and self-service users spend more time creating value, reducing technical debt or deploying changes to production, and less time chasing errors, sitting in meetings, and managing issues.
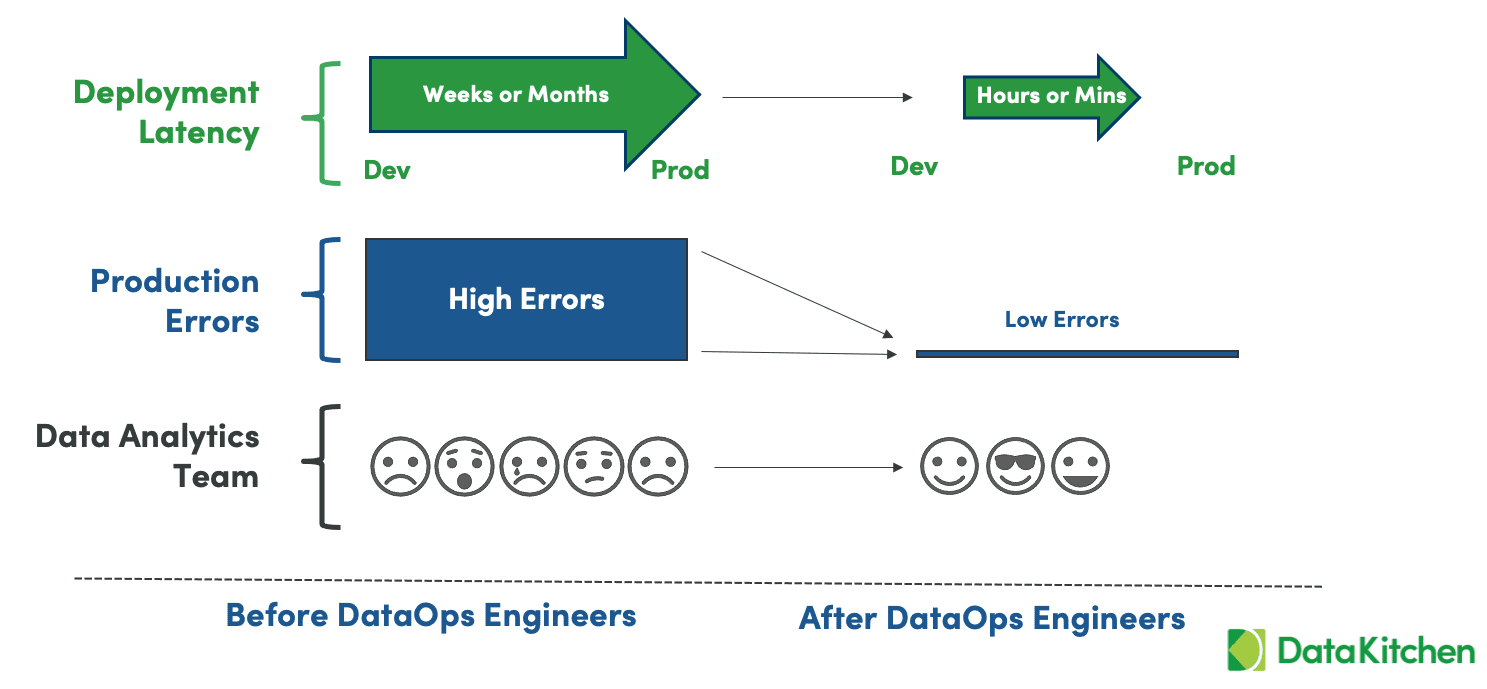
Figure 6: DataOps reduces cycle time and eliminates errors, making for a happier data analytics team.
The bottom line metrics that DataOps impacts are deployment latency and errors (figure 6). DataOps slashes deployment cycle time from weeks/months to hours/minutes. It reduces the high rate of data errors present in most data organizations to virtually zero. When productivity is high, errors are low, and users are happy, the work environment for the data team is much more enjoyable. It may sound cliche, but DataOps puts the fun back in data analytics and smiles on the faces of the data team.
In our next blog on DataOps Engineers, we’ll further explore the DataOps Engineering skillset and demonstrate steps and considerations related to implementing a DataOps Project, including automated tests, reusable code, managing environments, monitoring, and DataOps reporting.
To learn more about DataOps we recommend the following resources:
- Sign The DataOps Manifesto
- Read out the Free E-book: The DataOps Cookbook
- Also, our Second Free E-book: Recipes for DataOps Success
- Data Journey Manifesto
- Why the Data Journey Manifesto?
- Five Pillars of Data Journeys
- Data Journey First DataOps