
Introduction
Research shows that the climate of an organization influences an individual’s contribution far more than the individual himself [or herself].
— W. Edwards Deming
DataOps reenvisions how data analytics are conceived, created, deployed, supported, maintained and monitored. It removes the barriers that previously isolated users, data scientists and data operations from each other. DataOps represents nothing less than a transformational change that permeates the data and analytics teams.
As a career data professional, you may find it fairly straightforward to wrap your mind around the tools that implement DataOps. However, leading a DataOps initiative is about more than technologies and workflows. DataOps champions are leading cultural change, which also involves overcoming skepticism.
A DataOps champion may encounter resistance to change in the form of conflicting incentives, entrenched culture and a lack of buy-in. An organization may be hierarchical and silo’ed, but data cuts across teams, locations, and data centers. Major changes in data-analytics methodologies and workflows are bound to infringe upon existing norms.
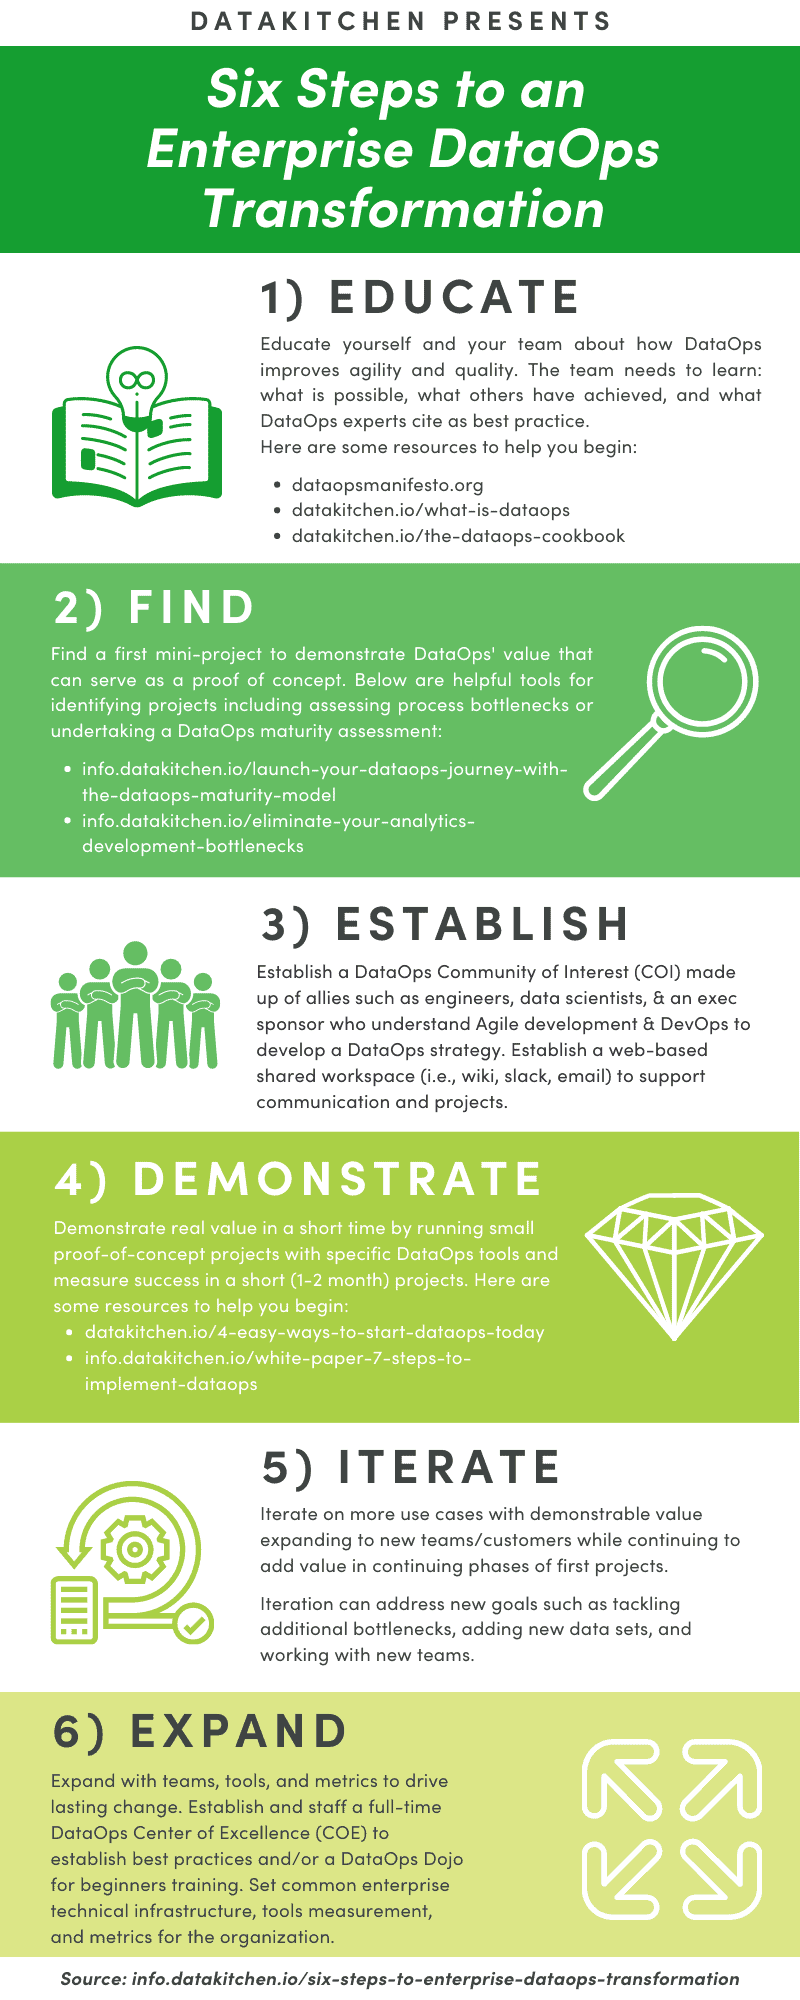
We have watched organizations implement DataOps using a variety of approaches. The most successful transitions to DataOps address both technical and human factors. Successful DataOps programs follow a gradual and methodical approach that establishes a beachhead with a first project, recruits allies and builds value iteratively. We summarize our recommended process for DataOps Enterprise Transformation in the six steps below.
| Step | Goal | What | Tools and tasks |
|---|---|---|---|
| 1. Educate | Educate on the ideas of DataOps | Best-practice presentations, video, books, analyst writing and discussions | ”Art of the Possible With DataOps”; the DataOps Cookbook |
| 2. Find | Find a first project to demonstrate value | Discussions and ‘therapy’ with individual teams, guided toward finding pain | In-depth discussions; the DataOps Maturity Model |
| 3. Establish | Establish a community of interest in DataOps | Create a resource center and a community of interest; align with data and Agile leaders in the organization | Establish web-based sharing sites: wiki, Slack, email |
| 4. Demonstrate | Demonstrate real value in a short time | Run small concept-proving projects with specific DataOps tools, and measure success within a short project of a month or two | Run pilots with DataKitchen DataOps software and others |
| 5. Iterate | Iterate on more use cases with demonstrable value | Expand to new teams and projects; continue to add value in later phases of the first demonstration projects | Iteratively deliver value, expand the pilots, and find new internal customers |
| 6. Expand | Expand with teams, tools and metrics to drive lasting change | Establish and staff a full-time Center of Excellence or Dojo; set common enterprise technical infrastructure, tools, measurements and metrics for the organization | Build the Dojo or COE team, establish best practices, work across the organization |
NOTE
For a more detailed overview of DataOps itself, see What is DataOps?
Step 1: Educate
DataOps introduces new methodologies, supported by tools automation, that shortens data-analytics cycle time, improves collaboration, virtually eliminates errors and provides unprecedented transparency into data operations. DataOps can support your current toolchain or ease migration to new tools and technologies.
The best way to begin a transition to DataOps is by educating yourself and your team about how DataOps improves agility and quality. The team needs to learn: what is possible, what other enterprises have achieved, and what DataOps experts cite as best practice. Fortunately, there are many resources to assist you:
- DataOps: The Questions Teams Ask Before They Start
- The Seven Steps of DataOps
- The DataOps Cookbook
- DataOps YouTube Channel
- DataKitchen DataOps Webinars
- The DataOps Manifesto
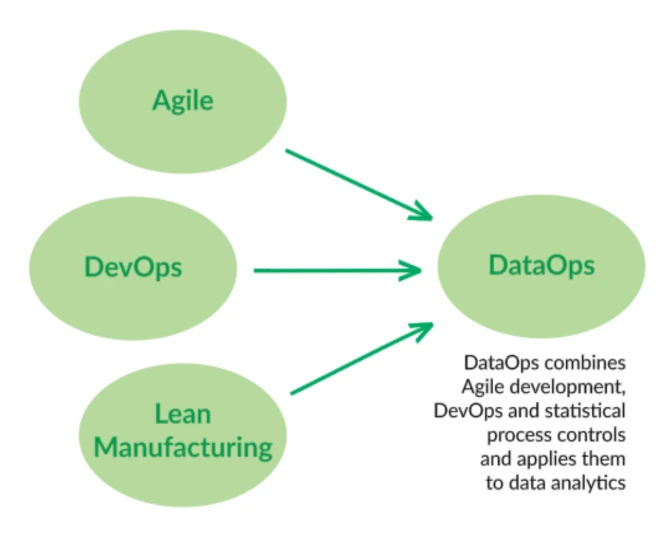
Your investment in DataOps education should stimulate your vision of improving your organization’s workflows by applying DataOps principles. Nothing is more effective at proving DataOps’ potential impact than a mini-project.
Step 2: Find
A mini or pilot project can serve as a proof of concept for potential DataOps benefits. Choose your first project in consultation with your team and, if possible, an executive sponsor. Ideally, it should demonstrate meaningful improvement in a key performance parameter. Ideally, a first project leads to a quick win. A shorter schedule is eminently preferable to an extended development effort. That’s not to say that you have to get it perfect in one shot. Iterated improvements demonstrate how value builds by using Agile development. If you can’t decide where to begin, our DataOps Maturity Model may be helpful.
Measure DataOps Maturity
The DataOps Maturity Model can help organizations understand their DataOps strengths and weaknesses. Maturity models are commonly used to measure an organization’s ability to improve in a particular discipline continuously. DataKitchen’s DataOps Maturity Model outlines a measurement approach for building, monitoring, and deploying data and analytics according to DataOps principles. With this model, teams can understand where they are today and how to move up the curve of DataOps excellence.
DataOps employs automated orchestration to simplify complex toolchains, environments, and team collaboration, so that the data team can quickly and continuously deliver high quality, error-free insight. To implement DataOps, organizations need to prioritize improvements in the six areas shown below.
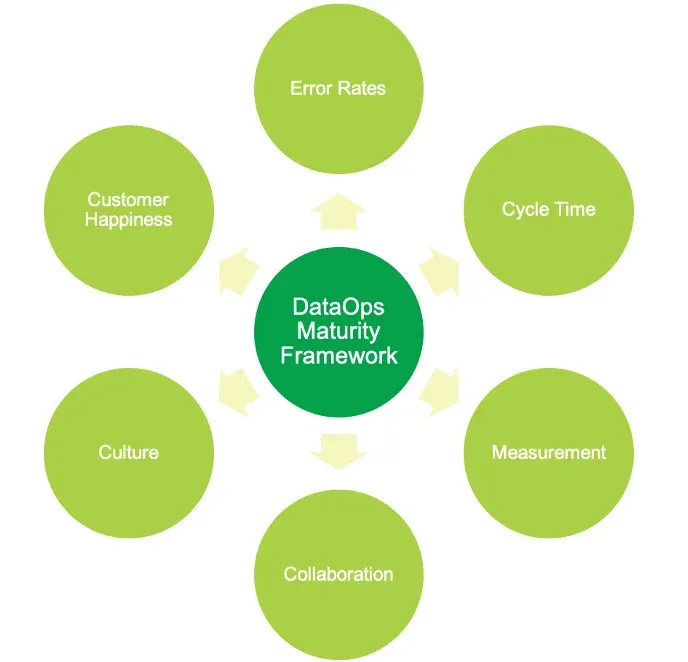
Improve these areas by implementing core DataOps capabilities such as automated testing and monitoring, toolchain orchestration, version control, sandbox creation and management, and continuous deployment. Many DataOps capabilities relieve bottlenecks in workflow processes.
Eliminating Bottlenecks
Most data teams are interested in DataOps because they seek to accelerate the creation and deployment of new data analytics (data, models, transformation, visualizations) without introducing errors. Reducing project cycle time or eliminating errors are both excellent starting points. Errors are a major source of unplanned work, which is a bottleneck that limits the throughput of the overall system. To minimize errors, start tracking errors and form a quality circle to explore root causes. Add tests to your data operations pipelines and continuous deployment pipelines so that your data team can address errors before they affect users.
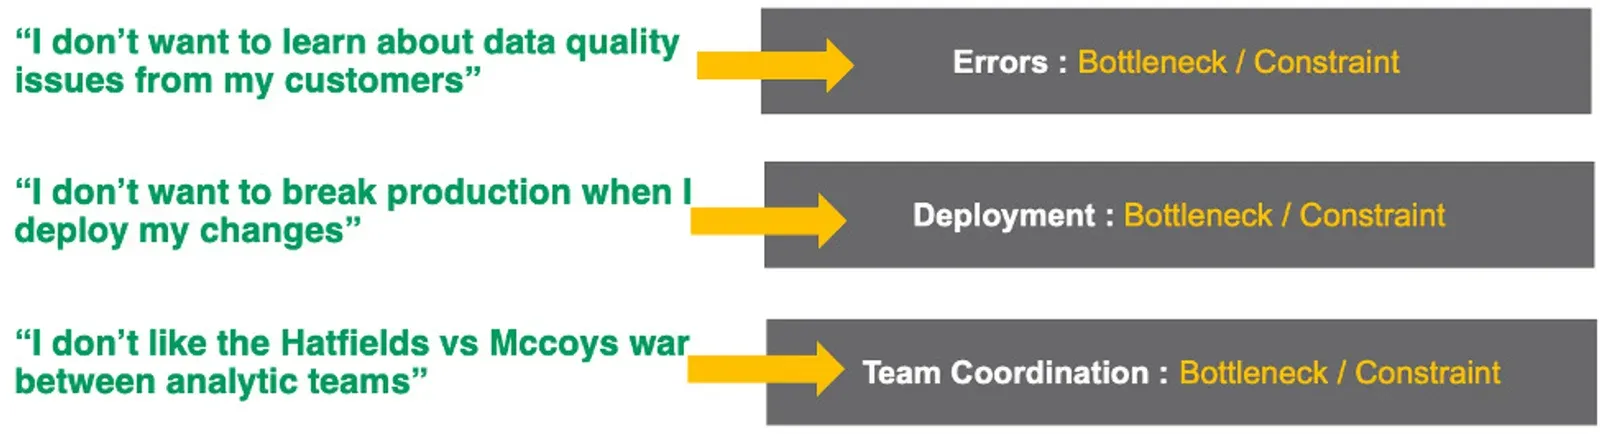
To reduce project cycle time, study and measure the workflow processes from the inception of an analytics requirement to the delivery of published analytics. Every workflow process includes constraints and bottlenecks. Improve overall cycle time by mitigating these constraints in your development processes.
One approach that we recommend involves using the Theory of Constraints to alleviate your workflow bottlenecks. A bottleneck is a step in your end-to-end lifecycle process that acts as a constraint on the overall throughput of the entire system. For example, waiting six weeks for approval from an impact review board severely constrains agility. A data organization’s bottlenecks often leave the following telltale signs:
- Work in Progress (WIP): In a manufacturing flow, work in progress usually accumulates on an input queue feeding into a constraint. In data analytics, you may notice a growing list of requests for a scarce resource. For example, if it takes 20 weeks to provision a development system, your list of requests for them is likely to be long.
- Expedite: Look for areas where you are regularly diverting resources to ensure that critical analytics reach users. In data analytics, data errors are a common source of unplanned work.
- Cycle Time: Pay attention to the steps in your process with the longest cycle time. Naturally, if a process step is starved or blocked by a dependency, the bottleneck is the external factor. If it takes months to receive data sets from the central IT department, work with them to set up a regular, automated feed into a locally controlled data lake.
- Demand: Note steps in your pipeline or process that are simply not keeping up with demand. For example, often, less time is required to create new analytics than to test and validate them in preparation for deployment. This disparity can be addressed using DevOps techniques.
TIP
Install Open Source DataOps TestGen to start measuring the error bottleneck on a real database this week, instead of hand-coding a first test suite.
Whatever your choice of projects, invest in activities that will garner support and demonstrate how DataOps produces measurable results.
DataKitchen DataOps Automation and other DataOps tools can play a critical role in shortening the cycle time of your DataOps model project. A DataOps Platform is purpose-built to augment an existing toolchain with DataOps automation. It can help you hit the ground running.
Step 3: Establish
Many DataOps transformations start with a small number of contributors who serve as the core team. As excitement grows, you will find that your more established team will need more structure to keep everyone rowing in the same direction. Here are some ways you can support and encourage your team’s growth:
- Community of interest: Find allies and cultivate a community of interest (COI) around DataOps methods and automation. One ready-made resource is the group of engineers and data scientists who understand Agile development and DevOps. These folks will understand the power of process improvement to boost productivity and quality in software development and data analytics. DataOps communities often come alive with palpable energy as DataOps benefits win over converts.
- Executive sponsor: A C-level sponsor can tie the project’s activities into the larger organization’s strategic goals. An executive can explain the value to others and provide guidance as the project team faces obstacles or grapples with trade-offs. The executive sponsor provides resources and budget as a skunkworks matures into an official project. With support from data science or engineering managers, you can gain approval for your COI to devote part or all of their time to DataOps officially.
- DataOps strategy: A DataOps strategy keeps everyone on the same page. As your team grows beyond its core members, a written strategy empowers everyone to contribute their creativity. If your DataOps initiative has specific initial goals, a strategy clearly communicates them to the team.
- Shared workspace: A shared workspace and communication channels help the team interact around tasks and builds a shared identity. Some teams have a physical space, but others are entirely virtual. Your DataOps COI may benefit from collaboration tools such as a Wiki, Slack channel or an email list. With a budget, you can establish a resource center to support your DataOps projects.
- Build value: DataOps is an iterative process that builds value using automation. Everyone who works on your DataOps initiative should be helping to create or enhance the value-creation machine. If that machine runs 24x7, it creates value long after the data scientists and programmers have deployed their solutions. For example, tests that ensure data quality keep creating value as new data flows through the data-analytics pipelines.
The value that DataOps builds should manifest in tangible improvements. Demonstrate the benefits of DataOps, and win converts, using metrics.
Step 4: Demonstrate
DataOps will deliver an unprecedented level of transparency into your operations and analytics development. DataOps automated orchestration provides an opportunity to collect and display metrics on all of the activities related to analytics. Why not use DataOps analytics to shine a light on the benefits of DataOps itself?
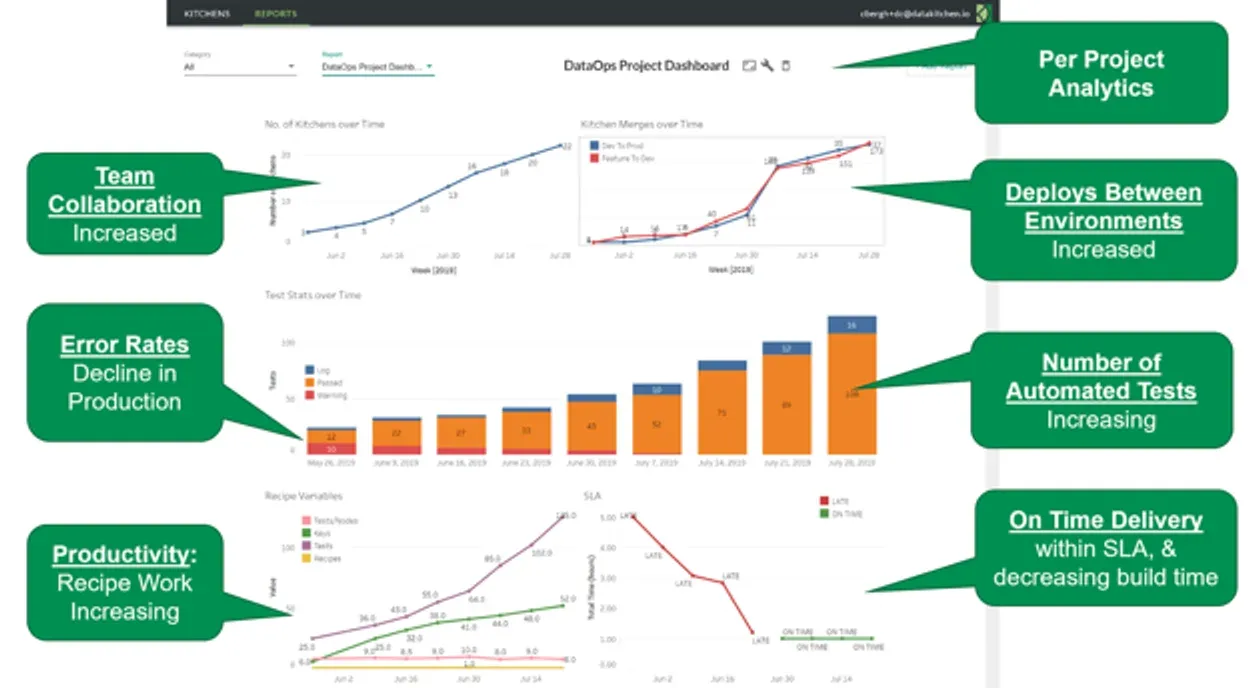
The dashboard above shows a typical set of DataOps metrics, covering team collaboration, error rates, productivity, deployments, tests, and delivery time. Those metrics might benefit from a short explanation:
- Team Collaboration: Measure teamwork by the creation of virtual workspaces, also known as “Kitchens.” Each Kitchen creation corresponds to a new project or sub-project in a team context.
- Error rates: The graph shows production warnings at a rate of 10 per week, falling to virtually zero. This reduction in errors is the positive result of the 100+ tests that are now operating 24x7 checking data, ETL, processing results, and business logic. As the number of tests increases, the data pipeline falls under increasingly robust quality controls.
- Productivity: Measure team productivity by the number of tests and analytics created. The rise in “keys” (steps in data pipelines) coupled with the increase in test coverage shows a thriving development team. Also, the number of Kitchen merges at the top right shows the completion of projects or sub-projects. The “Feature to Dev” metric shows new analytics ready for release. “Dev to Prod” merges represent deployments to production (data operations).
- On-time Delivery: Mean deployment cycle time falls sharply, meeting the target service level agreement (SLA).
Choose your metrics to reflect your DataOps project objectives. The metric gives the entire team a goal to rally around. The number of possible DataOps metrics is as varied as the architectures that enterprises use to produce analytics. When your team focuses on a metric and iterates on it, you’ll see significant improvements in each sprint.
Step 5: Iterate
In Agile Software Development, the team and its processes and tools are organized around publishing releases to the users every few weeks (or at most every few months). A development cycle is called an iteration (or a sprint). At the beginning of an iteration, the team commits to completing working and valuable changes to the code base. With iterations occurring at short intervals, the organization can continuously reassess its priorities and incorporate them into future iterations. This method allows the development team to adapt to changing requirements more easily. Each iteration adds value, so the final product is continually improved.
In an increasingly competitive marketplace, Agile methods allow companies to become more responsive to customer requirements and accelerate time to market. Agile also improves ROI by monetizing features with each iteration instead of waiting months for a big release. Unlike classic software development, agile projects build value with each iteration. In DataOps, iterations build upon each other, so value grows over time.
While initial iterations may have focused on one project, demonstration of success encourages a DataOps team to broaden its scope. Iterations can address new goals: tackling additional bottlenecks, adding new data sets, and working with new teams.
Step 6: Expand
As your DataOps initiative grows beyond the early stages, you will expand to incorporate more staff, resources, and a broader scope. One best practice incorporates DataOps into the organization chart. A sign of DataOps maturity is building a common technical infrastructure and tools for DataOps using centralized teams. It’s also important to establish enterprise-wide measurements and metrics. Work with other teams throughout the organization to bring DataOps benefits to every corner of the enterprise.
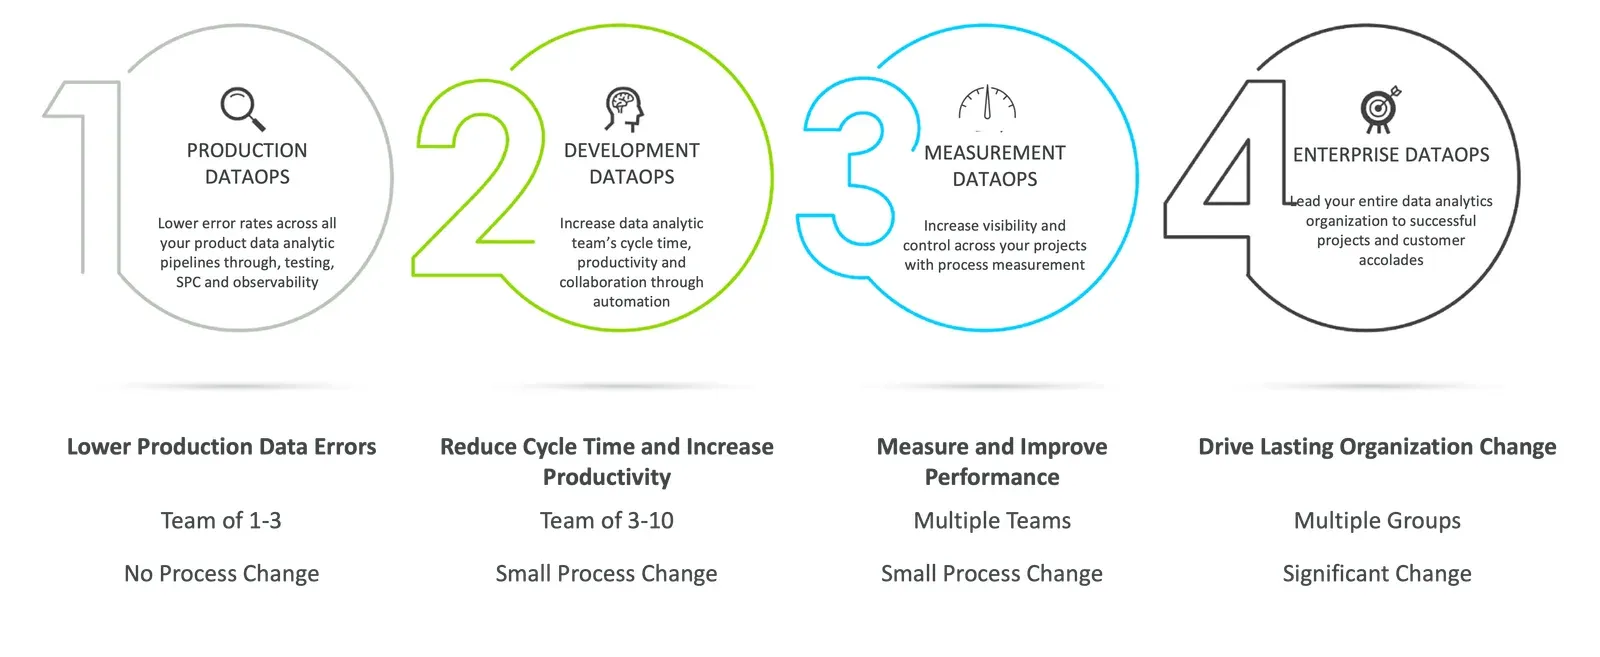
DataOps Technical Services
One approach standardizes a set of software services that support the rollout of Agile and DataOps. The DataOps Technical Services (DTS) group provides a set of central services leveraged by other groups. Examples of technologies that can be delivered ‘as a service’ include:
- Source code control repository
- Agile ticketing and Kanban tools
- Deploy to production
- Product monitoring
- Develop and execute regression testing
- Development sandboxes
- Collaboration and training portals and wikis
- Test data management and other functions provided ‘as a service’
The DTS group can also act as a services organization, offering services to other teams. Below are some examples of services that a DTS group can provide:
- Reusable deployment services that integrate, deliver and deploy end-to-end analytic pipelines to production.
- Central code repository where all data engineering, science and analytic work can be tracked, reviewed and shared.
- Central DataOps process measurement function with reports.
- ‘Mission Control’ for data-production metrics and data-team development metrics, to demonstrate progress on the DataOps transformation.
Another important tool employed by maturing DataOps organizations helps train practitioners in DataOps methods and best practices so they can return to their team and lead local DataOps efforts.
A DataOps Center of Excellence
The Center of Excellence (COE) model leverages the DataOps team to solve real-world challenges. The goal of a COE is to take a large, widespread, deep-rooted organizational problem and solve it in a smaller scope, proof-of-concept project, using an open-minded approach. The COE then attempts to leverage small wins across the larger organization at scale.
A COE typically has a full-time staff that focuses on delivering value for customers in an experimentation-driven, iterative, result-oriented, customer-focused way. COE teams try to show what “good” looks like by establishing common technical standards and best practice. They also can provide education and training enterprise-wide. The COE approach is used in many enterprises, but the DevOps industry has more often standardized on Dojos as a best practice.
A DataOps Dojo
A DataOps Dojo is a place where DataOps beginners go for a short period of intense, hands-on training. In Japan, a dojo is a safe environment where someone can practice new skills, such as martial arts. Companies like Target employ the Dojo concept effectively to build lean, Agile and DevOps muscles. The Dojo offers a separate workspace where teams learn new skills while working on actual projects that deliver customer value.
Dojos provide an environment where teams gain practical experience without worrying about introducing errors into the production environment. The staff rotates in for weeks or months at a time to learn new skills by working on real-world projects. They then bring those skills and ideas back to their original teams.
Championing DataOps
DataOps can serve as a positive agent of change in an otherwise slow and process-heavy organization. Remember that leading change in technical organizations is equal parts people, technology and processes. DataOps offers the potential to reinvigorate data team productivity and agility while improving quality and predictability. Our six-step program should help you introduce and establish DataOps in your data organization. In our experience, many data organizations desperately need the benefits that DataOps offers. They need people to champion a DataOps initiative. Can your organization count on you?
If you want help running the program rather than reading about it, DataKitchen’s DataOps consulting, coaching and transformation service supports and leads enterprise DataOps transformations. Or just contact us.
Related Reading
- 7 Steps to Implement DataOps — the technical practices this program rolls out
- Reducing Organizational Complexity with DataOps — why the org chart, not the toolchain, is usually the constraint
- Warring Tribes into Winning Teams — the teamwork problem step 3 exists to solve
- How to Get Started with DataOps — real first projects, chosen by bottleneck
- Start DataOps Today with ‘Lean DataOps’ — the four-phase version of the same expansion path
FAQ
What is the main point of this paper?
An enterprise DataOps transformation is a cultural change as much as a technical one, and it succeeds when it is run gradually in six steps: educate the team on DataOps, find a first project that demonstrates value, establish a community of interest, demonstrate real value with metrics, iterate on more use cases, and expand with teams, tools, and metrics that make the change last.
What are the six steps of an enterprise DataOps transformation?
Educate on the ideas of DataOps. Find a first project that can demonstrate value. Establish a community of interest around DataOps methods. Demonstrate real value in a short time using metrics. Iterate on more use cases with demonstrable value. Expand with teams, tools, and metrics to drive lasting change. Each step recruits more of the organization than the last.
How do you educate a team about DataOps?
Start with what is possible, what other enterprises have achieved, and what DataOps experts cite as best practice. Best-practice presentations, video, books, analyst writing, and discussion all work. The DataOps Cookbook, the DataOps Manifesto, recorded webinars, and the What Is DataOps? explainer are the resources this paper points teams at first.
How do you choose a first DataOps project?
Choose it with your team and, if possible, an executive sponsor. It should demonstrate meaningful improvement in one key performance parameter and lead to a quick win. A shorter schedule is far preferable to an extended development effort. You do not have to get it perfect in one shot, because iterated improvements are what show how value builds.
What are the six dimensions of DataOps maturity?
Error rates, cycle time, measurement, collaboration, culture, and customer happiness. A maturity model measures an organization’s ability to improve continuously in a discipline, so these six dimensions give a team a way to see where it stands today and which weakness to attack first on the way up the curve.
How do you find the bottlenecks in a data organization?
Look for four telltale signs. Work in progress piling up on an input queue, such as a long list of requests for a scarce resource. Expediting, where resources get diverted to push critical analytics out. Process steps with the longest cycle time. And steps that simply cannot keep up with demand, such as testing and validation.
Who belongs in a DataOps community of interest?
Start with engineers and data scientists who already understand Agile development and DevOps, because they recognize what process improvement does for productivity and quality. Add a C-level executive sponsor who ties the work to strategic goals and supplies budget as a skunkworks matures into an official project. A written strategy and a shared workspace keep a growing group aligned.
Which metrics prove that a DataOps program is working?
Team collaboration, error rates, productivity, deployments between environments, automated test counts, and on-time delivery. On the dashboard in this paper, production warnings fall from 10 per week to virtually zero as 100+ tests run 24x7 against data, ETL, processing results, and business logic, and mean deployment cycle time drops inside its SLA.
What does it mean to iterate on a DataOps program?
It means running the program the way an Agile team runs development: short iterations, each committing to working and valuable change, with priorities reassessed every cycle. Unlike classic software projects, each iteration adds value rather than deferring it, and in DataOps the iterations build on each other, so value grows over time.
What is a DataOps Technical Services group?
A central group that delivers the software services an Agile and DataOps rollout depends on: source code control, Agile ticketing, deploy to production, product monitoring, regression testing, development sandboxes, collaboration and training portals, and test data management. It can also run central process measurement and a mission control view of data-production and development metrics.
What is the difference between a DataOps Center of Excellence and a DataOps Dojo?
A Center of Excellence takes a large, deep-rooted organizational problem, solves it in a smaller proof-of-concept scope, then leverages those wins at scale while setting common standards. A Dojo is a place for short, intense, hands-on training, where staff rotate in for weeks or months, learn on real projects, and carry the skills back to their own teams.
How is this six-step transformation different from the seven steps to implement DataOps?
They answer different questions. The seven steps are technical practices a team adopts inside its own pipelines: tests, version control, branching, environments, containers, parameters. These six steps are the organizational program that carries those practices across an enterprise, from educating a first team to staffing a Center of Excellence.
Get the PDF
The full paper is on this page. Fill in the form for a PDF copy to keep or share.