In most organizations, data quality is everyone’s problem—yet paradoxically, it belongs to no one. It is a shared responsibility that often falls into the cracks of accountability. When marketing can’t run a campaign, sales can’t reach key customers, or finance can’t reconcile reports. Fingers point to the data. But where, precisely, should that finger land? In a world where the stewards of data are not the same as its consumers, and where data quality teams lack the formal authority to demand change, traditional data quality assessment methods fall short. What’s needed is not a new taxonomy or a better algorithm—it’s a fundamentally different approach: one that prioritizes influence over enforcement, iteration over perfection, and advocacy over bureaucracy.
Relieve Yourself From the Burden of Traditional Data Quality Assessments
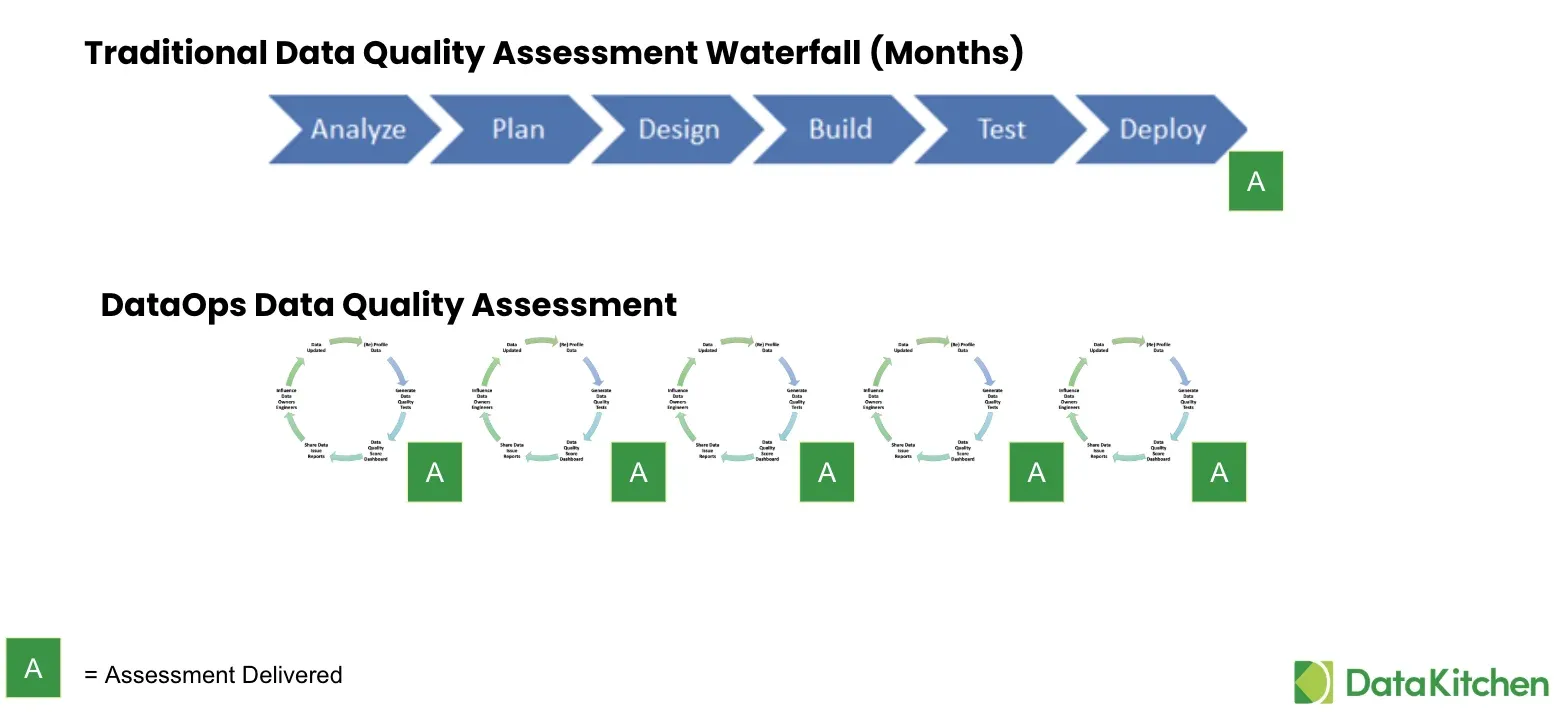
Conventional data quality assessments are built on a deeply flawed assumption: the way to improve quality is through exhaustive analysis. This leads to sprawling, multi-month efforts to categorize and classify issues, often using detailed frameworks derived from academic or regulatory sources. Terms like accuracy, validity, completeness, and consistency become ends rather than means to a business outcome. In the worst cases, teams spend months creating dashboards that no one uses or tracking issues no one fixes.
These methods tend to rely heavily on manual checks, require extensive technical effort (often in SQL or Python), and generate outputs that are hard to act upon. Worse still, they are usually divorced from the actual needs of business stakeholders. A dashboard might show that a column is 90% complete, but the metric is irrelevant if that missing 10% includes the most valuable customers for a campaign. The result is assessments that are technically rigorous but strategically impotent. They measure, but they don’t move.
The Real Challenge: Misaligned Incentives
At the heart of the data quality conundrum is a misalignment between those who produce data and those who consume it. Data owners—such as IT, ERP teams, or operational units—optimize for their internal processes. They focus on the data fields that matter to them, and often consider their datasets “good enough” for those purposes. By contrast, data consumers—marketing, sales, finance, analytics—need integrated, comprehensive, and accurate information that spans domains. “Good enough” for the producer is not good enough for the consumer.
Take, for example, a marketing team eager to launch an upsell campaign. They need both street addresses and email addresses to personalize outreach. Yet they discover that half the records have reliable emails, the other half have complete addresses, and only 20% have both. The campaign stalls. The team turns to the data quality lead and says, “Fix it.” However, the lead cannot compel upstream data owners to prioritize the fix, especially if those owners don’t experience the pain directly.
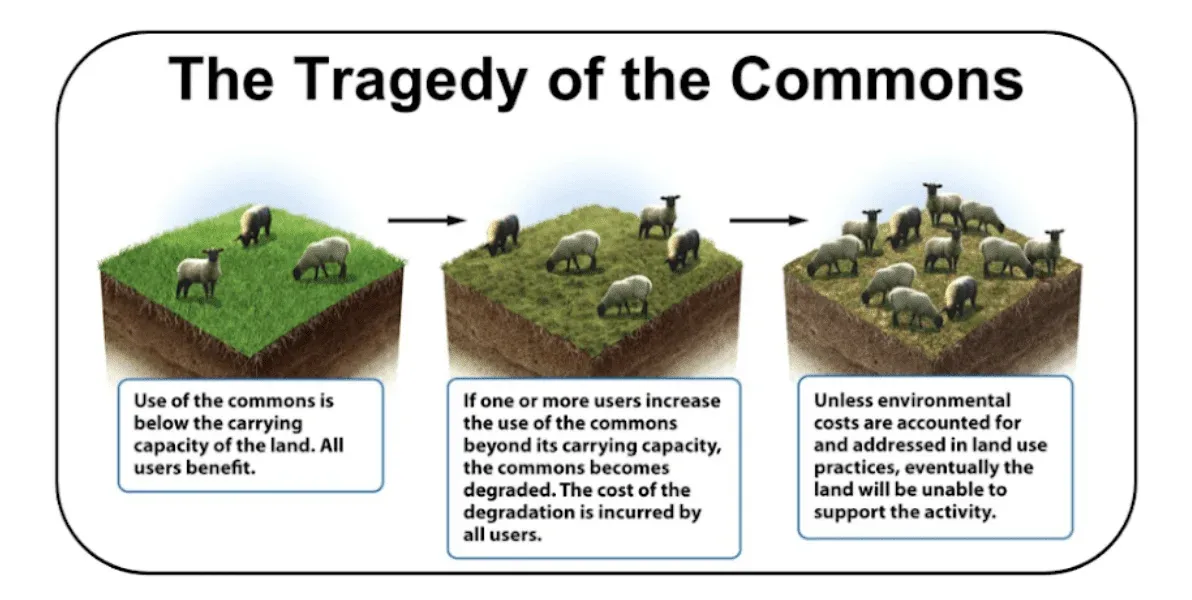
This disconnect mirrors the ecological concept of the “tragedy of the commons,” where shared resources are depleted because individuals act in their short-term interest. In data quality, that shared resource is clean, usable data, and no one wants to take responsibility for fixing problems that benefit others more than themselves. Like shared pastures where every farmer unknowingly overgrazes, shared data environments suffer when individual actors optimize for their own needs, rather than the collective good. Without clear ownership or incentives, everyone contributes to degradation, and no one takes responsibility for repair.
A Better Way: Influence, Not Authority
Faced with this reality, data quality leaders must rethink their role. They are neither compliance officers nor gatekeepers of platonic data ideals. They are advocates. Using their language and metrics, they must campaign for change, build coalitions, and show stakeholders why quality matters.

This is not a theoretical shift; it is a practical one. In this new approach, the data quality assessment becomes a tool of persuasion and influence. It is no longer about documenting problems for posterity. It is about demonstrating how poor data hurts specific business outcomes and presenting a clear, actionable path to improvement. The number of issues identified does not define success, but rather the number resolved.
To support this approach, a new methodology has emerged—one that is small in scope, fast in execution, and laser-focused on stakeholder value. It doesn’t begin with a taxonomy—it begins with a problem.
Start With an Urgent Business Need
Practical assessments begin where the pain is sharpest. The triggers and motivators are a stalled marketing campaign due to incomplete customer data, a finance compliance risk caused by inaccurate reporting, or a high-priority sales initiative hampered by inconsistent customer information. The data quality leader begins by identifying a narrow slice of data critical to that goal. Rather than inventorying every field in a warehouse, they zoom in on the handful that truly matter.
They then profile this data, not to build a catalog, but to understand what’s broken meaningfully. Are the email fields malformed? Are the street addresses misaligned with customer IDs? What percentage of records are complete enough to support the campaign? These insights, when shared with business stakeholders, build credibility and urgency.
Use Automation to Accelerate and Scale
The traditional bottleneck in data quality work is data quality test creation. Writing thousands of rules by hand is not only tedious but also unscalable. That’s why the next phase in this approach is automated, generative test generation. Open-source tools like DataKitchen’s DataOps TestGen can profile data and surface anomalies, and propose dozens of tests with a single click. These include format checks, consistency validations, integrity rules, and many more. The DataOps TestGen tool is a key component in this new approach, as it automates the generation of data quality tests, making the process faster and more scalable.
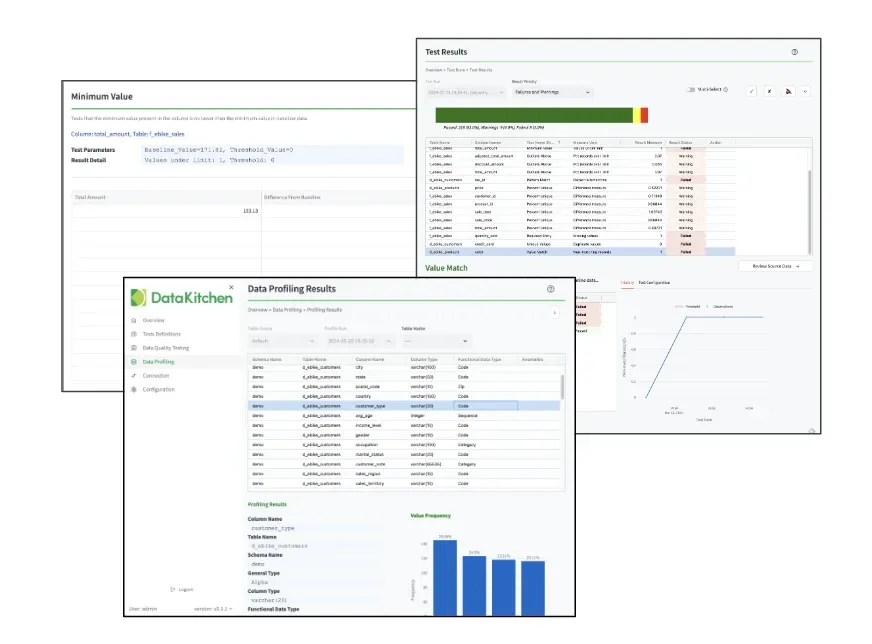
Most importantly, these tests produce scores, quantifiable metrics that track the quality of specific data elements over time. These scores form the backbone of a quality dashboard that speaks the language of business by presenting data quality in terms of its impact on business goals and outcomes, rather than technical jargon or abstract measures.
Iterate, Align, and Influence
Once an initial dashboard is built, the next step is socializing it. This doesn’t mean blasting an email. It means sitting down with data owners, showing them the impact of data issues on real business goals, and asking for help. The framing matters. It’s not “You broke this,” but “We can fix this together, and here’s why it matters, and here is all the information you need to make the change.”
In this model, the data quality leader becomes a salesperson—or perhaps more charitably, an evangelist. They frame problems as shared opportunities. They seek quick wins. They use each success to build trust and momentum. And they continue to iterate, adding more tests, refining dashboards, and expanding the scope of assessment based on stakeholder feedback. Spending your spare time reading Dale Carnegie’s How to Win Friends and Influence People might help more than reading ISO 8000.

Over time, a virtuous cycle emerges. Stakeholders see the value of improved data. Data owners become more responsive. The quality team is seen not as a nagging force but as a trusted partner. Most importantly, business outcomes improve.
Why It Works
This method works because it is aligned with human nature and organizational dynamics. People are more likely to act when they see a direct benefit, listen when problems are framed in their language, and support efforts that show results quickly.
It also works because it is inherently agile and iterative. Rather than waiting six months for a final report, this method delivers value in days or weeks. It encourages and rewards experimentation and tolerates imperfection. You don’t need to fix everything; you just need to fix the right things. It’s part of the DataOps Approach to Data Quality.
Crucially, it works at scale. Automated test generation and scorecard dashboards mean that even a small team—or a single data quality advocate—can manage assessments across dozens or hundreds of data sources. The bottleneck shifts from technical labor to human alignment, where the data quality team can add the most value.
NOTE
We walked through this method live in A New, More Effective Approach to Data Quality Assessments, including the profiling and scoring screens.
How It Works: The Data Quality Assessment and Improvement Process
This process is built around a simple yet transformative idea: focus on what matters, deliver value quickly, and build momentum through influence rather than authority. The process begins by anchoring on a specific, urgent need from a real data consumer—someone who cannot achieve their business goal because of poor data. This is not an academic exercise. It’s a targeted effort to remove a known blocker for a known person or team. Whether it’s a marketing campaign that can’t be launched, an incomplete compliance report, or a product analytics dashboard that no one trusts, the starting point is always the same: listen to the pain, and make it your purpose.
- Start with a specific data consumer’s urgent need for quality data
- Select a small number of data elements to improve
- Identify the technologists and data owners who can effectively change those elements.
- Gain access and learn the data through data profiling
- Develop draft data quality tests that identify specific data quality challenges
- Gain alignment between data customers, data owner, and technologist on the problem, the need to improve, and the goals & timeline
- Build a data quality score and dashboard for those data elements
- Create specific, detailed actions that need to take place with data owners/technologists
- Share detailed data quality issue reports
- Monitor progress on improvement (and communicate)
- Improve data quality tests as learning takes place
- Iterate until complete
- Then start with another tranche of data elements, customers, owners, and technologists.
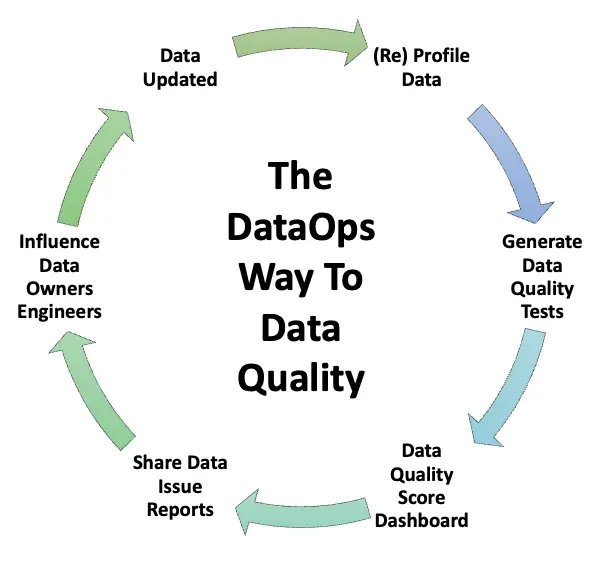
The process repeats—iterating until the original goal is achieved, and then starting again with a new tranche of data elements. Each cycle adds value, builds relationships, and expands the culture of quality. What starts as a targeted fix evolves into a scalable, organization-wide improvement strategy—not through command-and-control, but through continuous, stakeholder-centered action.
In Conclusion, A Call to Action
For too long, data quality work has been mired in paralysis. When caught between technical rigor and business urgency, many assessments fail to gain traction. But the path forward is clear. Start small. Focus on specific business needs. Use tools that automate the grunt work. Most of all, they should act like advocates, not auditors.
Data quality is not just a technical challenge—it’s a cultural one. Culture changes not through mandates but through influence. The new approach to data quality assessments puts that influence within reach. It’s not about power. It’s about persuasion. It’s not about frameworks. It’s about focus. And it’s not about measuring everything. It’s about improving what matters most.
The tool exists. The need is urgent. The method is proven. The next move is yours.
DataOps Data Quality TestGen Was Built to Change the Way the World Does Data Quality Assessments
DataOps Data Quality TestGen is uniquely equipped to bring the new, influence-first approach to data quality assessments to life. For data engineers and data quality practitioners tired of manual test creation and bloated governance exercises, TestGen offers a practical, fast, and scalable solution. It is built from the ground up to support the agile, stakeholder-driven methodology. It redefines how data quality assessments can deliver value, starting with small, urgent business needs and expanding based on real-world feedback.
At the core of TestGen is a powerful generative engine that automatically creates dozens of meaningful data quality tests without requiring users to write a single line of SQL or Python. This is not a lightweight toy—it’s a full-featured, open-source platform that profiles your data, identifies potential hygiene issues, and proposes comprehensive test suites based on profiling insights. With just a few clicks, you can connect to your database, define a scope of interest, and produce a set of tests that would otherwise take days or weeks to write manually. Within an hour, you can have a live dashboard scoring your data and highlighting exactly where and how quality problems undermine business goals.
Because TestGen is free and open-source, it lowers the barrier to entry for data quality work. You can install it locally and begin making a real impact today—no procurement, red tape, or licensing headaches. And for teams that want to scale their efforts or integrate more deeply into enterprise workflows, there is a path forward with enterprise-grade features, while keeping the core experience lightweight and focused. Whether you’re a lone data engineer or part of a quality team embedded in a business unit, TestGen empowers you to act like an influencer: show results quickly, rally support, and iterate fast.
In short, DataOps TestGen doesn’t just support the new model of data quality assessment—it enables it. It transforms data quality work from a technical grind into a high-leverage, advocacy-driven process. If your goal is to stop measuring and start solving problems, TestGen is the fastest and most effective way.
TIP
Install Open Source DataOps Data Quality TestGen and start your assessment today: datakitchen.io/install/testgen/
More Resources
- Free Data Quality & Observability Certification
- DataOps Approach To Data Quality White Paper
- Data Quality Assessment Webinar
- Free DataOps Cookbook
- Free DataOps Certification
Related Reading
- Data Quality: The DataOps Way — the seven-step practice this assessment method sits inside
- 7 Steps to Implement DataOps — the engineering practices underneath
- How Data Quality Leaders Can Gain Influence and Avoid the Tragedy of the Commons — why shared data degrades when no one owns the repair
- Why Data Quality Dimensions Fall Flat — what goes wrong when the taxonomy becomes the goal
- The Six Types of Data Quality Dashboards — choosing a score that a specific stakeholder will act on
- Why Your Data Quality Dashboard Isn’t Working — the failure modes of scores nobody acts on
- The Data Quality Revolution Starts With You — the case for starting as one person with influence
- Stop Paying the Data Quality Tax — what the unfixed backlog actually costs
- The Seven Deadly Sins of Data Quality — the habits this approach is meant to break
FAQ
What is the main point of this paper?
A data quality assessment should be a tool of persuasion, not a catalogue of defects. Because data quality teams rarely have authority over the systems producing bad data, the effective assessment starts with one urgent business need, profiles a narrow slice of data, uses automated test generation to build a score dashboard in hours, and then influences data owners to act. Success is the number of issues resolved, not identified.
Why do traditional data quality assessments fail?
They are built on the assumption that quality improves through exhaustive analysis. That produces multi-month classification efforts, heavy manual checking in SQL or Python, and outputs divorced from what business stakeholders actually need. A dashboard showing a column is 90% complete is irrelevant if the missing 10% are the campaign’s most valuable customers. The assessments are technically rigorous and strategically impotent.
What is the tragedy of the commons in data quality?
Shared data behaves like a shared pasture. Data owners optimize for their own operational processes and treat their datasets as good enough for those purposes, while consumers in marketing, sales, finance, and analytics need integrated, accurate information spanning domains. Without clear ownership or incentives, every actor contributes to degradation and no one takes responsibility for repair.
Why can’t a data quality leader just require upstream teams to fix the data?
Because they have no formal authority over the systems that produce it, and the people who do own those systems rarely feel the pain. A marketing team can ask the data quality lead to fix broken email and address records, but the lead cannot compel the ERP or operational team to reprioritize. Change comes through advocacy, coalition-building, and evidence.
Where should a data quality assessment start?
Where the pain is sharpest: a stalled marketing campaign, a finance compliance risk, a sales initiative hampered by inconsistent customer information. Identify the narrow slice of data critical to that goal, and profile only that. Rather than inventorying every field in a warehouse, zoom in on the handful that truly matter, then share the findings to build credibility and urgency.
How does automated test generation change data quality assessment?
Writing thousands of data quality rules by hand is tedious and unscalable, and it is the traditional bottleneck. A generative engine profiles the data, surfaces anomalies, and proposes dozens of tests with a single click — format checks, consistency validations, integrity rules. Those tests produce scores, and the scores become a dashboard that tracks specific data elements over time.
What should a data quality dashboard show?
Data quality in terms of its impact on business goals and outcomes, rather than technical jargon or abstract measures. The scores should cover the specific data elements a named stakeholder depends on, so the dashboard answers a business question. A dashboard that speaks the language of business gets socialized and acted on; one full of dimensional metrics gets ignored.
What are the steps in the data quality assessment and improvement process?
Start with a specific data consumer’s urgent need; select a small number of data elements; identify the technologists and data owners who can change them; gain access and profile the data; draft data quality tests; align customers, owners, and technologists on the problem and timeline; build a score and dashboard; create specific actions; share issue reports; monitor and communicate progress; improve the tests as learning takes place; iterate until complete; then start another tranche.
How long should a data quality assessment take?
Days or weeks, not six months. The method is agile and iterative by design: it delivers value early, encourages experimentation, and tolerates imperfection. You don’t need to fix everything, you just need to fix the right things. Waiting for a final report before anything improves is what makes conventional assessments stall out.
Why does the influence-first approach work?
It is aligned with human nature and organizational dynamics. People act when they see a direct benefit, listen when problems are framed in their own language, and support efforts that show results quickly. Framing matters: not “you broke this” but “we can fix this together, here’s why it matters, and here is everything you need to make the change.”
Does this approach scale beyond one team?
Yes. Automated test generation and scorecard dashboards mean even a small team, or a single data quality advocate, can run assessments across dozens or hundreds of data sources. The bottleneck shifts from technical labor to human alignment, which is where the data quality team adds the most value. Each completed cycle expands the culture of quality.
What is DataOps TestGen’s role in this method?
TestGen is a free, open-source platform built to support the agile, stakeholder-driven assessment. It profiles your data, identifies hygiene issues, and proposes comprehensive test suites from those profiling insights without requiring SQL or Python. Install it locally, connect to a database, define a scope, and within an hour have a live dashboard scoring your data — no procurement or licensing.
Get the PDF
The full paper is on this page. Fill in the form for a PDF copy to keep or share.