Why Your Data Quality Dashboard Isn’t Working And What to Do About It
Your organization has a data quality dashboard. You’ve put time and effort into visualizing metrics, tracking scores, and creating reports. But week after week, data quality barely improves. This is a common and frustrating problem. Poor-quality data can disrupt operations, mislead strategies, and damage trust. So why do so many dashboards, made to fix this, fail to make a real difference?
The truth is, not all dashboards are the same. Many are made by technologists for technologists, focusing on abstract data qualities and ignoring the people who need to act on the information. They focus on technical details instead of linking data problems to real business goals and pressures.
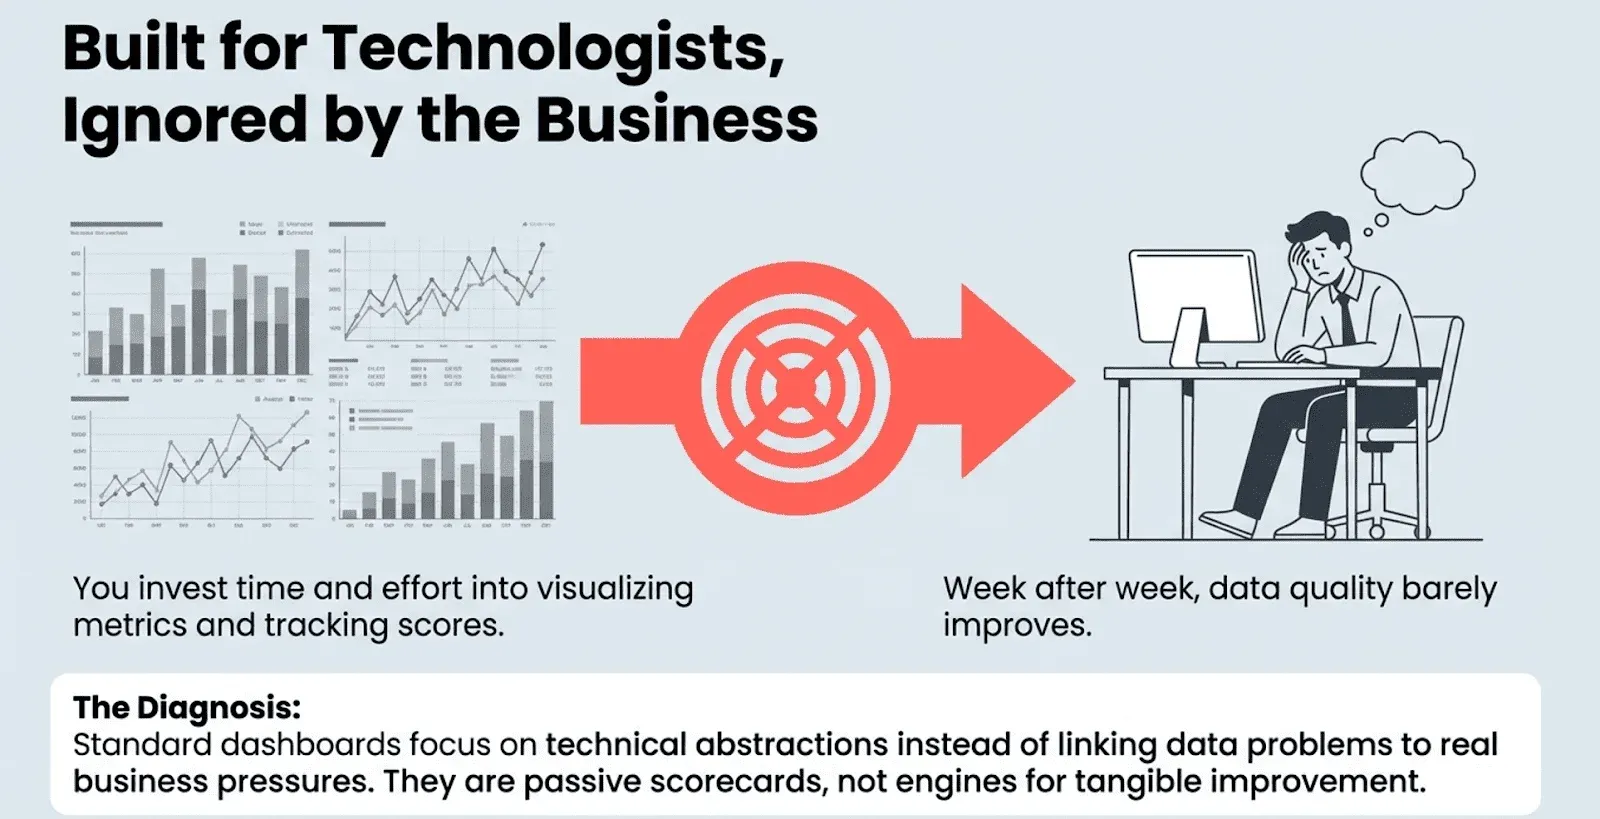
This article pulls back the curtain on why standard data quality dashboards fall short. We’ll reveal six powerful, and perhaps surprising, truths about what actually makes a dashboard an effective tool for change, transforming it from a passive scorecard into an engine for tangible improvement.
1. “Standard” Dashboards Are Designed to Fail
The most common type of data quality dashboard is the Dimension-Focused dashboard. This approach evaluates data against a set of abstract academic categories such as completeness, accuracy, consistency, and timeliness. It seems logical; these are the fundamental building blocks of quality, after all. The result is a dashboard full of neat, tidy scores that signify absolutely nothing to the business.
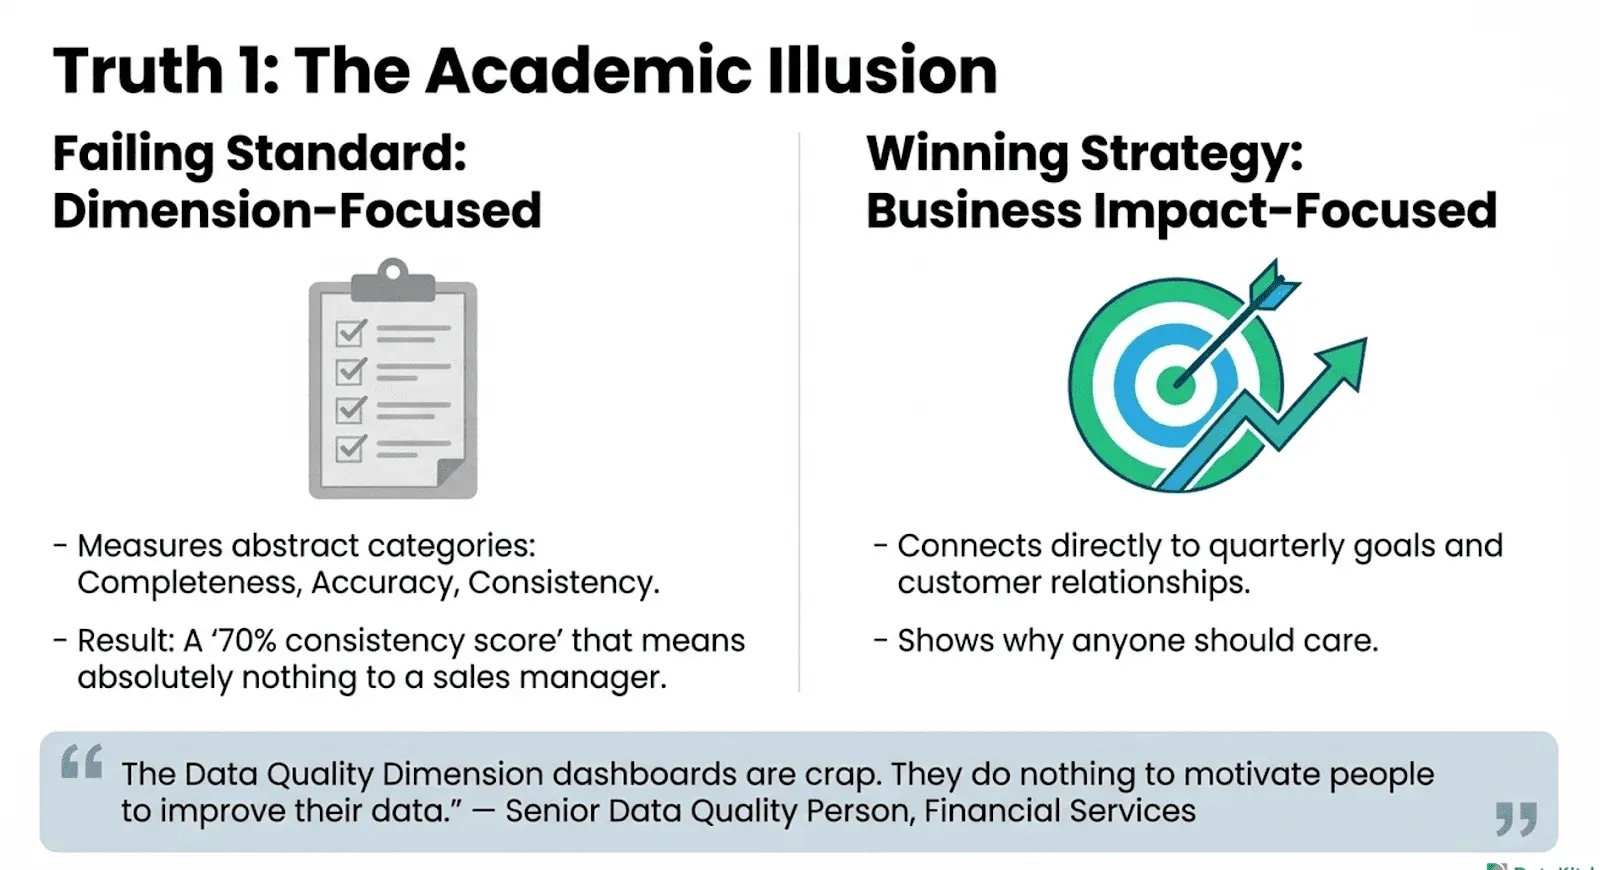
The problem is that these abstract scores rarely inspire action. Telling a sales manager their data has a “70% consistency score” means little. It doesn’t relate to their quarterly goals, customer relationships, or daily challenges. The metrics are too disconnected from what business teams focus on and care about. As one industry expert said:
“The Data Quality Dimension dashboards are crap. They do nothing to motivate people to improve their data.” — Senior Data Quality Person, Financial Services, DataKitchen Market Research
This gap between technical measures and business impact is the main reason these dashboards fail. They show the “what” but never explain “why anyone should care.” The standard approach is flawed because it misunderstands the real problem.
2. Data Quality Isn’t a Tech Problem; It’s an Influence Problem
We often treat data quality as a technical challenge to be solved with better tools and stricter rules. In reality, it’s a classic “Tragedy of the Commons.” Everyone in the organization uses the shared data resource, but no single person or team is incentivized to maintain it.
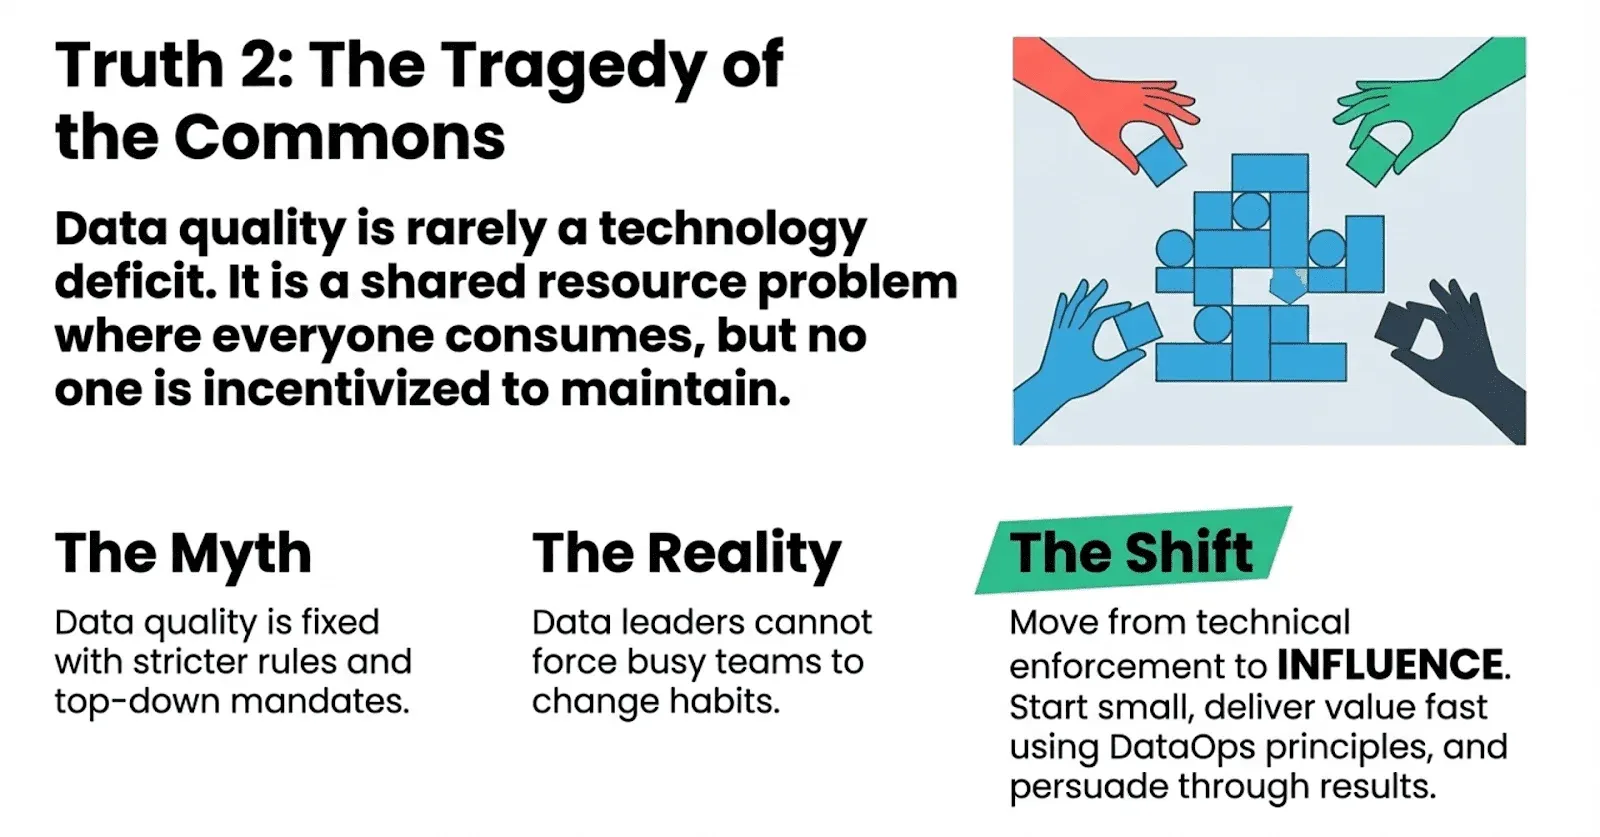
This reframes the role of a data quality leader. It’s not a position of power; it’s an influence challenge. Data quality leaders cannot make anyone fix data issues. They can’t mandate that a busy call center team change its data entry habits or force a third-party supplier to clean up its feed. They must persuade, convince, and motivate others to take action.
Real, lasting improvement doesn’t come from top-down orders. It begins with one empowered person driving change through their influence. They succeed by focusing on a specific customer and, importantly, by starting small and iterating quickly using DataOps principles. Influence isn’t just persuasion; it’s a method that delivers value fast and builds the trust needed for wider change.
3. You’re Measuring Quality Too Late: Monitor Data Delivery First
Most data quality dashboards assume the data they measure is already in your warehouse or lakehouse. For data engineers, this is a big blind spot. By the time a quality problem appears on a dashboard, it has often already affected downstream models, reports, and decisions.
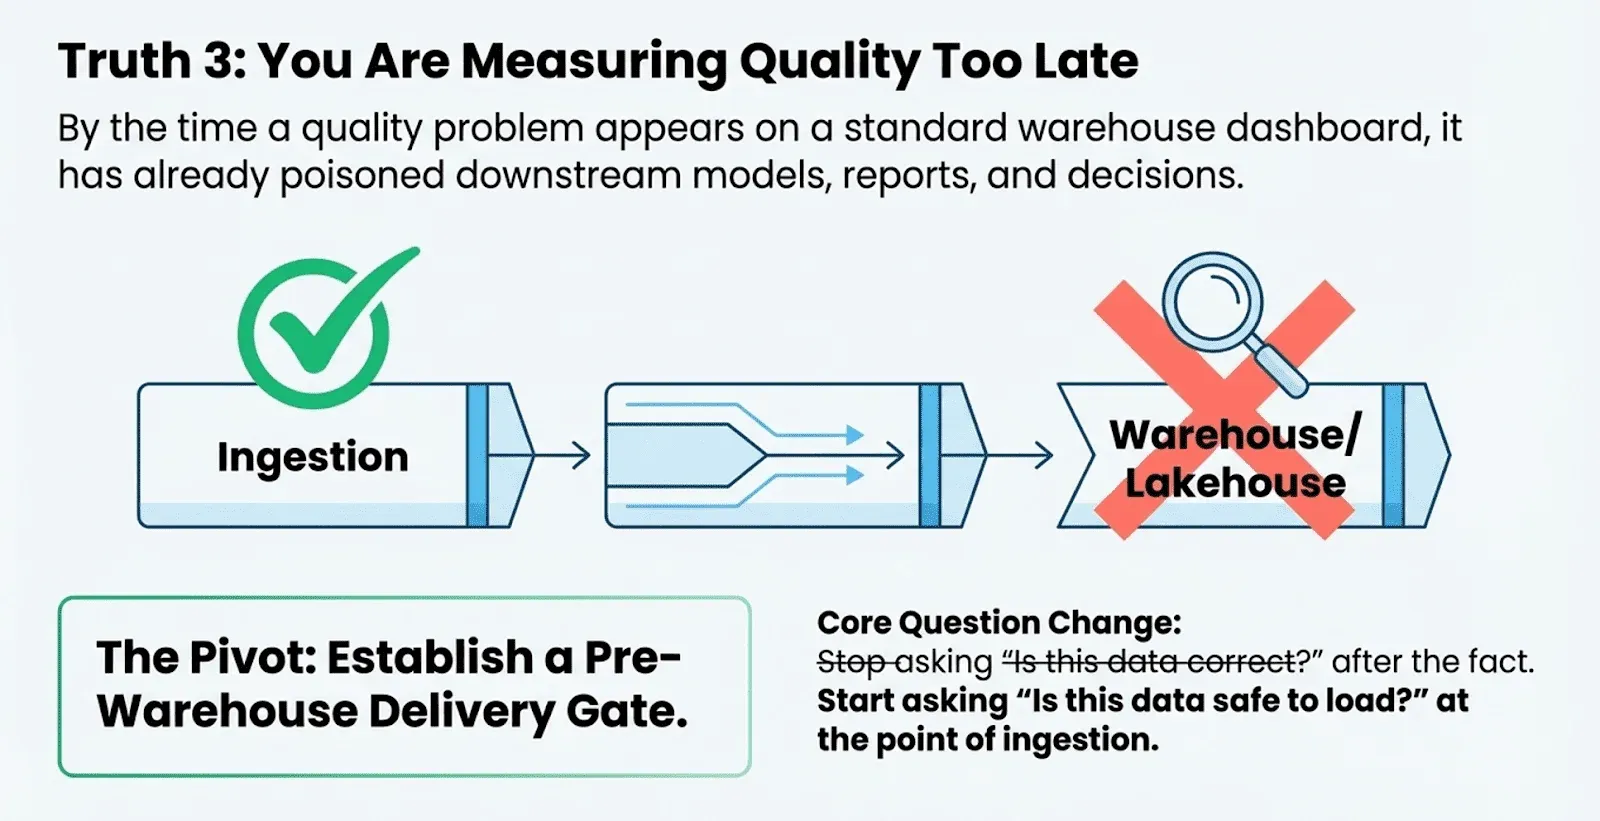
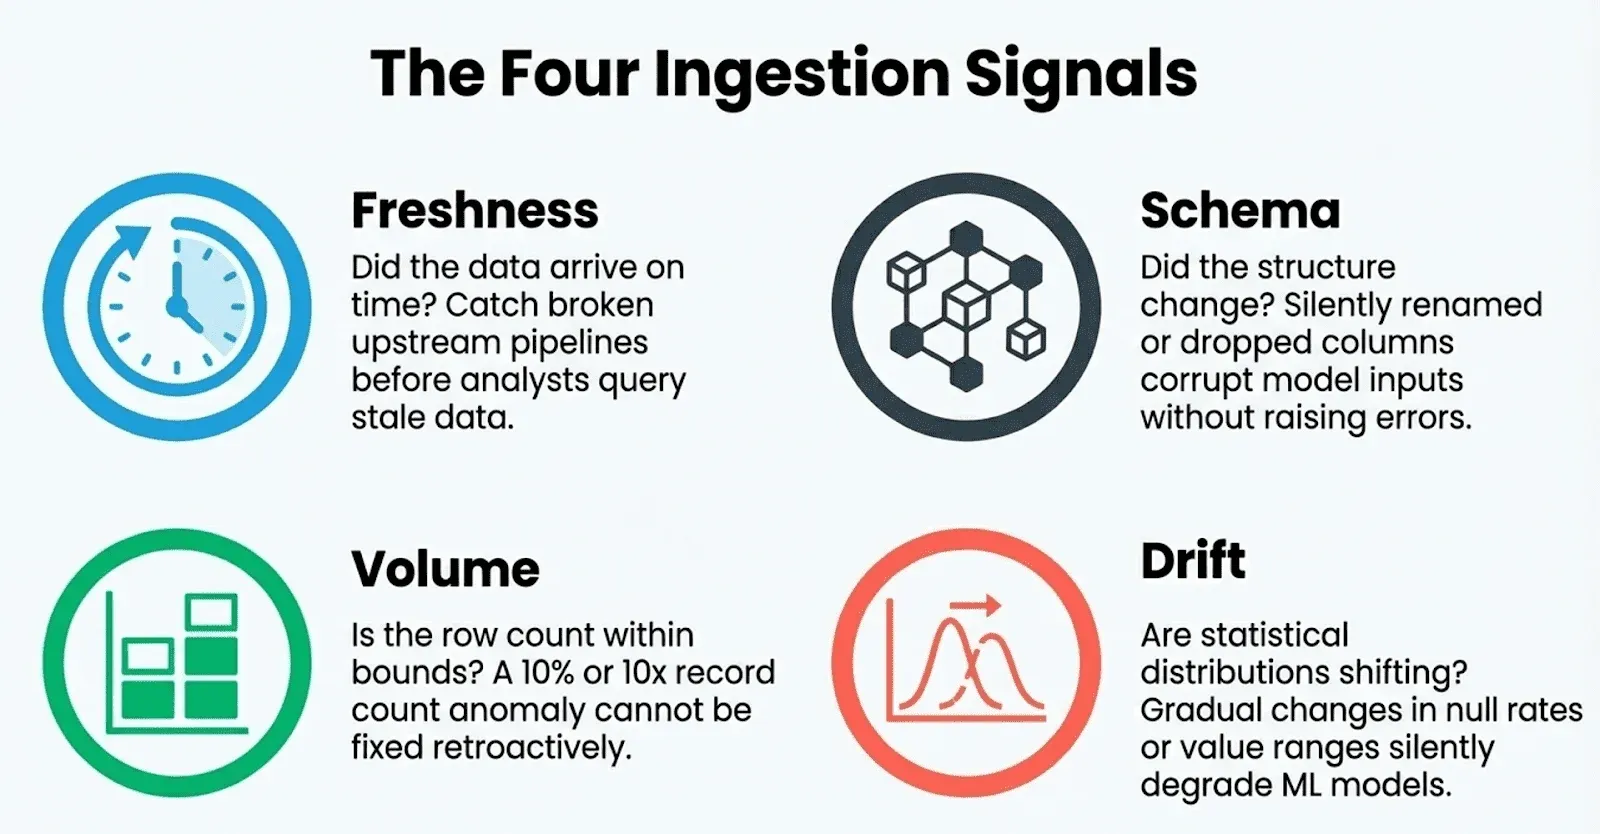
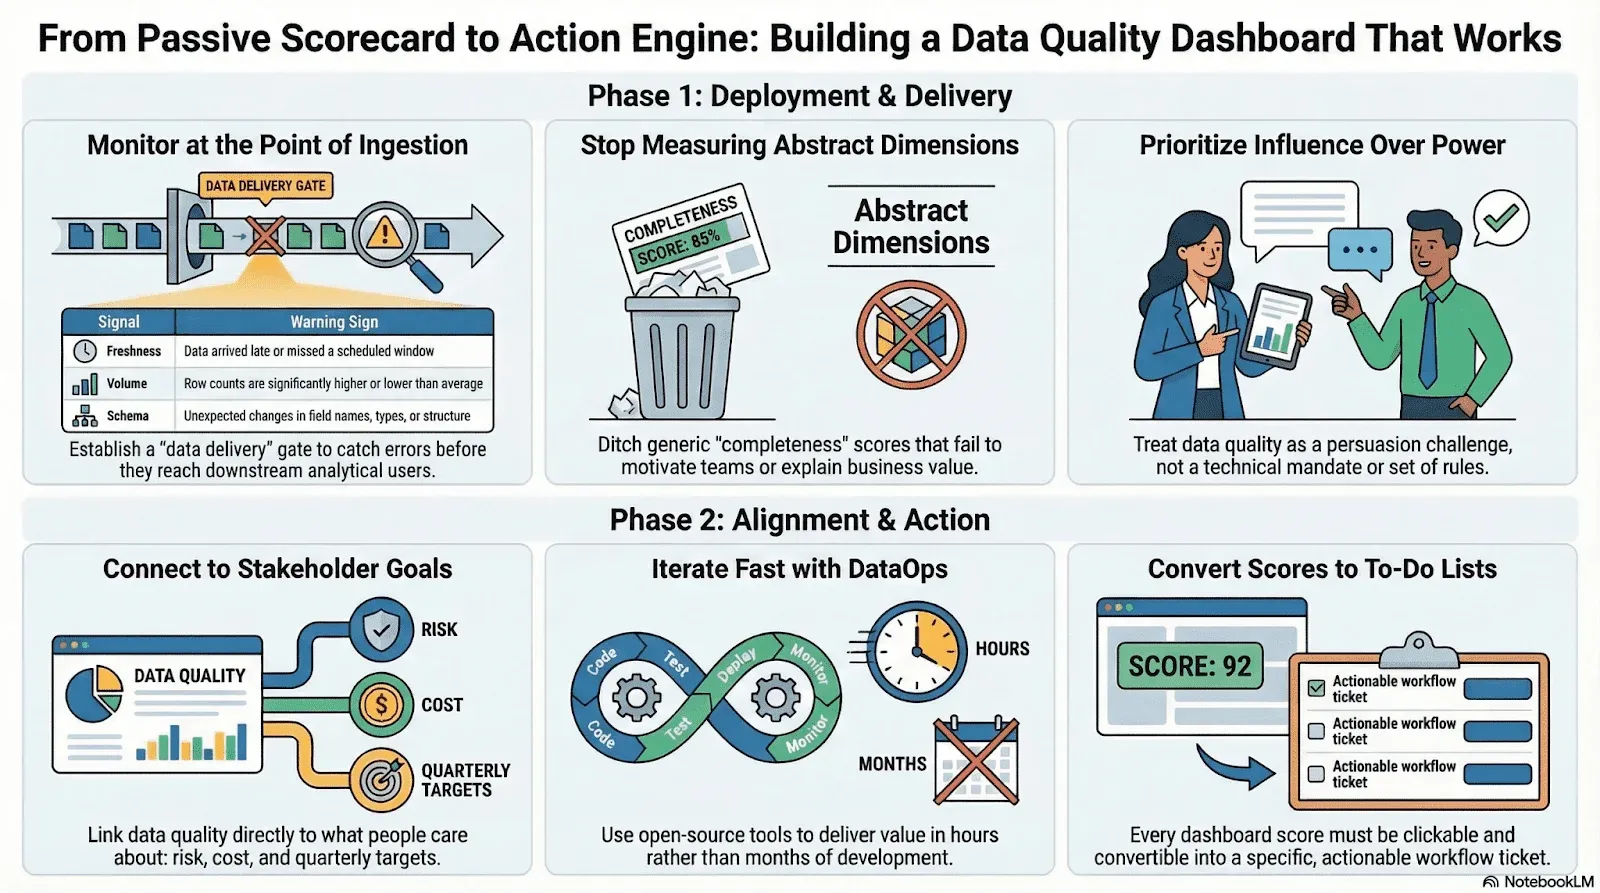
The fix is to monitor data during ingestion before it ever reaches your analytical customers. You can establish checks on four key signals at the point of ingestion:
- Freshness — Did the data arrive on time? A late feed is often the first symptom of a broken upstream pipeline or a vendor outage. Catching it early prevents analysts from querying stale data without realizing it.
- Schema — Did the structure of the data change unexpectedly? A silently renamed column, a dropped field, or a changed data type can break pipelines and corrupt model inputs without raising any immediate errors.
- Volume — Is the row count within expected bounds? A file that arrives with 10% of its normal record count, or 10 times the normal count, signals a serious upstream problem that no amount of downstream quality checking can fix retroactively.
- Drift — Are the statistical distributions of key fields changing over time? Gradual drift in value ranges, null rates, or categorical distributions is how data quietly goes bad before any hard rule is violated. Drift is especially critical for teams feeding ML models, where training/serving skew can silently degrade model performance.
Think of this as a data delivery quality dashboard, a pre-warehouse gate that answers the question “Is this data safe to load?” instead of “Is this data correct?” Both questions are important, but they need to be asked in the right order. Finding a schema change or volume issue at ingestion takes minutes to fix; finding it after it’s passed through several models and reports can take days. A full data quality strategy covers both: monitoring delivery at ingestion and testing quality downstream.
4. To Drive Action, You Must Connect to What People Already Care About
If data quality is about influence, the answer is to stop focusing on abstract quality measures and start connecting data problems to the real goals your stakeholders care about. A dashboard becomes useful only when its metrics speak the business language: risk, cost, and opportunity. Instead of a generic “70% consistency score” that no one owns, the best dashboards show metrics for which a specific person is responsible.
Different types of dashboards succeed precisely because they make this connection:
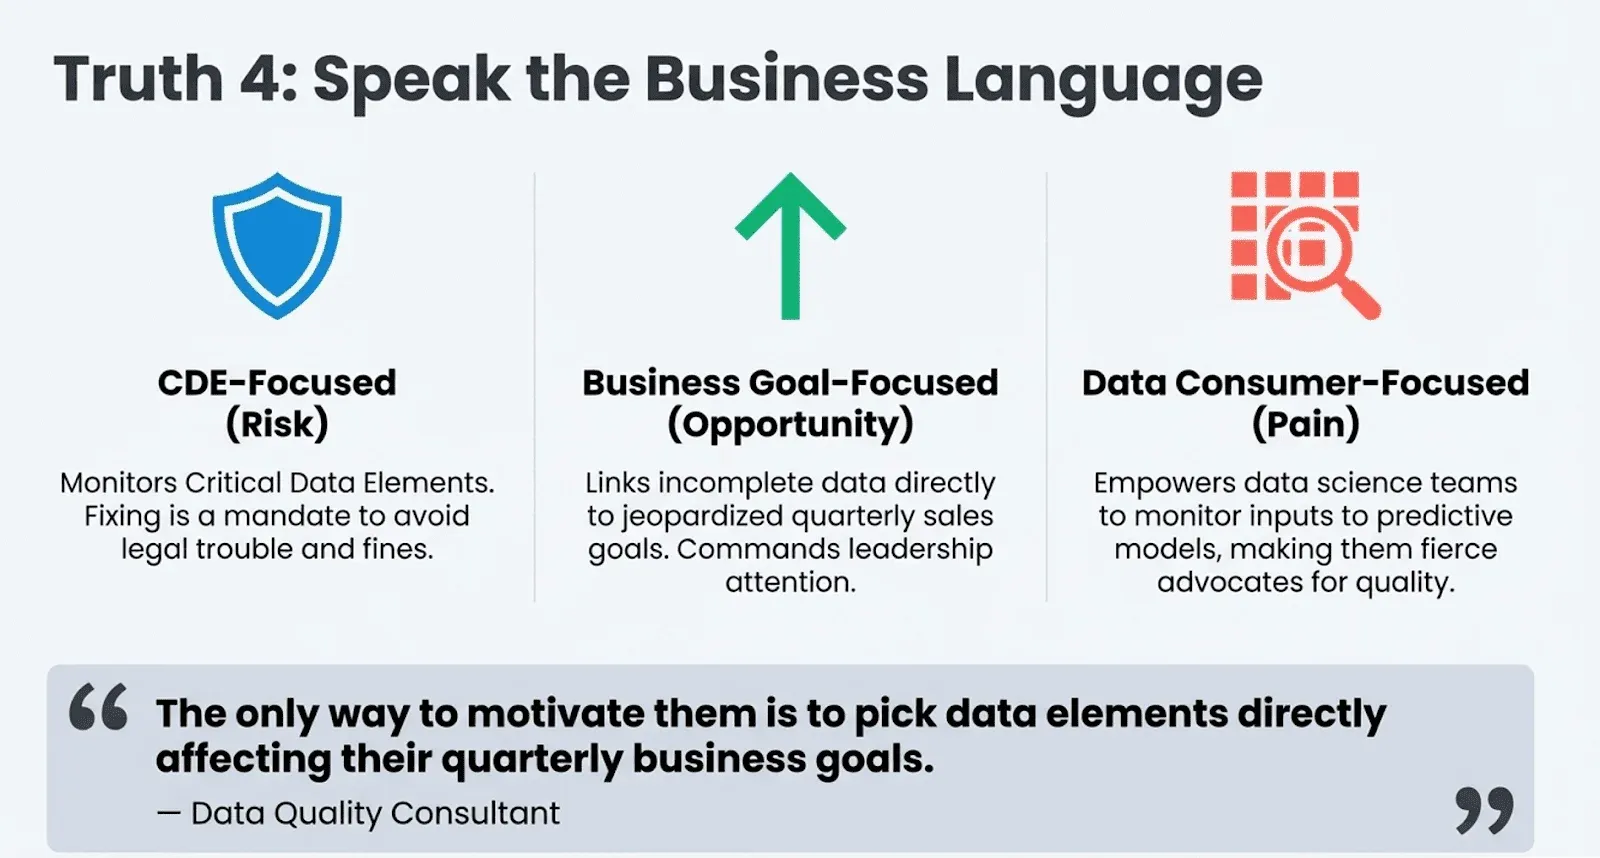
- CDE-Focused Dashboards work in regulated industries because they monitor Critical Data Elements required for compliance. Fixing this data isn’t a “nice-to-have”; it’s a “MUST do” to avoid fines or legal trouble. The motivation is built in.
- Business Goal-Focused Dashboards are effective because they directly link data quality to achieving organizational objectives. When you can show that incomplete customer data is jeopardizing the quarterly sales goal, you suddenly have leadership’s attention.
- Data Consumer-Focused Dashboards work by empowering the people who feel the pain of bad data most acutely. A dashboard built for a data science team to monitor the inputs to their high-value predictive models makes them powerful advocates for quality.
As one consultant said, the key is to focus on what already matters:
“How do you get the business to take action? … The only way to motivate them is to pick data elements directly affecting their quarterly business goals. They care about that.” — Data Quality Consultant, DataKitchen Market Research
The most effective dashboards aren’t one-size-fits-all. They are tailored, customer-centric tools designed to align with a specific person’s or team’s existing motivations.
5. Dashboards Fail If It Takes Too Long to Build or Costs Too Much
Even the most thoughtfully designed dashboard is worthless if it never actually ships, or if the cost of building and maintaining it exceeds the value it creates. Yet this is exactly where many data quality programs quietly die.
Two failure modes are especially common:
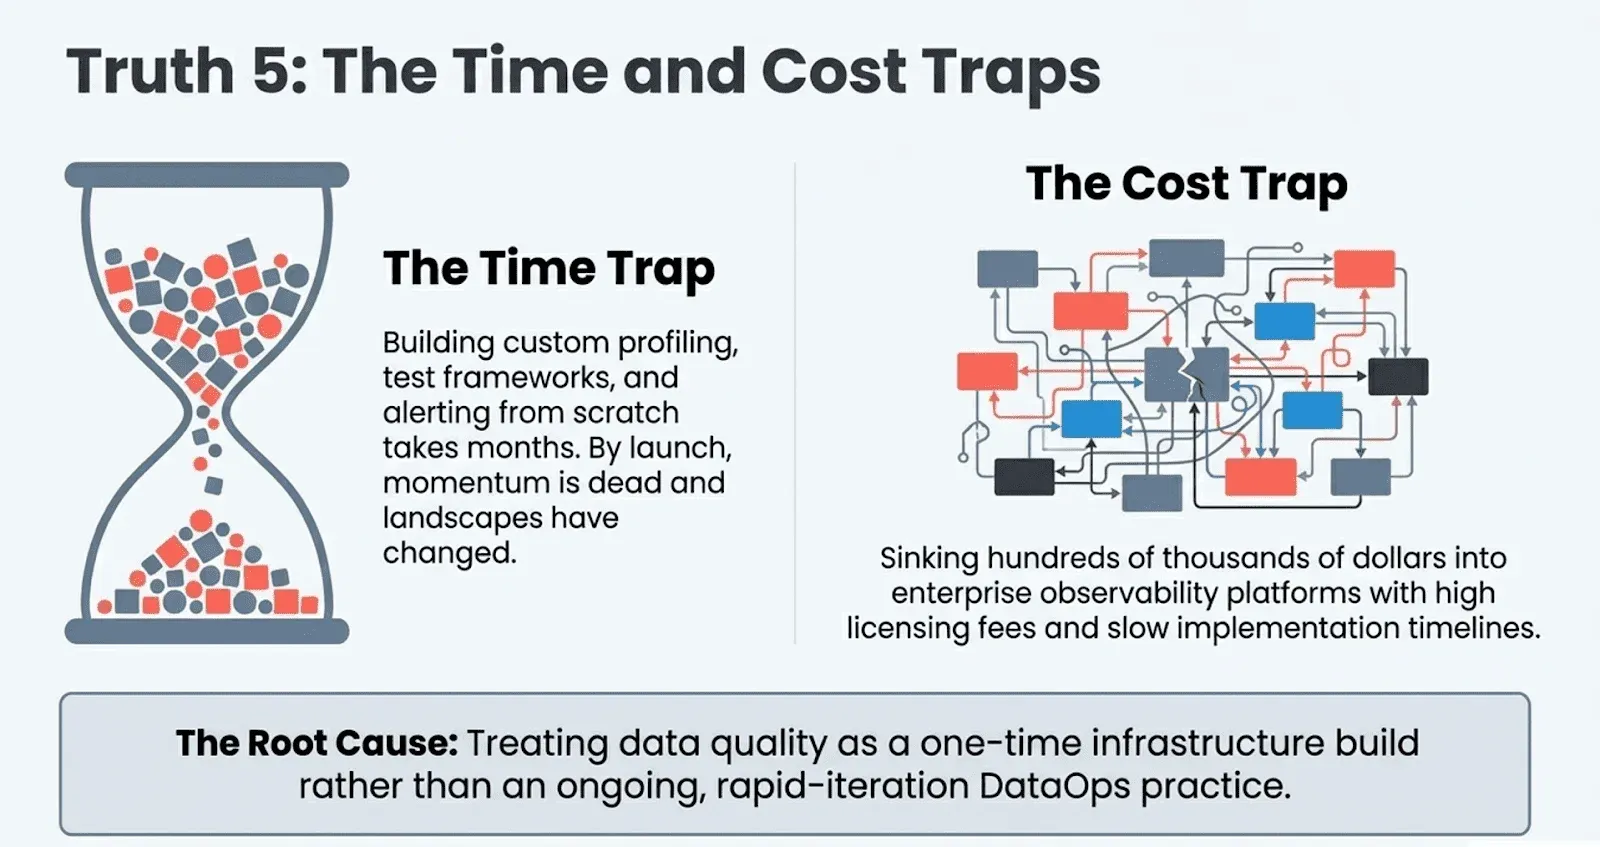
The Time Trap. Building a data quality dashboard from scratch, writing custom profiling logic, designing test frameworks, wiring up alerting, and creating stakeholder-facing views can easily consume months of engineering time. By the time the dashboard is live, stakeholder priorities have shifted, the data landscape has changed, and the initial momentum is gone.Speed of delivery is not a luxury; it is a prerequisite for organizational trust.
The Cost Trap. Many teams have invested hundreds of thousands of dollars in enterprise data observability platforms, only to find that the promised value never materializes. Licensing costs are high, implementation timelines stretch out, and the tools often require specialized expertise to operate. Meanwhile, the core problems, bad data, broken pipelines, and unhappy consumers, remain unsolved.
Both traps share the same root cause: treating data quality as a one-time infrastructure project rather than an ongoing operational practice. A DataOps approach breaks this pattern. It emphasizes short delivery cycles, rapid iteration, and continuous feedback loops, the same principles that transformed software development are just as applicable to data quality work.
Open source tools like DataKitchen’s TestGen make this concrete. TestGen is designed to get a team from zero to a working, test-based data quality dashboard in hours, not months, with no licensing fees. It auto-profiles your data to generate an initial test suite, provides a clean UI for managing and monitoring test results, and integrates with the broader DataKitchen Observability platform for pipeline-level monitoring. Teams that start with TestGen typically have their first real quality insights before the end of their first day.
The goal isn’t to eliminate investment in data quality tooling; it’s to ensure that investment starts delivering value immediately and continues to do so as the program grows.
6. An Effective Dashboard Is Simply a To-Do List in Disguise
A score, no matter how accurate, is not an action. A chart trending downward is an observation, not a solution. The most profound and counterintuitive truth is that an effective dashboard’s purpose is not to report a number, but to generate a to-do list.
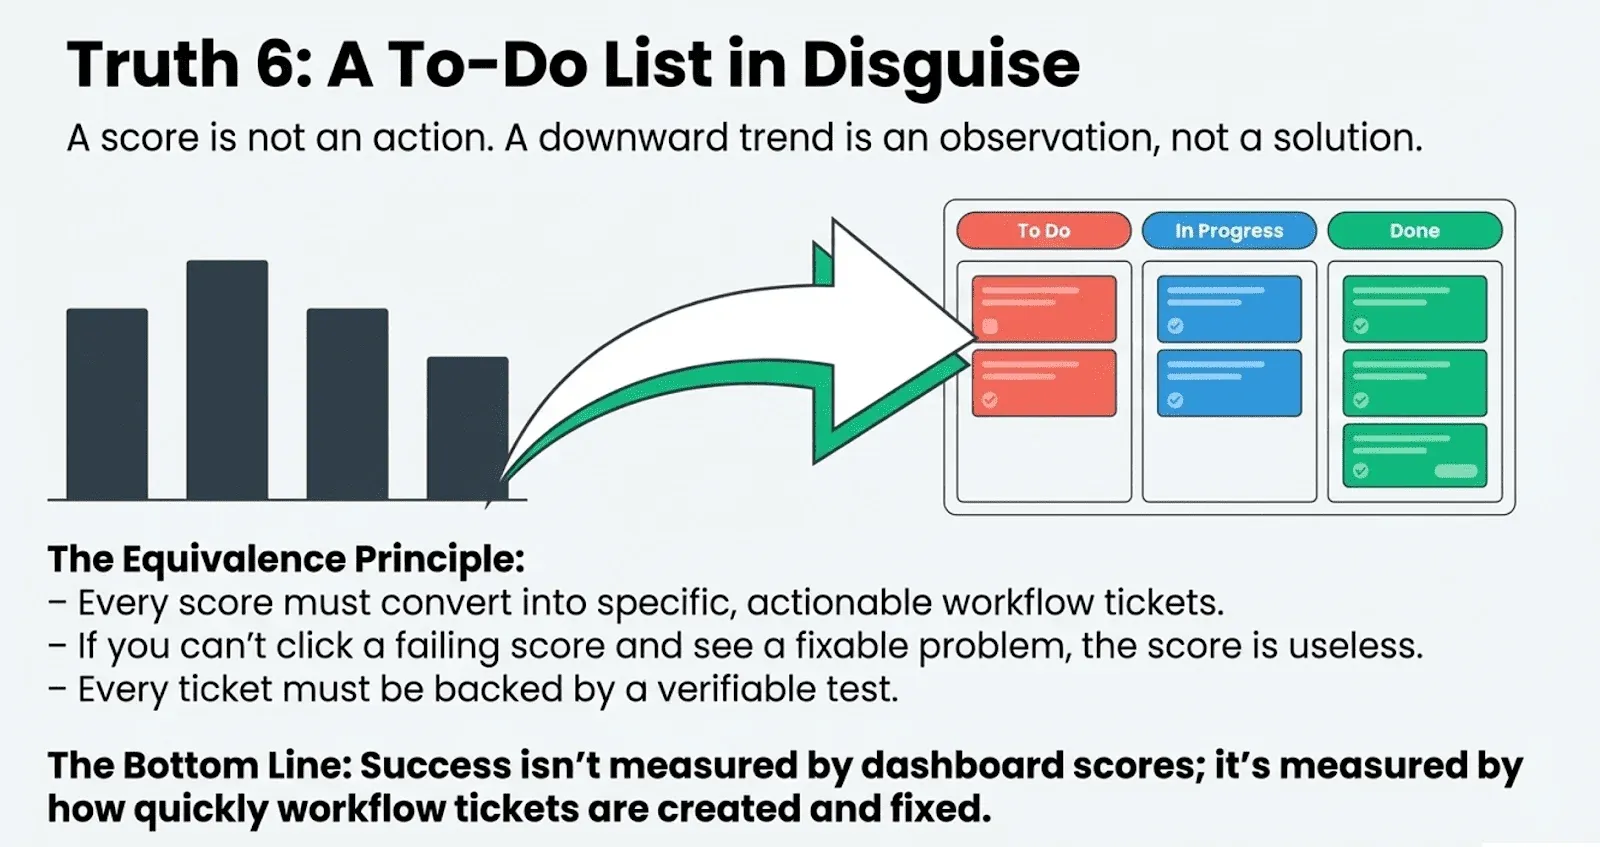
Effective dashboards must be built from discrete, concrete actions. Their foundations are data quality test results, not fuzzy math based on profiling. This idea is formalized in the Data Quality Dashboard — Data Quality Test Results Equivalence Principle, which states two things:
Every score on a data quality dashboard must be convertible into a series of actionable workflow tickets. If you can’t click a failing score and see a list of specific, fixable problems, the score is useless.
Every workflow ticket must be supported by a specific test that both demonstrates the issue and can be used to verify the fix. This ensures every problem is real and every solution can be proven.
This principle changes how we think about dashboards. For the most action-focused teams, the “dashboard” isn’t a set of charts; it’s the workflow itself. Success isn’t measured by scores but by how quickly tickets are created and fixed.
Move From Scorekeeper to Changemaker
Improving data quality isn’t about finding the perfect metric or building the most detailed dashboard. It’s about changing your mindset—from being a passive scorekeeper to an active influencer and changemaker.
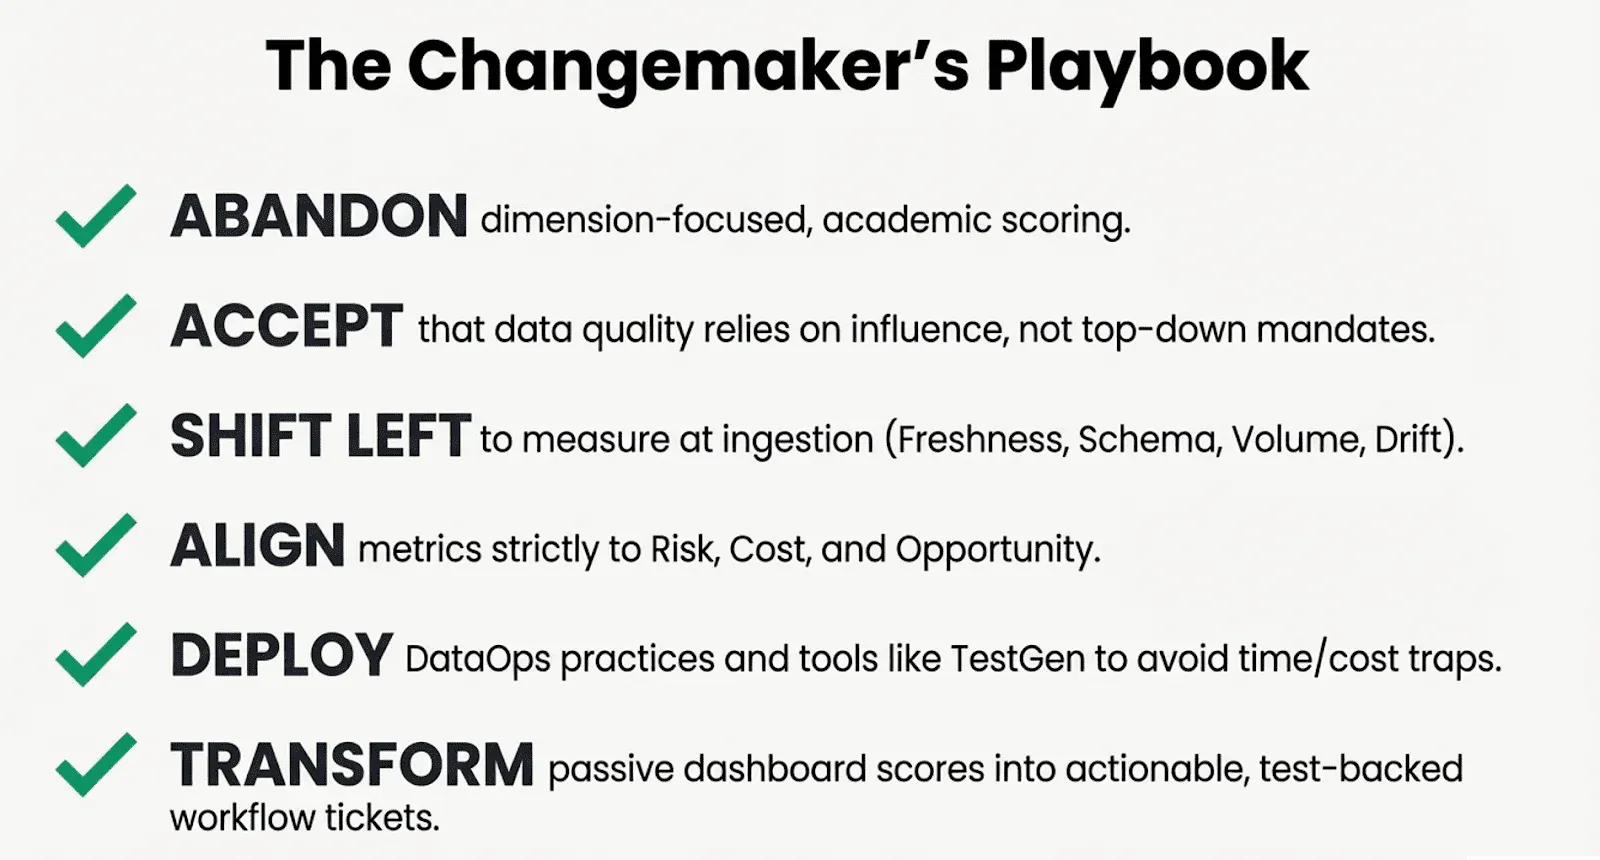
This means leaving behind the one-size-fits-all, dimension-focused method. It means spotting data problems at delivery before bad data reaches your warehouse. It means linking quality metrics to what different stakeholders care about. It means moving quickly while keeping costs low using a DataOps mindset and open-source tools. Most importantly, it means making sure every insight leads to clear, actionable tasks that can be assigned, tracked, and fixed.
When your dashboard becomes a source of clear, prioritized work, you finally have a true engine for change.
Instead of asking “What’s our data quality score?”, what if the only question that mattered was, “Whose job did we make easier today?” What would you build then?
Frequently Asked Questions, TLDR;
What is the summary of this blog?
Most data quality dashboards fail because they’re built by technologists for technologists, measuring abstract dimensions like completeness and consistency that mean nothing to business stakeholders. Data quality is fundamentally an influence problem, not a technical one — leaders must persuade others to act rather than mandate change. Dashboards should monitor data at ingestion, not after it lands in the warehouse, checking freshness, schema, volume, and drift before bad data corrupts downstream systems. To drive action, metrics must connect to what specific stakeholders already care about — risk, cost, quarterly goals — rather than generic scores no one owns. Different dashboard types (CDE-focused, business goal-focused, data consumer-focused) succeed because they speak directly to a particular audience’s motivations. Speed and cost matter: dashboards that take months to build or require expensive enterprise platforms die before they deliver value, making open-source tools like TestGen a smarter starting point. The most effective dashboard isn’t a scorecard — it’s a to-do list, where every failing metric converts directly into a specific, assignable, fixable ticket. The real measure of success isn’t a quality score but how quickly problems get identified, assigned, and resolved.
How Does TestGen Help?
TestGen is an open-source data quality tool built by DataKitchen and licensed under Apache 2.0. It is designed to get a team from zero to a working, test-based data quality dashboard in hours rather than months. TestGen auto-profiles your data to automatically generate an initial test suite, eliminating the need to write custom profiling logic from scratch. It provides a clean UI for managing and monitoring test results, making quality insights accessible to both technical and non-technical users. TestGen integrates with the broader DataKitchen Observability platform for pipeline-level monitoring, covering both data quality and data delivery. Because it carries no licensing fees, it avoids the cost trap that kills many enterprise data quality programs before they deliver value. Its approach reflects DataOps principles: short delivery cycles, rapid iteration, and continuous feedback rather than one-time infrastructure projects. Teams that start with TestGen typically have their first real quality insights before the end of their first day.
Where Can I Learn More?
DataKitchen recently hosted a Masterclass in the Six Types of Data Quality Dashboards, showing how to build all six dashboard types in under an hour using 100% open-source tools. The companion blog article on the Six Types of Data Quality Dashboards goes deep on how each dashboard type serves a distinct organizational goal, from CDE compliance to business goal alignment to data consumer empowerment. Both resources are practical starting points for teams ready to move beyond abstract quality scores and build dashboards that actually drive action.