Most of the data behind your launch came from someone else. IQVIA sent Xponent. Symphony sent claims. The specialty pharmacies sent dispense data on their own schedules, in their own formats, with their own idea of what a “week” is. You load all of it. Then you build the field report on top and hope the numbers hold.
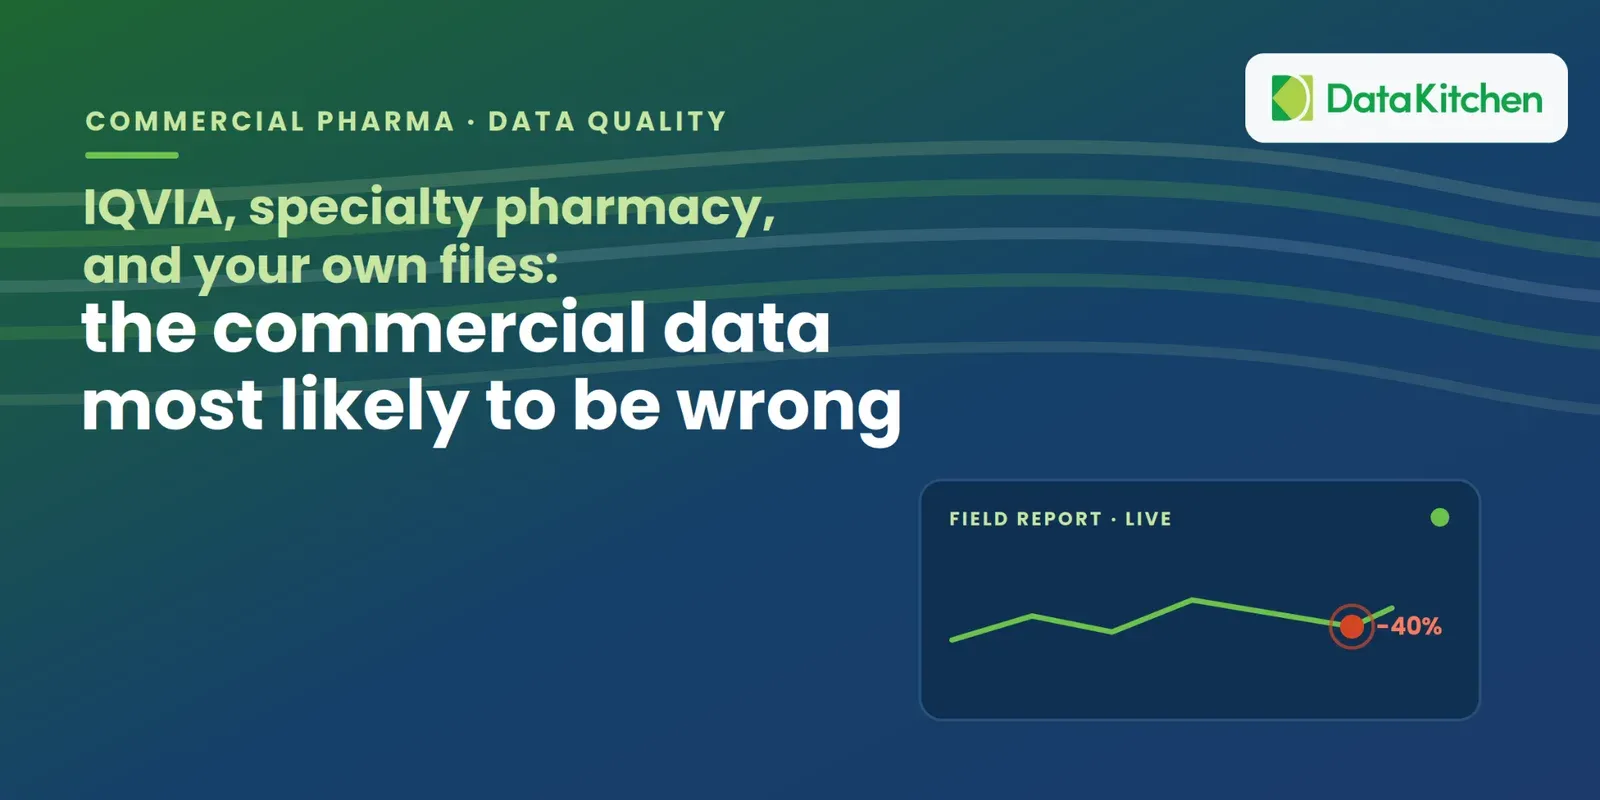
They don’t always hold. And the way you find out is a rep calling to ask why their territory dropped 40 percent overnight. Testing commercial pharma data is harder than anyone tells you, and it starts with the feeds themselves.
You own the number, not the plumbing
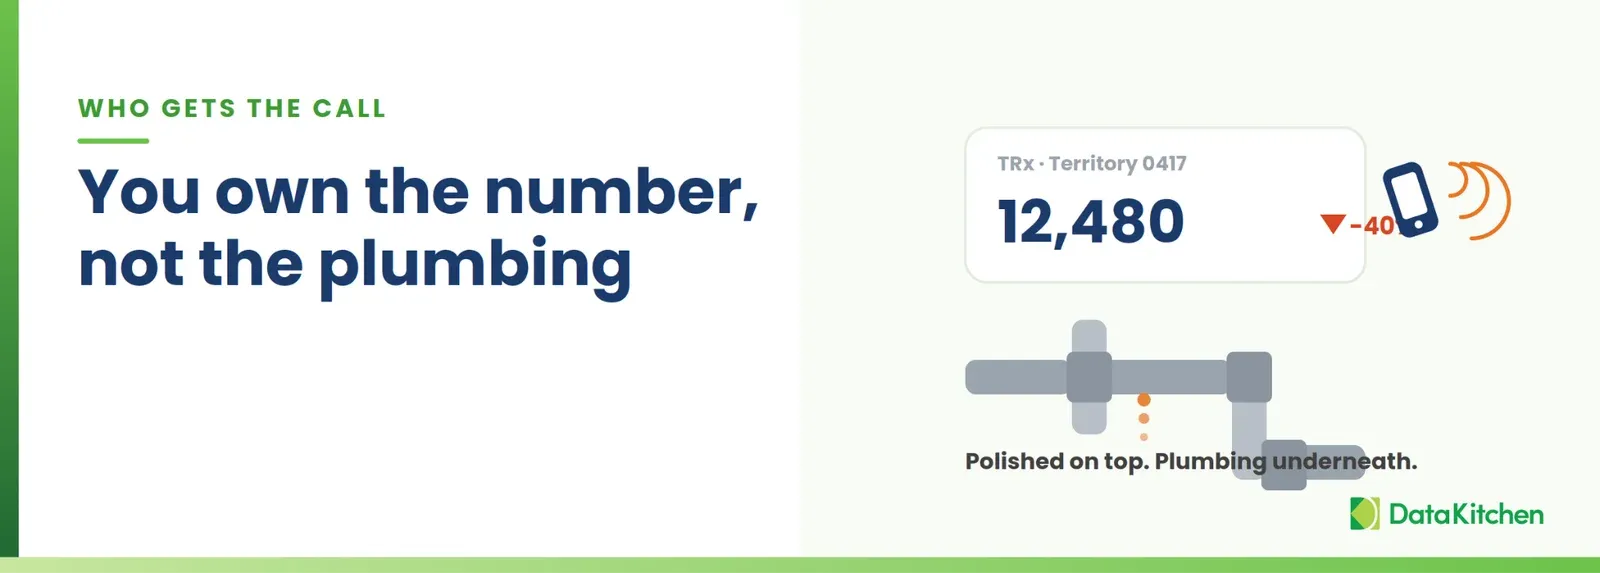
When the number is wrong, the brand team does not call your data engineer. They call you. And while that fire burns, your analysts spend the week reconciling files by hand rather than identifying the next access opportunity. The problems below look technical. Every one of them is yours. It helps to know what they look like.
The landmines
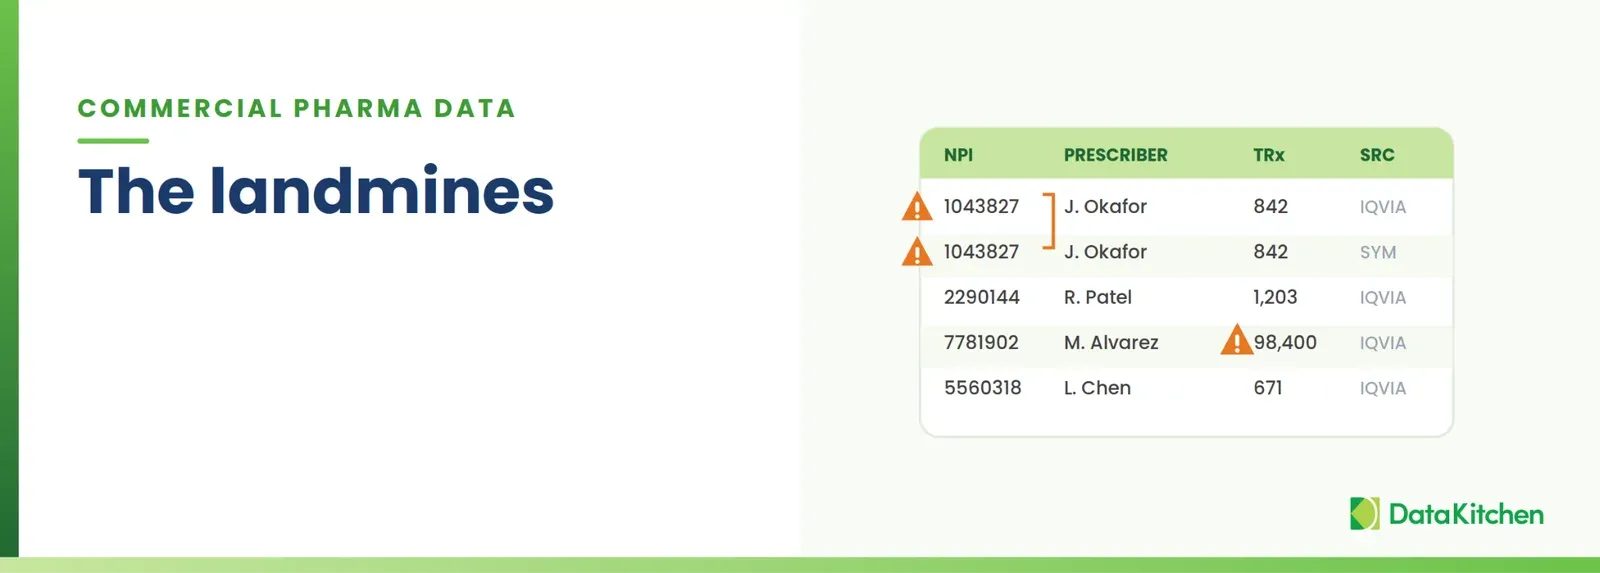
Two physician files, one truth, and they disagree. You get prescriber data from multiple sources. IQVIA says Dr. Smith wrote 30 scripts. Your MDM says Dr. Smith and Dr. Smith are two different people. Now your targeting list has a ghost and your alignment double-counts. Nobody notices until the incentive comp run, and then everybody notices. A transposed NPI does the same damage from the other direction, and it passes a ten-digit pattern check every time.
The vendor restated last quarter without telling you. Third-party sales data is part actual, part projection. The vendor backfills the gaps with an algorithm. Next month they get better inputs and rerun it. Your actuals from last quarter quietly changed. The trend line you showed the VP last week is now different. Same query, different answer.
The decimal moved. A quantity column arrives as units one month and as packages the next. Or a price lands in cents instead of dollars. One product shows a 10x jump, and the dashboard renders it as a heroic sales week. It was a unit-of-measure change nobody flagged.
Half the file showed up. The specialty pharmacy feed is supposed to have 40,000 rows. Today it has 26,000. The load succeeded. No error. The pipeline is green. Your dispense numbers are just wrong, and everything downstream inherits the hole.
The vendor renamed a column. Last week it was RX_CNT. This week it’s RxCount. Your transform maps the old name, finds nothing, and fills the field with nulls. The pipeline doesn’t fail. It produces a clean, well-formatted, completely empty metric.
Specialty pharmacy data is the worst of it
If the vendor feeds are messy, specialty pharmacy data is the mess with another mess stacked on top. A retail brand pulls prescription data from one or two big aggregators. A specialty brand pulls it from the network of specialty pharmacies that actually dispense the drug, and that network can be a dozen pharmacies or more. Each one sends its own file, on its own schedule, in its own format.
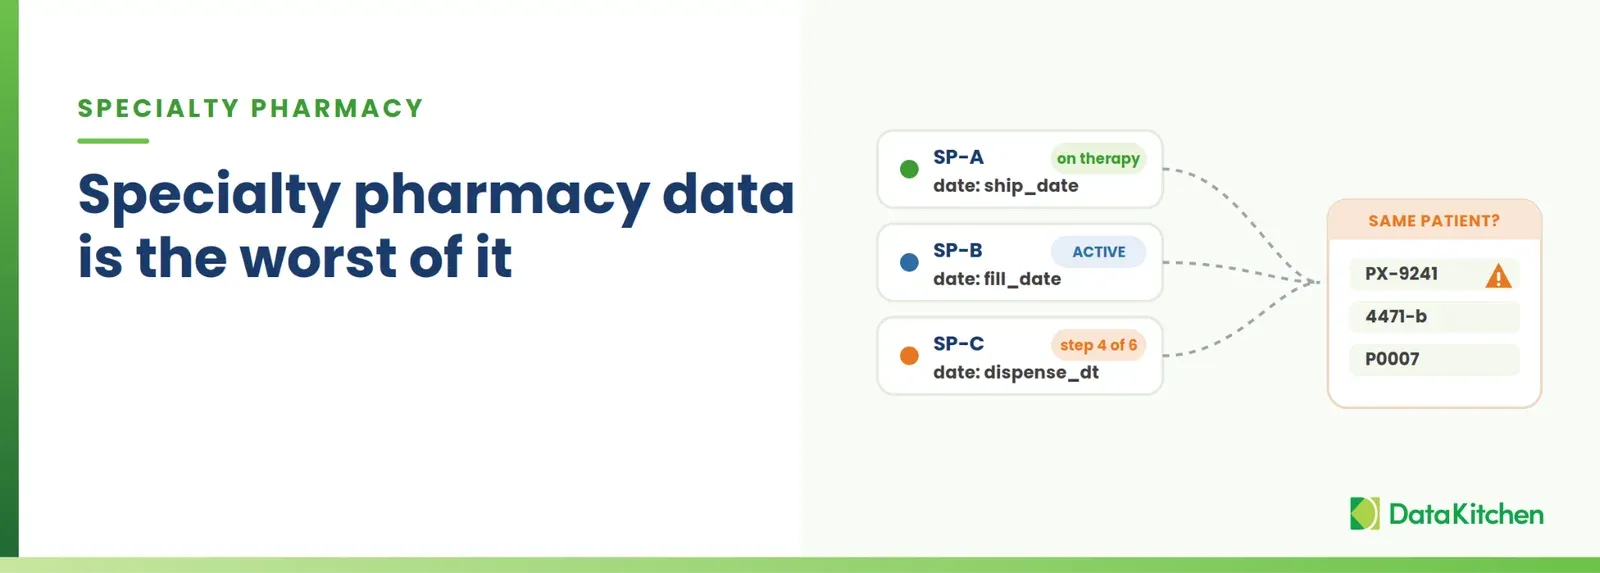
None of them agree on what the words mean. One pharmacy’s ship date is another’s fill date is another’s dispense date. One counts a referral the day it arrives, the next counts it the day benefits clear, the third counts it when the first box goes out the door. Patient status is worse. One calls it on therapy, another calls it active, a third has six sub-statuses you have never seen and no way to map them to anyone else’s. You are supposed to stitch all of it into one patient journey, and the pieces were cut by different hands.
Then there is the patient key, or the absence of one. Specialty pharmacy data is often your only window into patient-level activity, because a limited-distribution drug has no retail claims to fall back on. But each pharmacy de-identifies patients its own way, so the same patient can show up three times under three tokens and you cannot tell. Your adherence rate, your time to fill, your discontinuation curve all sit on top of that.
Here is the part that makes it dangerous. Nobody owns this data. It lands on an analyst who is already doing three other jobs, who opens the files, does their best in a spreadsheet, and moves on. Specialty pharmacy integration is almost always somebody’s afterthought, right up until it becomes the number the access team is betting the launch on.
What each of these costs you
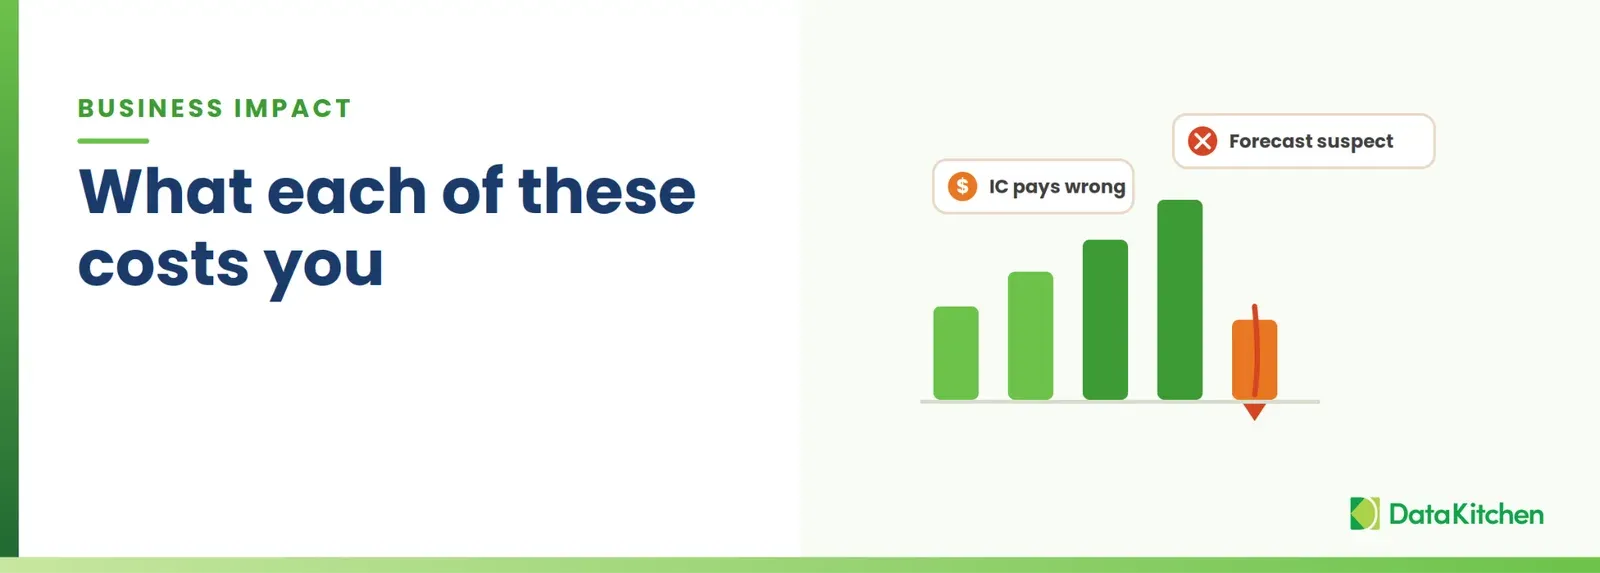
None of these is a rounding error. A duplicated prescriber splits credit across two records, and your incentive comp run pays the wrong reps. A silent restatement moves a number you already briefed to leadership, and every forecast built on it is now suspect. A unit-of-measure jump sends the field chasing a spike that never happened. A half-loaded specialty feed hides real patients from the access team during the weeks that matter most. Every feed a commercial launch runs on fails in its own particular way, and we catalogue them in a feed-by-feed inventory of commercial pharma data sources.
Launch is where this hurts worst. The first year sets the trajectory a brand rides for the rest of its life, and you get one chance at the field’s trust. One wrong territory number and the reps stop believing the dashboard. After that, they run on gut, and the platform you paid for is furniture. Good commercial pharma analytics starts with the data the field believes in.
There is a second cost, quieter than the first. Reconciled data is defensible data. When a rep disputes their comp, you need to show the number held. When leadership challenges a forecast in the business review, you need to show the history did not move under you. And if your company is the acquisition target your investors are hoping for, the data behind your commercial story has to survive due diligence. A reconciliation trail on every feed is what turns “trust me” into “here is the check that passed.”
It does not have to go this way. One commercial launch platform, behind a brand later acquired for $14 billion, ran on roughly one and a half engineers and had field reporting live six months before launch day, because the checks caught the bad loads before anyone downstream saw them. The launch case study has the numbers. The difference was not heroics. It was reconciliation on every feed.
Test instead of trust
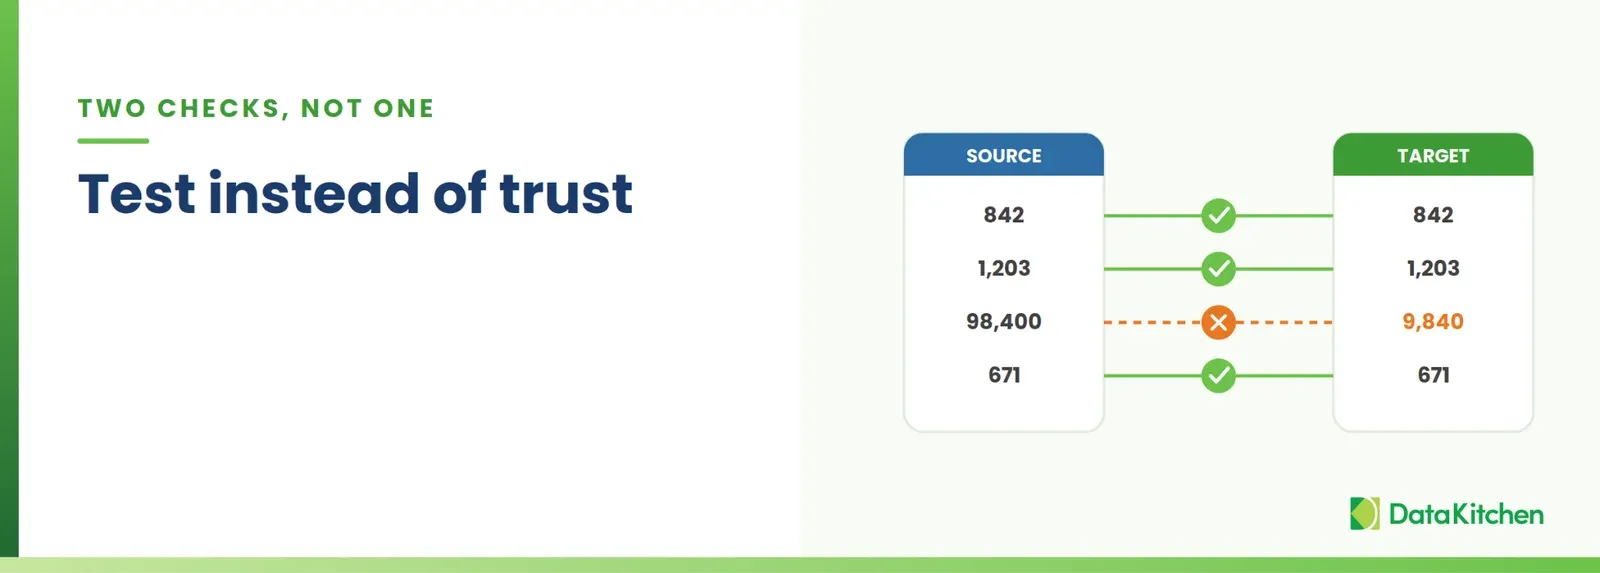
You have to check two things, not one: that the file arrived intact, and that last month’s history did not change underneath you. Most teams check the first and skip the second. The rest of this section is how.
The first check is extract to load. Did the file arrive intact? This one is deterministic, and it should be exact. Count the rows in the vendor’s control record and in your staging table; if they match, the load is correct; otherwise, the load is wrong. Sum the amount column on both sides to the penny, at fixed precision, so two engines don’t disagree over floating point. Confirm the max load date is today, not three days ago. When the vendor gives you no control count, fall back to an expected range instead of a fixed number, because a specialty feed legitimately shrinks on a holiday week. A count of 26,000 against a normal 40,000 is not automatically wrong, but it is automatically worth a look.
These checks run in seconds and catch partial, stale, and truncated files before anyone opens a dashboard. When one fails, the load stops in staging and never reaches the mart. That is the point of a two-stage architecture: bad data needs somewhere to fail that the field never sees.
Row counts and sums tell you the totals line up. They don’t tell you that the rows are the same. Two files can carry identical counts and identical sums and still be full of swapped values. To catch that, you fingerprint each row in the source, fingerprint it in the target, and compare them. If a value changed, the fingerprint changes, and you see exactly which rows drifted.
The check most teams skip
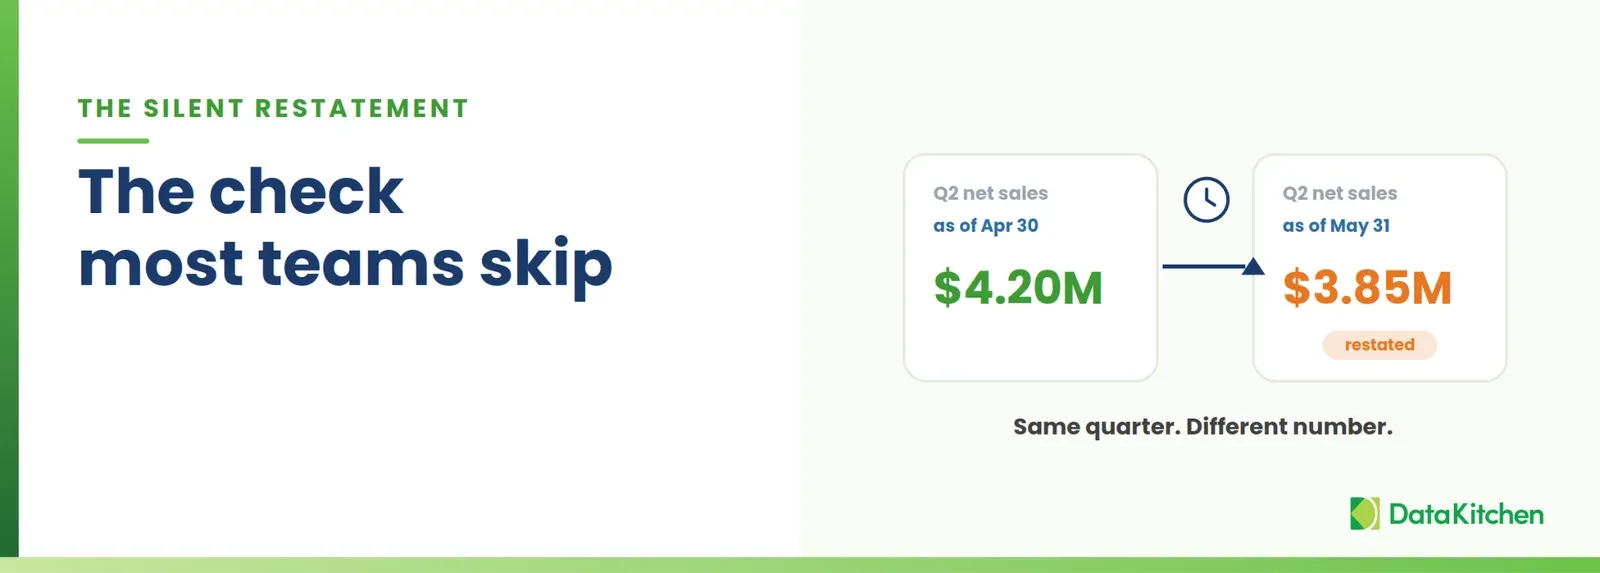
Extract-to-load reconciliation assumes last month’s history remains last month’s history. In commercial pharma, it often does not. Third-party sales data gets rerun when the vendor receives better inputs, and your Q2 actuals change inside a file that loads perfectly. Source and target agree. Every deterministic check passes. And the number you briefed to leadership is now different.
The only way to catch that is to remember what the vendor told you before. Keep a snapshot of each period as you received it. When the next file lands, diff the overlapping periods against the snapshot. Expected corrections get reviewed and accepted. Silent rewrites get flagged before they reshape a trend line under you. This is the check most teams skip, and it is the one that protects your credibility with leadership. A commercial insights leader at Celgene reduced errors to about one per quarter and held it there for years. That is what disciplined reconciliation buys you.
The foundation your AI actually needs
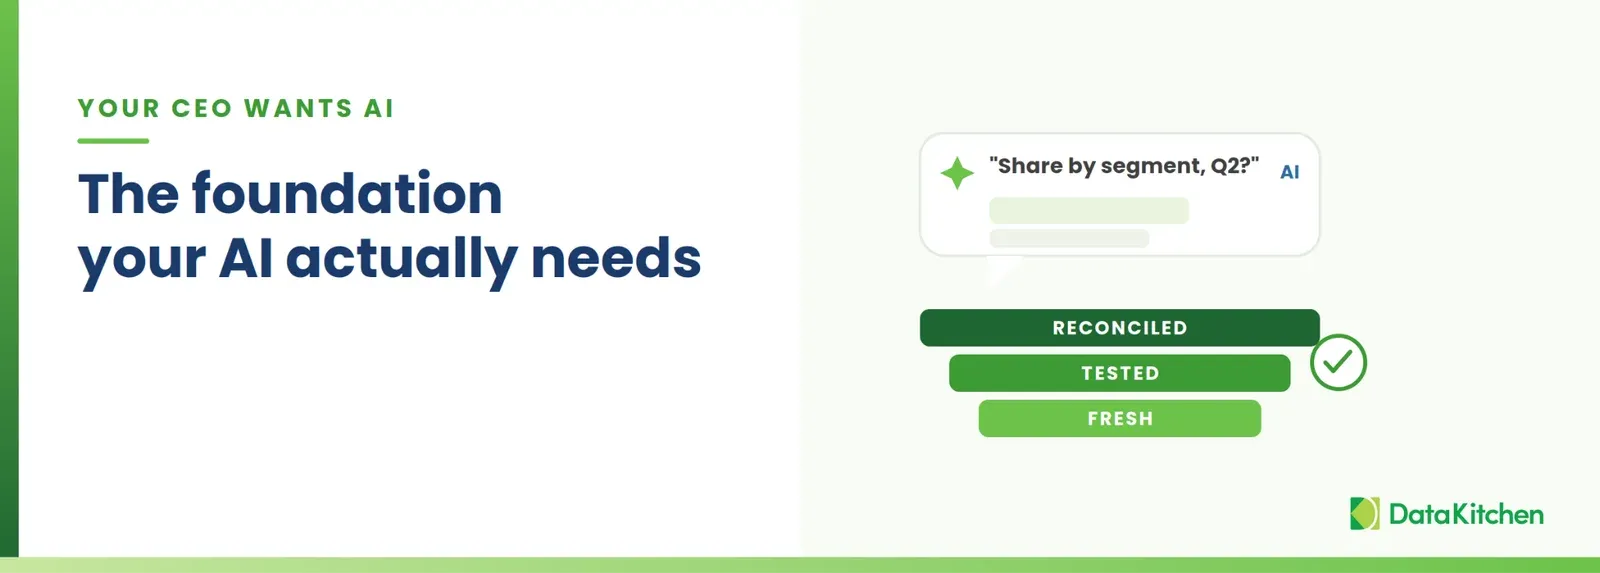
Your CEO wants AI, and you are the one who has to deliver it. Here is the part nobody says out loud. Your Snowflake Cortex Analyst or Databricks Genie cannot answer a real commercial question until the underlying data is right. Ask it for share by segment on top of an unreconciled feed, and it will answer with total confidence and be wrong, which is worse than not answering at all.
Reconciliation is not separate from your AI mandate. It is the first step of it. Trust in the data is what turns an AI demo into an AI answer, and it is the Data Trust half of AI success.
Where Open Source TestGen fits
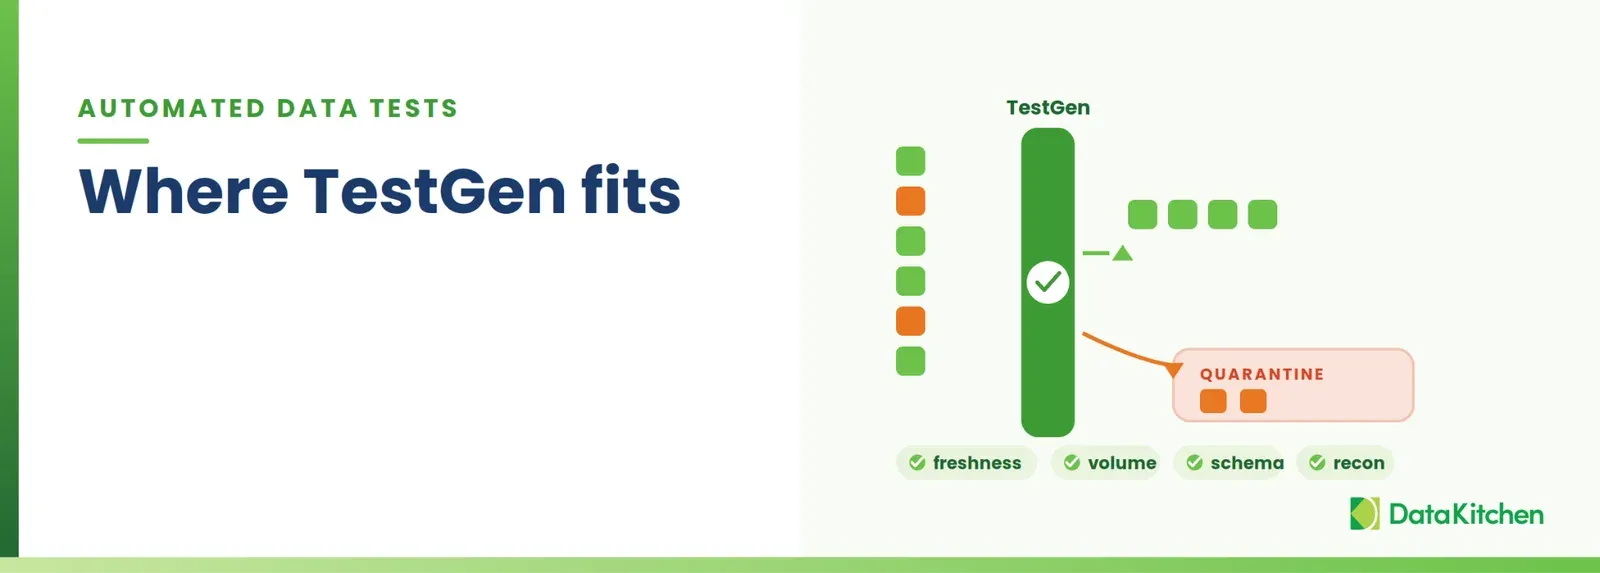
This is what TestGen does on commercial pharma feeds. It profiles the file first, so you see the shape before you write a single test: row count, value ranges, null rates, the patterns in each column. The odd stuff shows up right there. A quantity column with a value 10x the others. A duplicate on a key that is supposed to be unique. A date column with three formats living inside it.
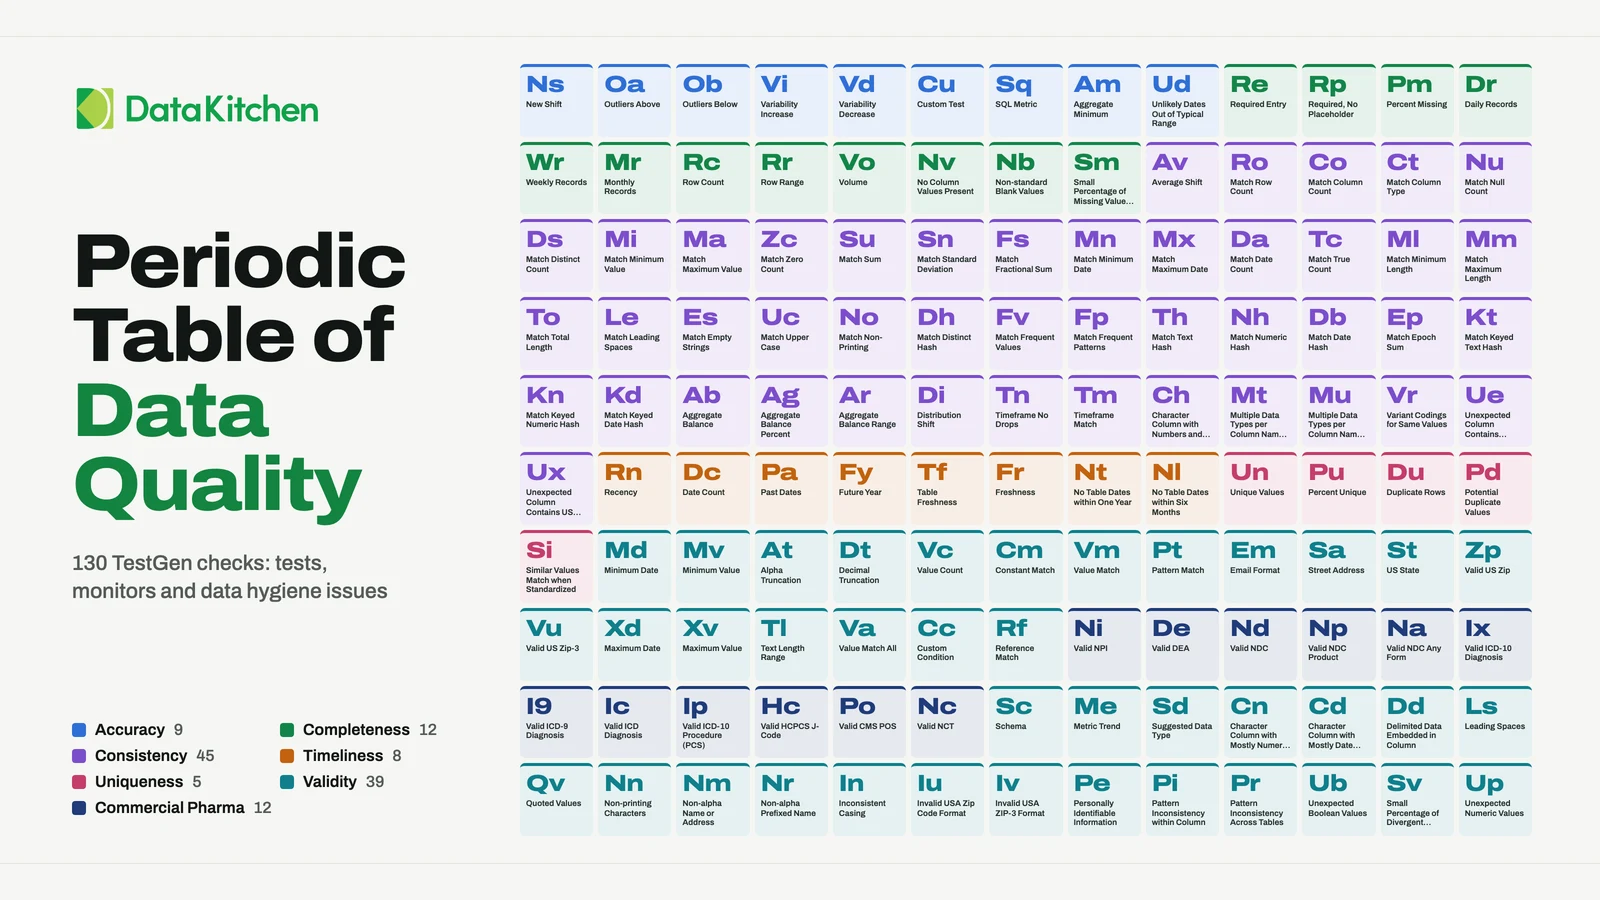
Then it generates the tests. Freshness. Volume, as a range when you have no control count and an exact match when you do. Schema drift, so a renamed column fails loudly instead of filling nulls. And where a column carries an identifier, shape is not validity: the Commercial Pharma pack in TestGen Enterprise generates twelve tests that check NPI, DEA, NDC, ICD, HCPCS J-codes and CMS place-of-service codes against their own specifications, check digits included. You won’t catch these landmines by reading the data. There is too much of it, and it changes every day. You catch them by automatically checking every load against the source and every period against the last one you kept before the field report goes out.
The rep will still call. Just not about your data.
Or hand it to a team that does this all day
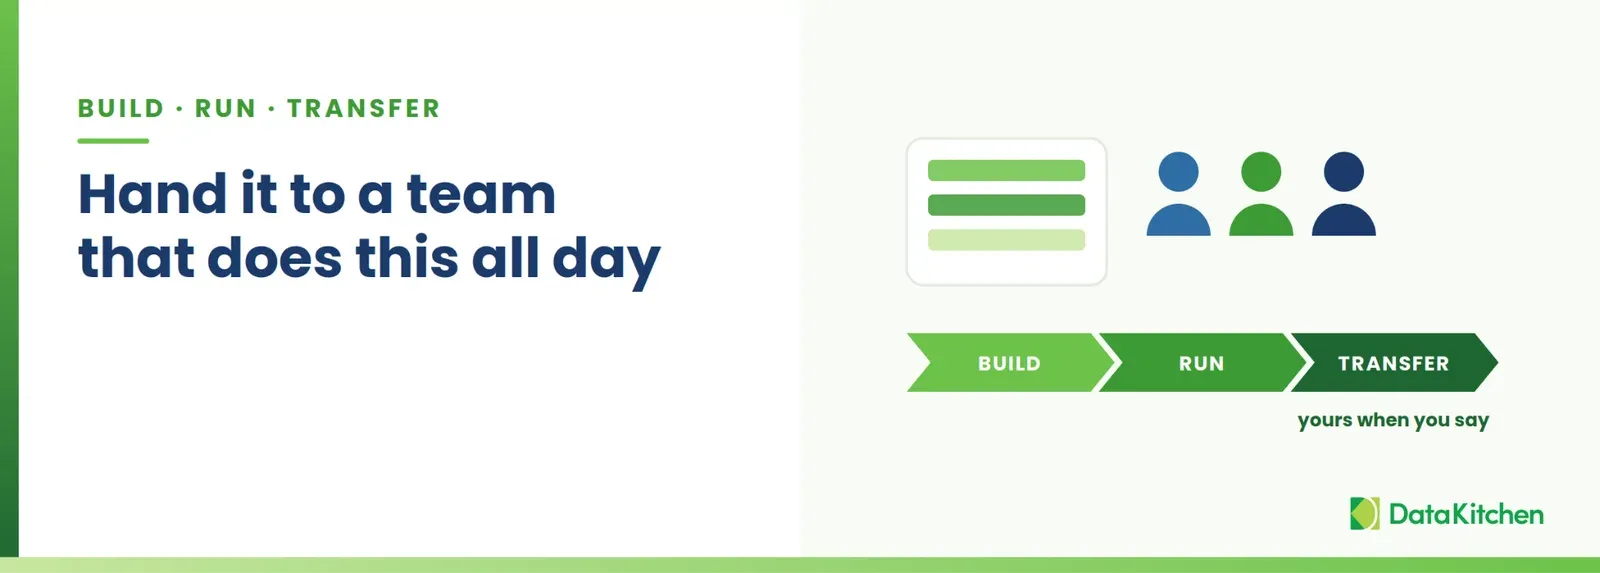
You can build all of this yourself. Extract-to-load checks, snapshot diffs, portable comparisons, a reconciliation test on every vendor feed, and a staging gate that quarantines bad loads. Or you can let your scarce engineers keep writing plumbing while the analytics queue backs up, which is how most pharma data teams spend 80 percent of their time.
There is a third option. Bring in a commercial pharma data engineering team that has already built this. We embed engineers in your standup, not contractors in an SOW. We build the platform your launch needs, run it through launch day and the first year, and fix what breaks before the field sees it. Reconciliation on every IQVIA, Symphony, and specialty pharmacy feed is part of the build, not a phase two nobody gets to. One small pharma cut its data costs by 58% when we replaced its existing setup. The software underneath is Apache 2.0 and lives in your cloud repo. When you want to take it over, you do.
Here is the test. If you cannot answer whether every IQVIA row landed last night in under a minute, this is already happening to you. Tell us about your launch, and we’ll show you what reconciliation looks like across your feeds, stack, and cloud.
FAQ
What are the key points in this blog?
Commercial pharma runs on data you did not create, arriving from vendors on their schedule and in their format. The failures are specific and repeatable: half a file arriving, restatements that look like growth, and territory realignments that make a rep’s numbers drop overnight. The way you usually find out is a phone call from the field.
What commercial pharma data is most likely to be wrong?
The purchased and third-party feeds: specialty pharmacy dispense data, claims, syndicated market data, and 3PL reports. You did not create them, cannot control their schedule or format, and they change without notice. Internal CRM data is easier to govern; vendor feeds are where the surprises live and where the visible numbers come from.
How do you catch a partial file from a specialty pharmacy?
Test the row count against the feed’s own history rather than against a fixed threshold. A file that should carry 40,000 rows and arrives with half looks structurally perfect: every row valid, nothing null, schema unchanged. Only a volume check against what normal looks like for that feed catches it before the numbers go out.
Why do territory realignments break pharma reporting?
Because the underlying data is correct and the mapping changed. A rep’s territory drops 40 percent overnight, and nothing in the file is invalid. Alignment changes need to be tested as a relationship between the feed and the current mapping, not as a property of either one on its own.
What does a restatement look like in syndicated data?
Like growth. A vendor restates a prior period, one product shows a 10x jump, and the dashboard renders it as a heroic sales week. Nobody questions a number moving in the right direction, which is exactly why restatements survive review longer than obvious errors do.
How small are the teams running these platforms?
Smaller than the stakes suggest. One commercial launch platform behind a brand later acquired for $14 billion ran on roughly one and a half engineers. That ratio is why manual checking fails: the volume of vendor feeds far exceeds what the team can inspect by hand, and automated coverage is the only version that fits.