You run data for a commercial pharma brand team. Your platform pulls in CRM activity, specialty pharmacy dispense feeds, claims, patient services records, REMS data, 3PL reports, and a stack of syndicated datasets you pay a lot of money for. Every one of them lands on its own schedule, in its own shape, keyed on its own identifiers. And every Monday, someone asks why the market share number moved.
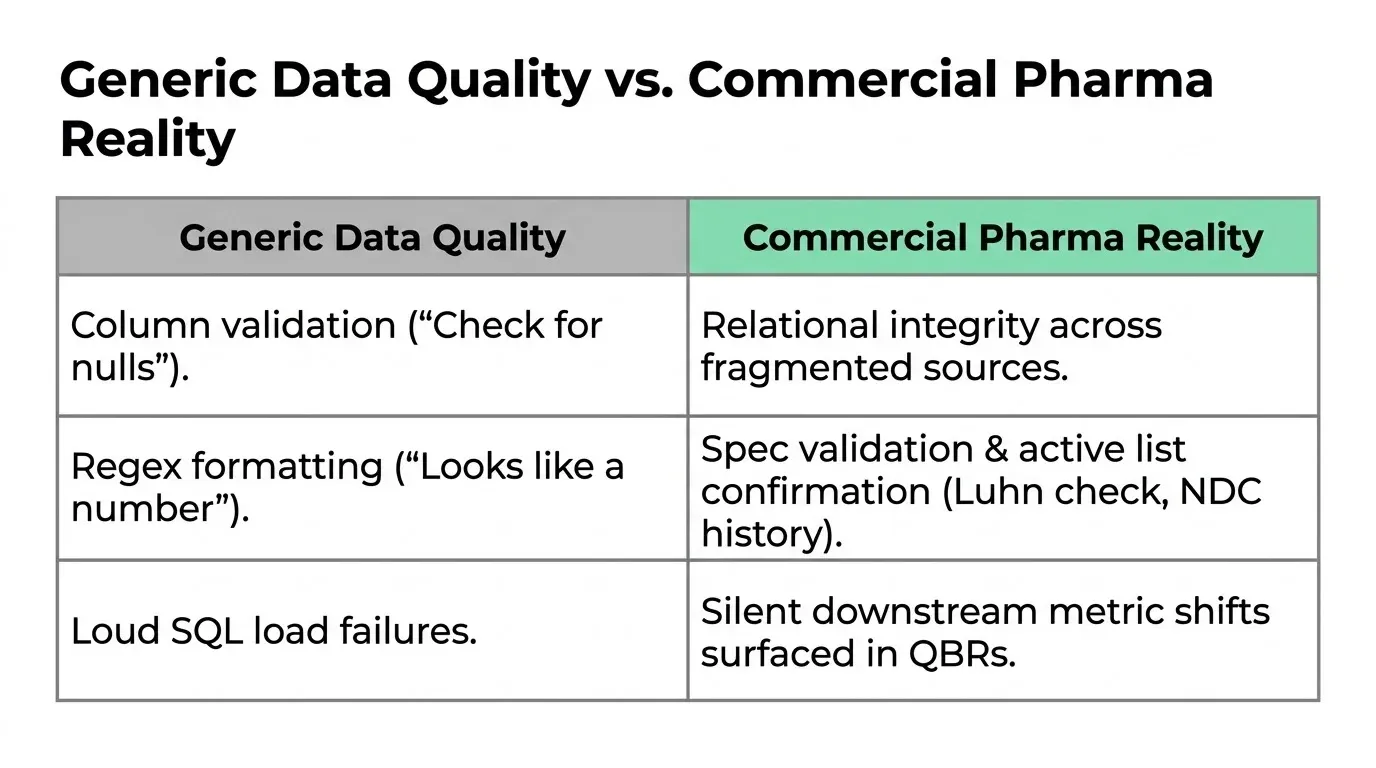
Generic data quality advice doesn’t help you much here. “Check for nulls” is not the problem. The problem is that commercial pharma data fails in specific, recognizable ways, and most testing approaches were built for a different data shape. Here are the challenges that actually bite, and at the end, a few things DataOps TestGen does about them. If you want the whole estate in one place, we keep a feed-by-feed inventory of commercial pharma data sources with the characteristic failure of each one.
Challenge 1: No single source is complete, so failures are relational
The picture of a prescriber, an account, or a patient gets assembled from several systems. Each one holds part of the truth. Each one disagrees with the others at the edges.
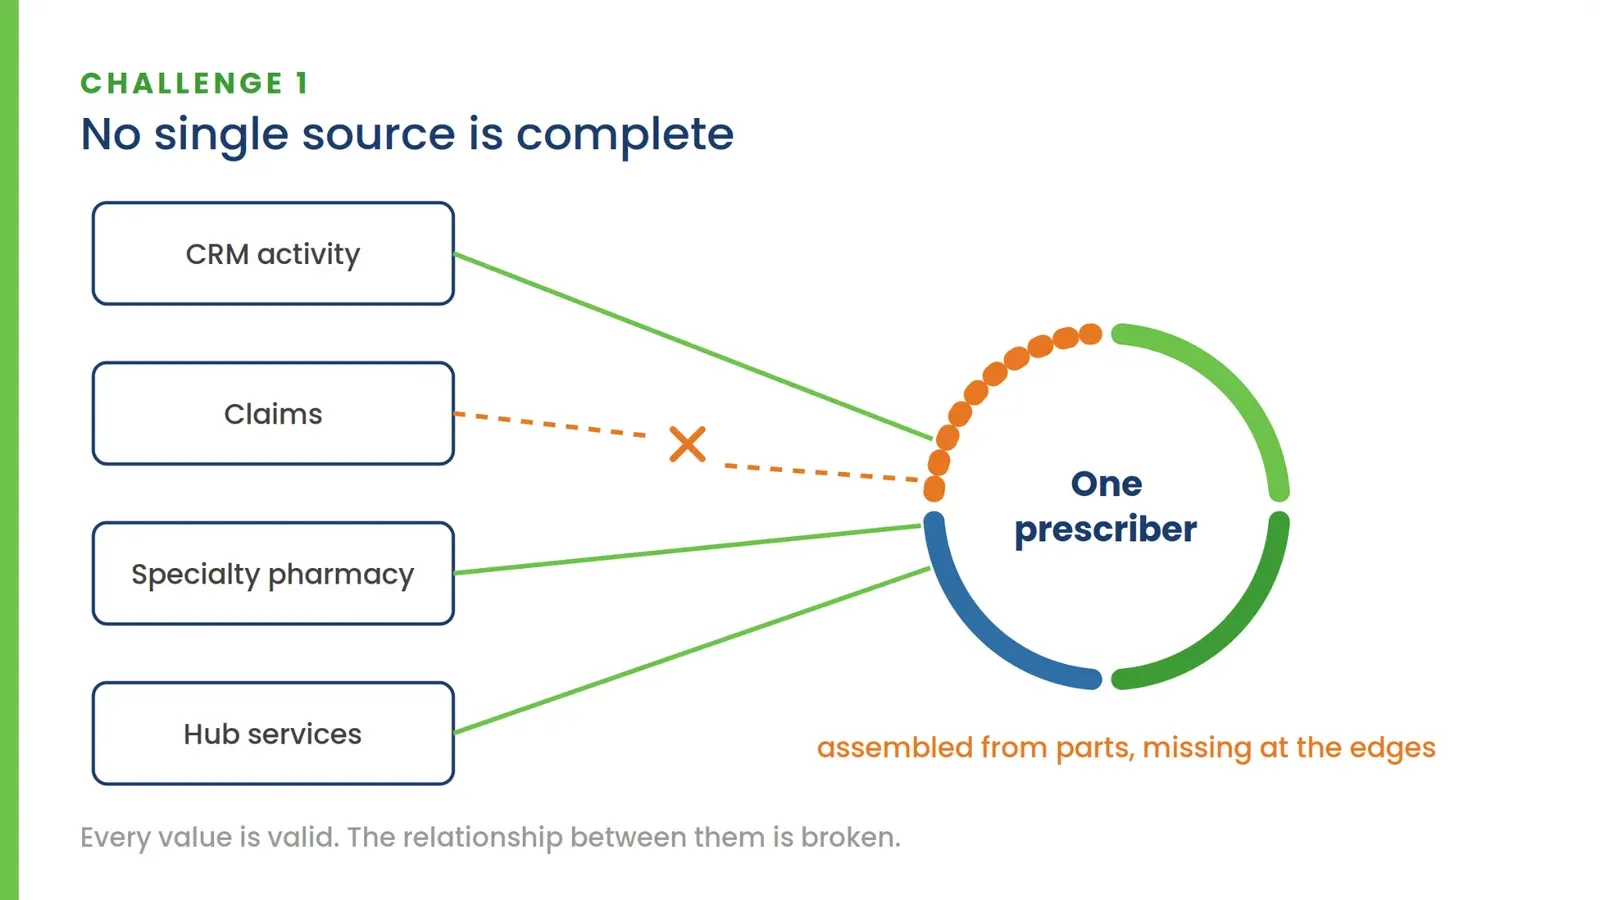
That means the failures that hurt you are relational, not scalar. A territory ID in the roster that doesn’t exist in the hierarchy. An account with sales activity that never made it into the account master. Two files from the same vendor run that disagree on their shared keys. A patient recorded in two active treatment states at once.
Column-level checks never see any of this. Every individual value is valid. The relationship between them is broken. If your testing stops at “is this field populated and formatted,” your integration layer is running blind.
And absence matters as much as presence. A provider withdrawn under a deletion request must remain gone. Suppressed entities and blocked identifiers must not reappear in a refresh. One cleanup pass doesn’t enforce that. Only a continuous check does.
Challenge 2: Syndicated data fails in predictable ways that generic checks can’t see
Purchased data feeds your most important analytics and produces your most characteristic failures. Feed for feed, it is the commercial data most likely to be wrong, because you did not create it and cannot control its schedule or its format. The failure modes repeat.
A weekly file should arrive exactly once per week. A monthly file, once per month. Feeds go missing. Feeds get loaded twice. A delivery arrives at half its normal size because the vendor had a bad extract. None of this throws an error. The load succeeds. The numbers are wrong.
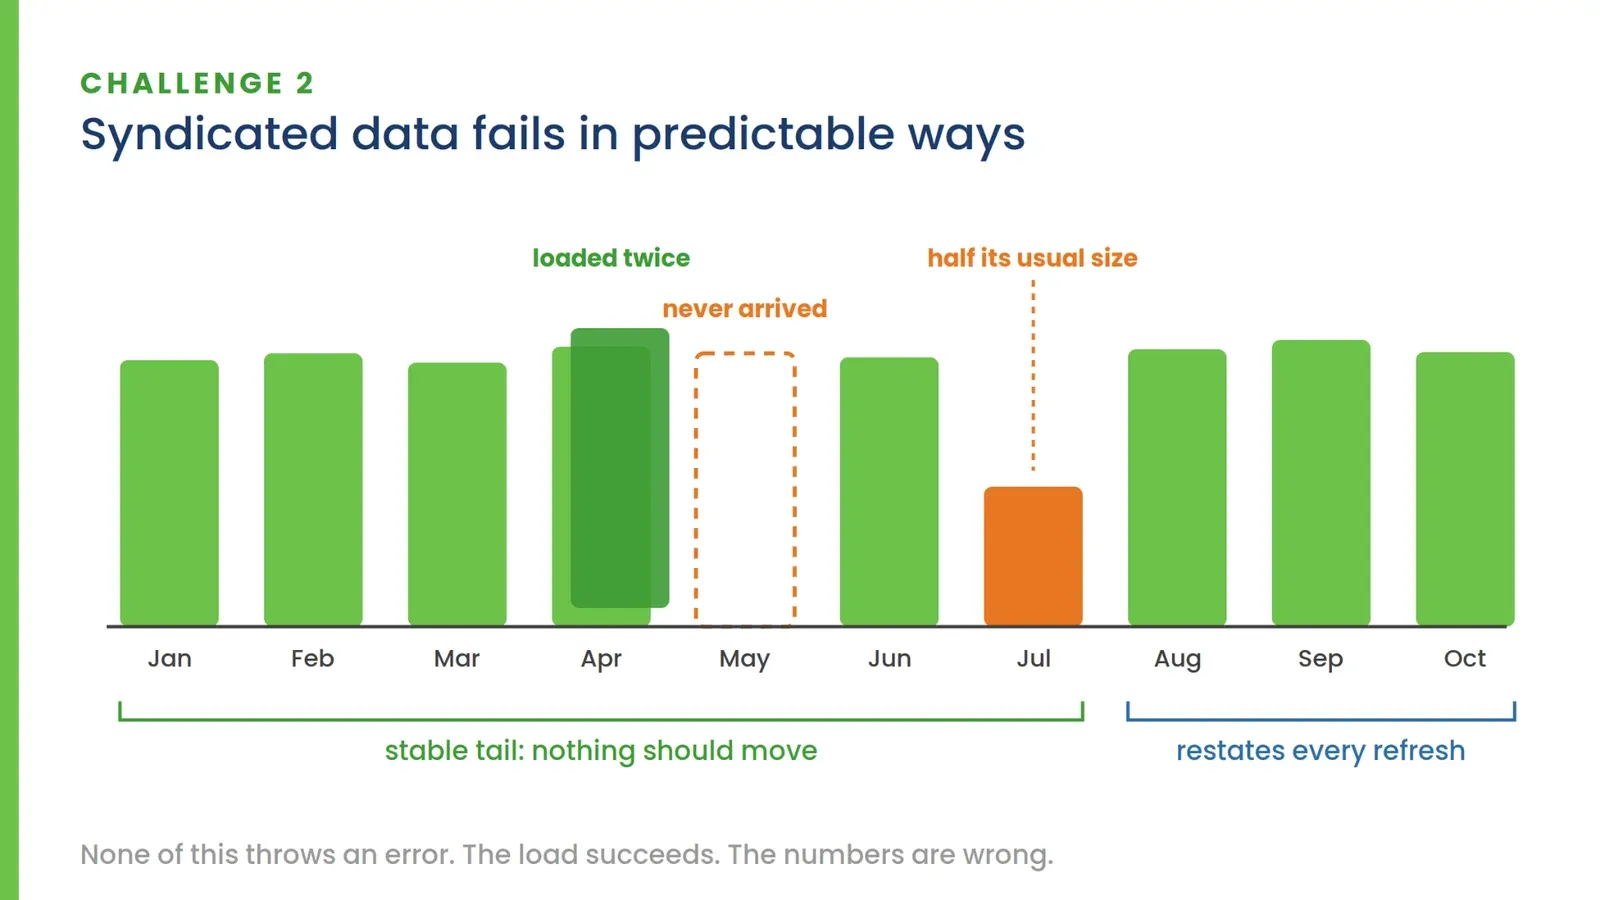
Then there’s restatement. Many syndicated products revise the most recent months on every refresh, while older periods remain fixed. So a naive “nothing should change” rule fires constantly in normal behavior. Ignoring change entirely misses real breaks. You need checks that distinguish between an expected restatement window and a genuine problem in the stable tail.
Shape shifts are the sneakiest. A sudden change in the mix of payer types, specialties, or geographies usually means a mapping regression upstream, not a real market movement. By the time a brand analyst notices, the wrong number has been in three meetings.
One practical trap on top of all this: vendors love wide formats, with time periods spread across columns. Wide files defeat most trend logic. Normalize them into long format at your refined layer before you try to monitor volume, freshness, or distribution. Test after the normalization, not before.
Challenge 3: Identifiers that fail silently
NPI, NDC, DEA, ICD, HCPCS, and CMS place-of-service codes are the join keys of the entire commercial pharma ecosystem. Here’s the ugly part: a malformed identifier doesn’t error. It silently fails to join, and the damage surfaces downstream as a quietly wrong number with no obvious cause.
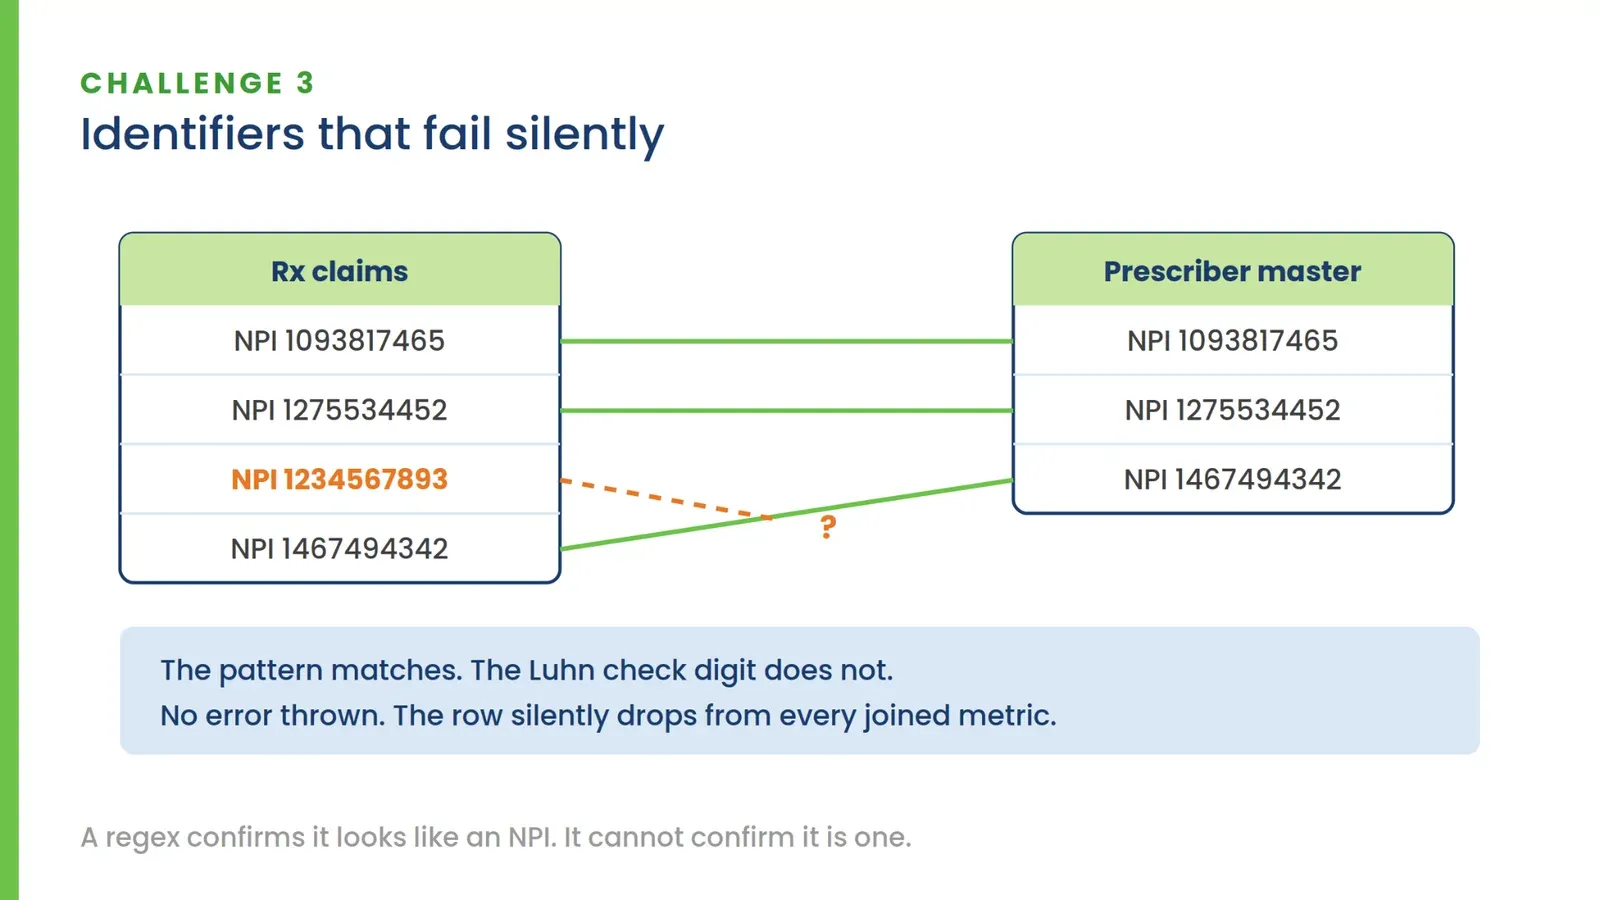
A regex can’t save you. NPI carries a Luhn check digit. DEA has its own checksum. A pattern match confirms the value looks like an NPI. It cannot confirm the value is a valid NPI. ICD-9 and ICD-10 look similar enough to confuse a generic format rule. And validity against the spec is only half the question. Whether an NDC is an active product, or a diagnosis code is in the current published set, requires checking against an authoritative external list that changes over time.
Most teams handle this with custom SQL that one person wrote in 2022, and nobody wants to touch.
Challenge 4: Each medallion layer fails differently
You’ve probably converged on some version of a medallion architecture: raw landing tables, refined and conformed layers, and gold datasets the business consumes. Testing only at the end means every failure surfaces at the layer where it’s hardest to diagnose.
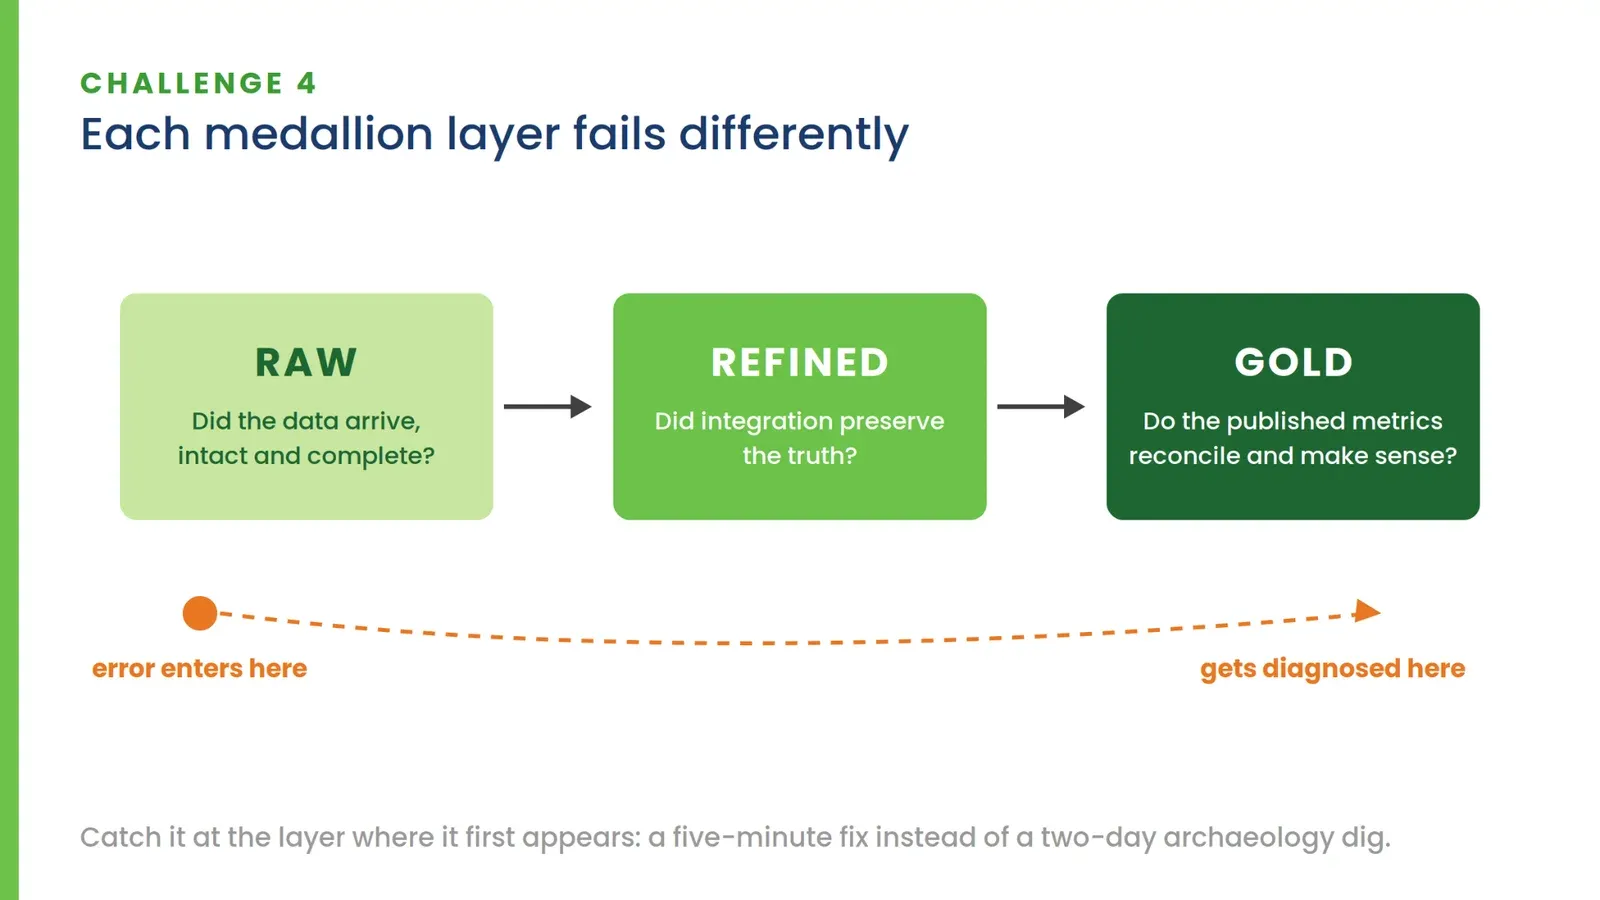
Each layer asks a different question. At raw: did the data arrive, intact and complete? In the refined layers: did integration and transformation preserve the truth? At gold: do the published metrics reconcile and make sense? A row count check at gold tells you something is wrong. It tells you nothing about which of forty upstream steps broke it. Catching the error at the layer where it first appears is the difference between a five-minute fix and a two-day archaeology dig.
Challenge 5: Gold datasets have internal logic, and that logic breaks
The gold layer is where quality problems cost the most because they’re least visible. The columns are all populated. The formats are all valid. The logic is wrong.
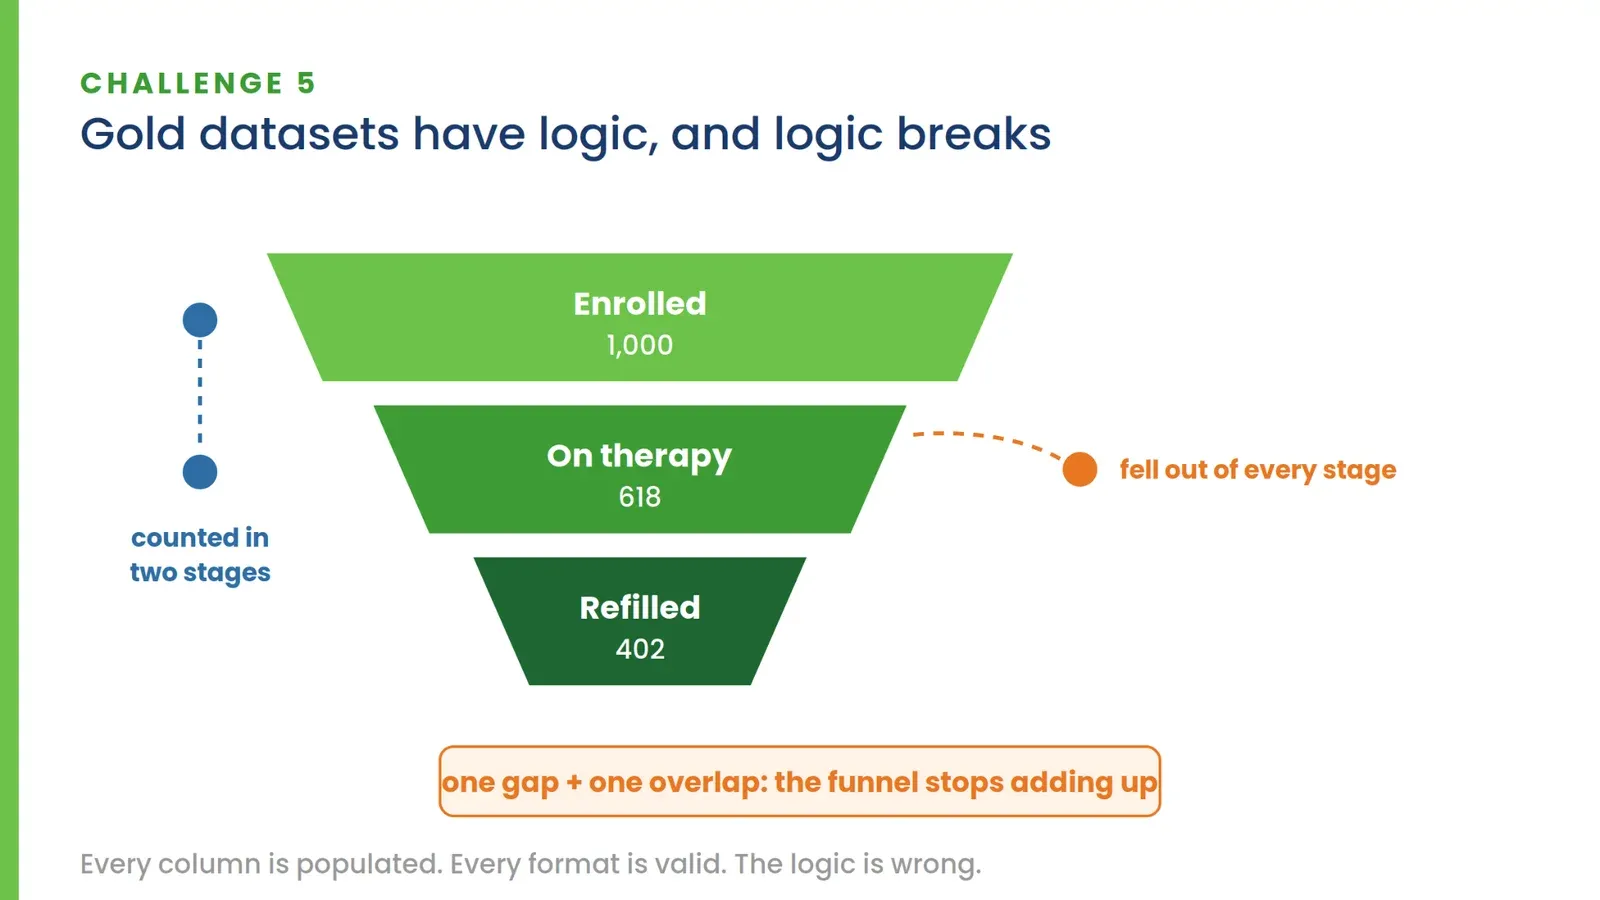
Waterfall and funnel metrics require that every record be in exactly one stage. A gap in the classification logic and records fall out of the funnel. An overlap and you double count. Either way, the funnel stops adding up, and someone finds out in a QBR.
Patient journey and treatment views need milestone dates in a valid sequence. A ship date before an enrollment date isn’t a format error. It’s a logic error, and only a test that understands the sequence catches it. Same story with published totals: they have to tie back to source detail, per grouping, on every run. The day an integration step starts dropping or double-counting rows is the day you want to know, not the quarter.
Challenge 6: You can’t hand-write your way to coverage
Here’s the challenge underneath all the others. A single commercial data platform spans dozens of sources and thousands of columns, and the surface grows with every new feed, vendor, and brand. Hand-writing a test per column is not a realistic plan. So you write tests where you expect trouble: the handful of fields someone remembered to guard.
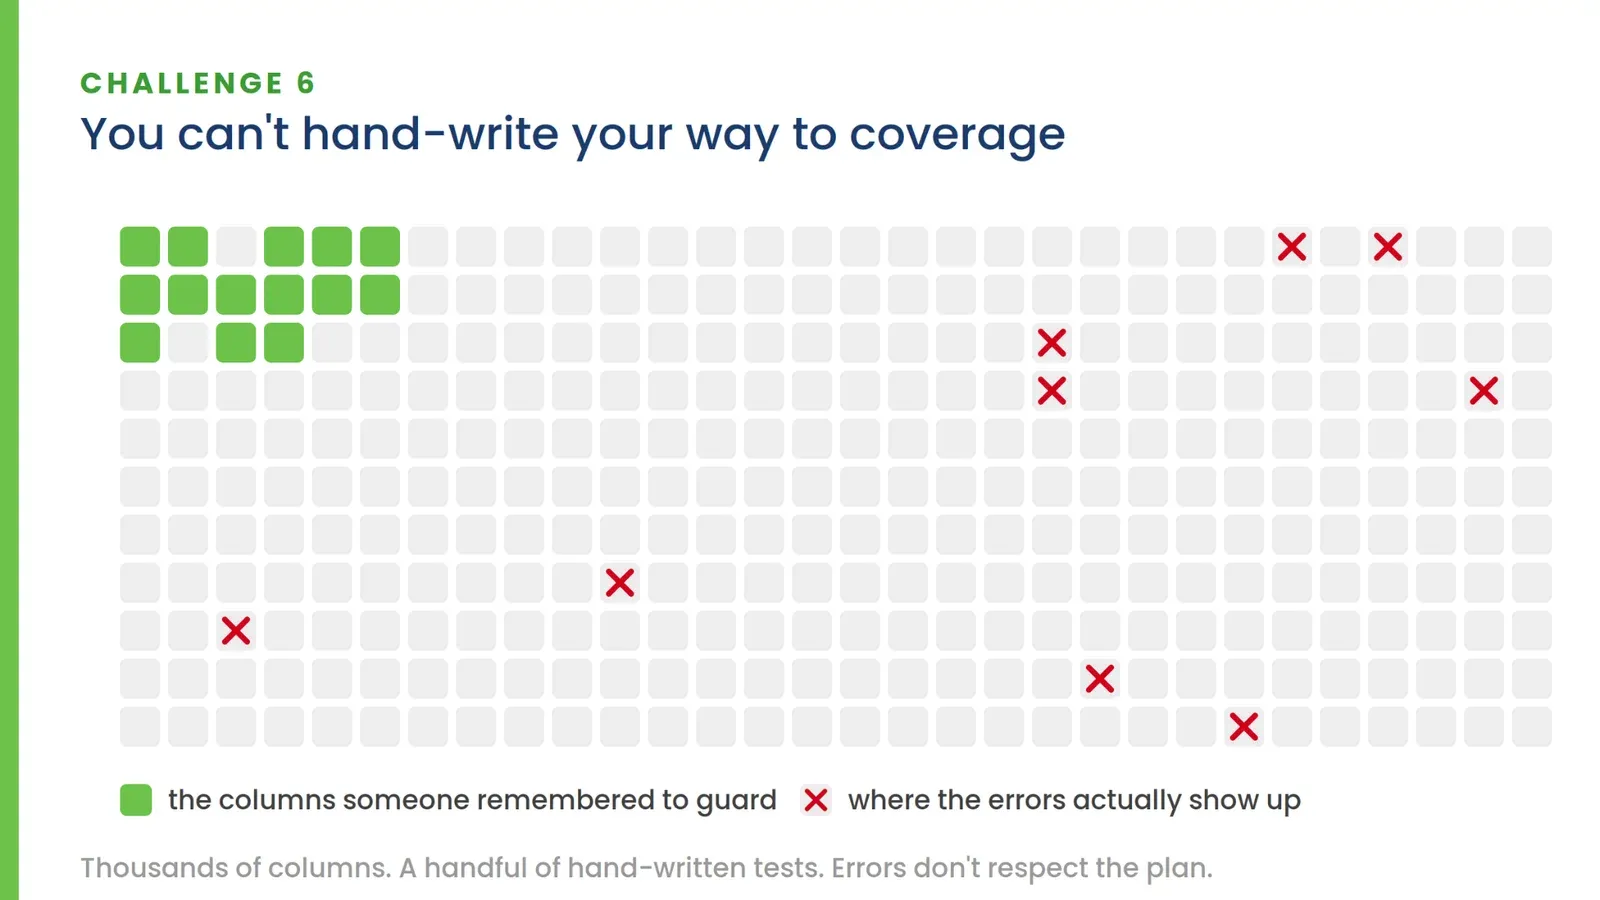
Errors don’t respect that plan. They show up in the long tail of columns nobody covered, and inside integration flows too intricate to script checks for by hand. Exactly the parts of the pipeline your manual test suite leaves dark.
The hand-written suite decays, too. Those hardcoded “expect at least 50,000 rows” thresholds go stale as the data grows. They either fire false alarms or get commented out. Both outcomes end the same way: you learn about the problem via a Slack message.
What TestGen does about all this
DataOps TestGen is built around the shape of these problems, and a few of its capabilities map directly onto them.
It generates tests from profiling. TestGen profiles every table at every layer and proposes checks from what it actually observes. Coverage blankets the whole data surface instead of the hotspots someone thought to guard. That’s the answer to the long-tail problem.
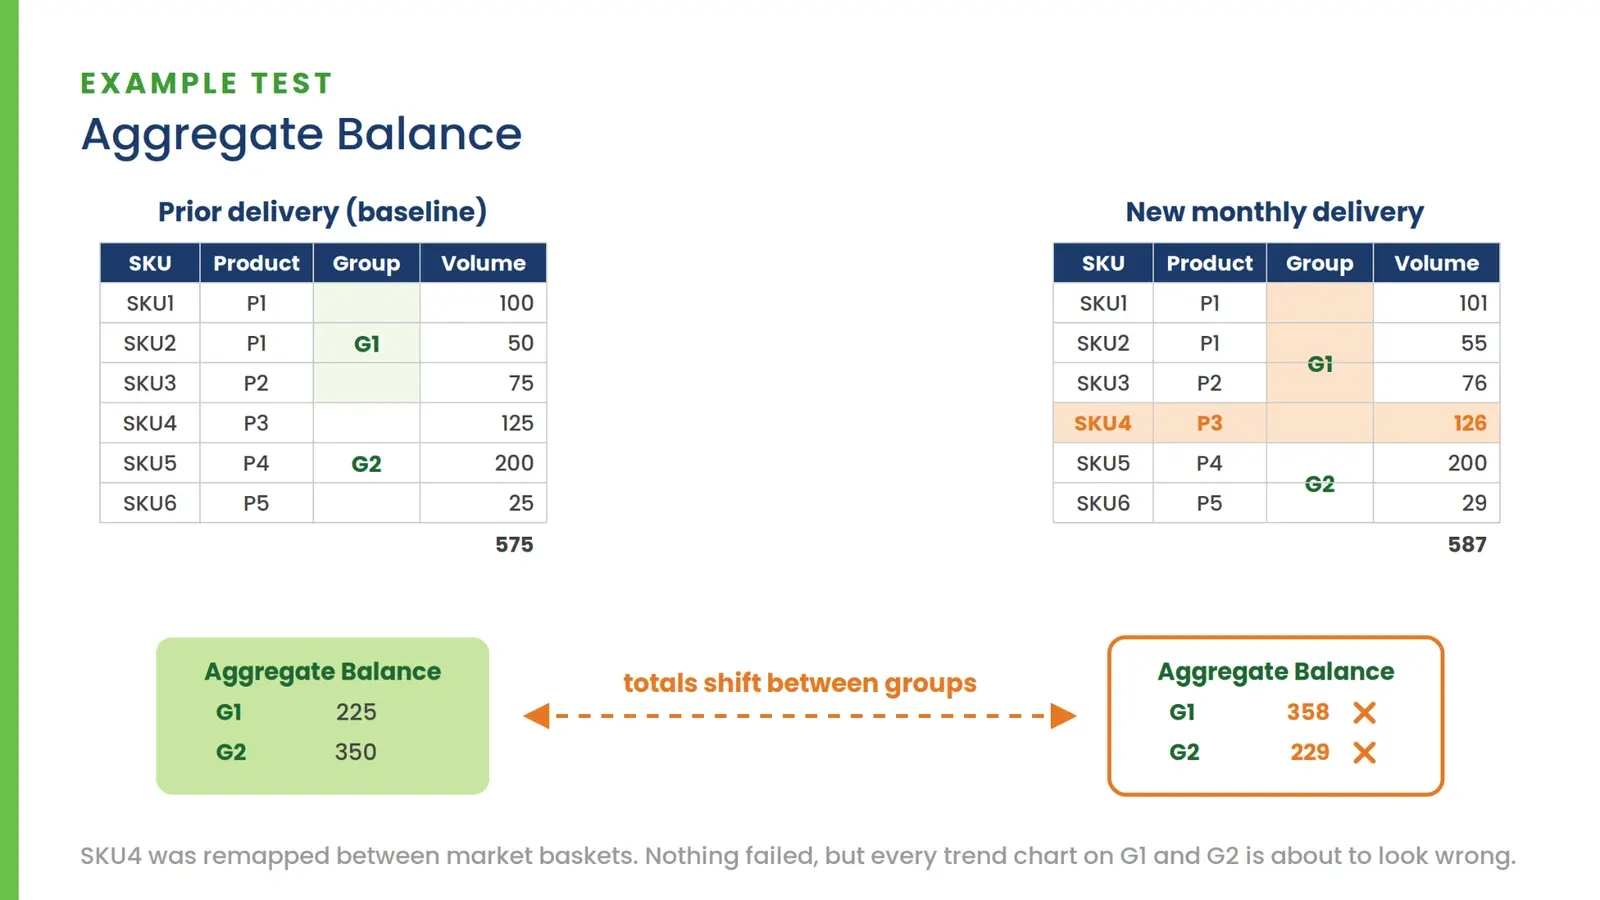
It tests relationships between tables, not single columns. Reference Match confirms that values, or combinations of values, in one table exist in another. That same referential machinery answers the external-list question from earlier: load a maintained reference dataset of active NDCs or current diagnosis codes alongside your data, and check against it like any other table. Aggregate Balance confirms that rollups still tie to their details per grouping or match a prior delivery. Duplicate Rows and Unique Values checks catch the de-duplication errors that multi-source merges create. And Custom Condition tests express a row-level business rule, like a field that must be populated for a given status, as a single condition instead of a full custom SQL query.
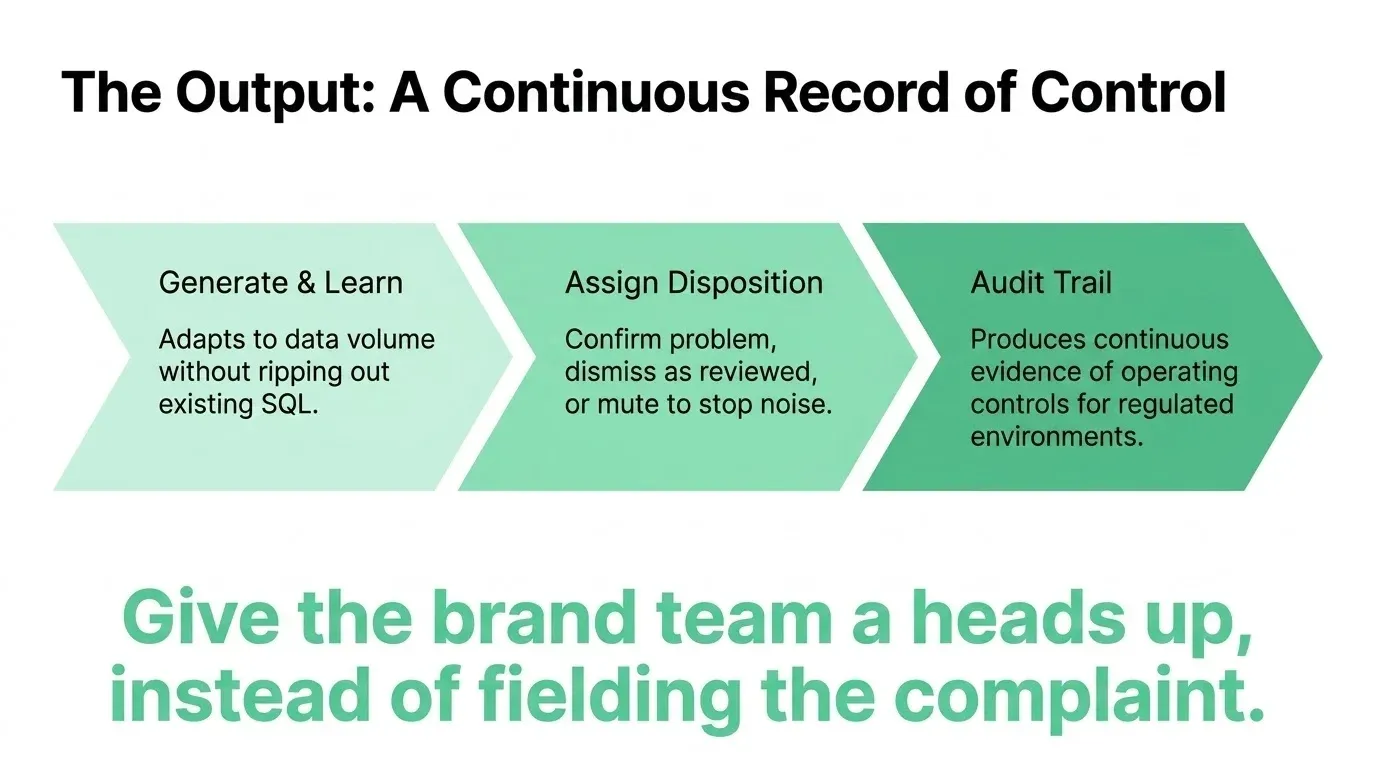
Aggregate Balance deserves a concrete example. On a monthly refresh, dispense totals for one product group jump while another group drops by roughly the same amount. The test flags both groups. A quick look shows an NDC got remapped from one market basket to the other. Nothing upstream failed, and no load errored, but every trend chart built on those groups is about to look wrong. Now you give the brand team a heads up instead of fielding the complaint, because analysts mistrust any chart that doesn’t match what they expected to see, and that mistrust spreads to the rest of your data.
It monitors syndicated feeds on their own terms. Freshness and volume monitors detect feeds that didn’t arrive, or that arrived twice. Volume bounds calculated from history flag deliveries that are implausibly large or small. And the Distribution Shift test compares two distributions using Jensen-Shannon divergence, which surfaces the payer-mix shift that signals a mapping regression before it reaches a dashboard.
That combination is how you handle restatement: split the checks the way the data splits. Run Aggregate Balance against the prior delivery on the stable tail only, the periods older than the vendor’s restatement window, where nothing should move. Point Distribution Shift at the restated months, where individual values will change but the shape should hold. An exact-match rule on the tail and a shape rule on the window, instead of one rule that’s wrong for half the file.
It validates derived logic at gold. Aggregate Balance confirms published totals tie back to source detail. Metric Trend tests and custom metric monitors flag a gold metric that has moved more than history would suggest. Value Match All verifies a derived classification contains exactly the expected set of categories. And a Custom Condition covers milestone ordering, like a ship date that must not precede an enrollment date.
It replaces stale thresholds with learned ones, which also addresses the obvious fear: that blanket coverage means thousands of tests screaming at you on every refresh. Generated test thresholds come from your actual profile, not from defaults. Volume monitors learn the normal range from history and adapt as the data grows. Broad coverage, built on learned bounds, retires false alarms rather than multiplying them.
It leaves an audit trail. Every test result takes a disposition: confirm it as a real problem, dismiss it as reviewed, or mute the test, so a known issue stops reading as fresh noise. The durable record of tests, results, and dispositions is exactly the continuous evidence of operating controls that regulated organizations get asked to produce.
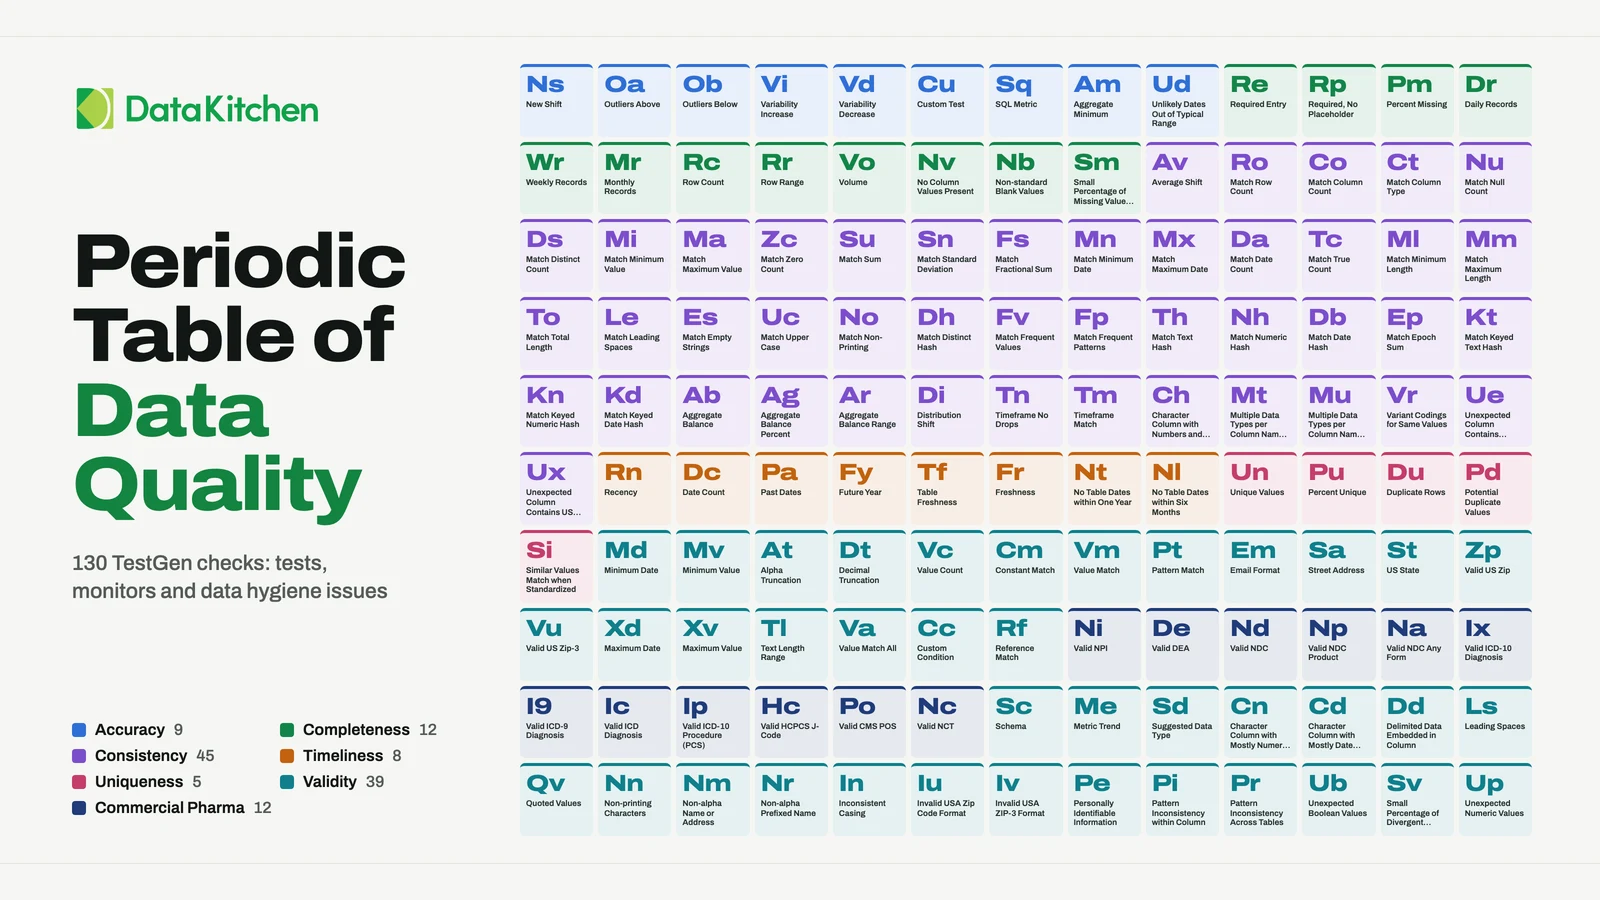
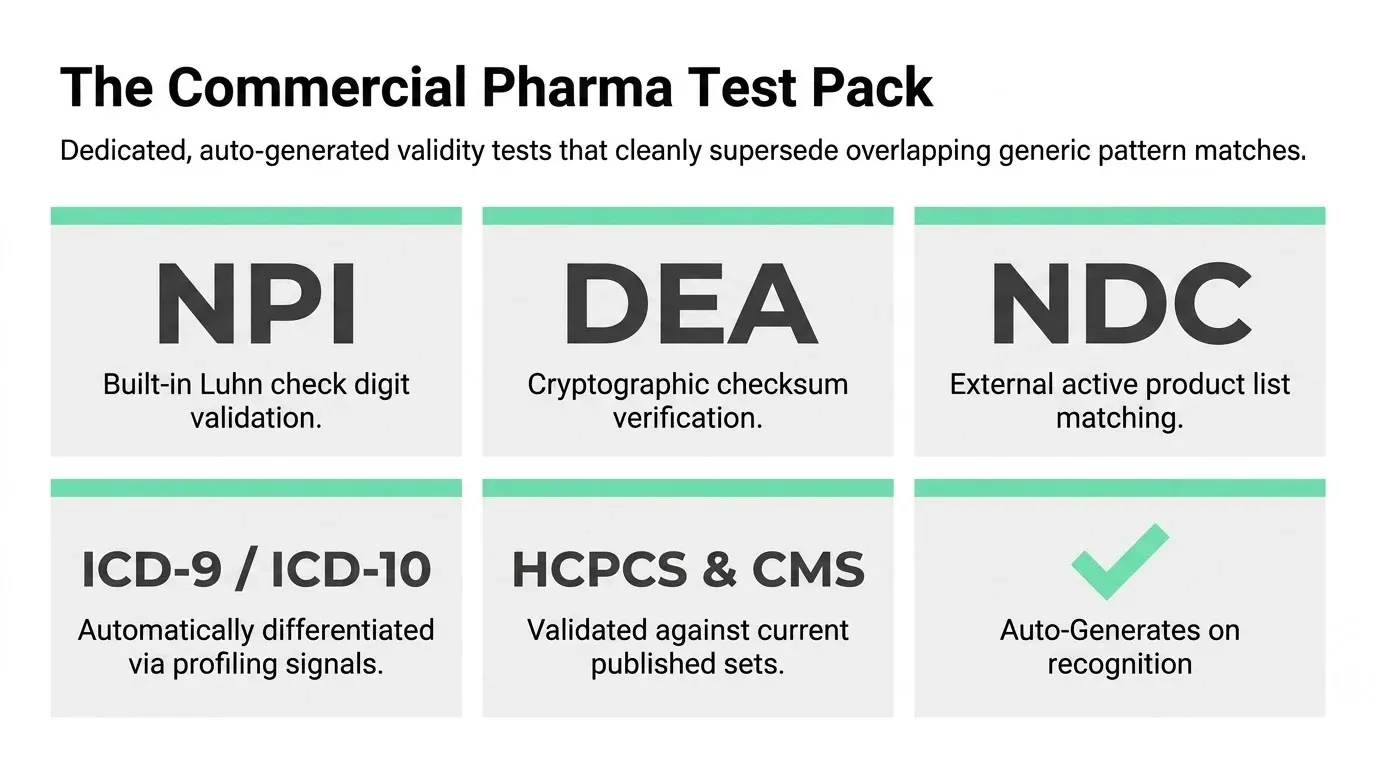
It ships identifier tests that know their specs. As of 27 August 2026, TestGen Enterprise carries a generation set called Commercial Pharma: twelve tests covering NPI with the Luhn check digit, DEA with its checksum, three levels of NDC, ICD-9 and ICD-10 diagnosis codes, ICD-10 procedure codes, HCPCS J-codes, CMS place-of-service codes, and NCT trial numbers. They auto-generate when the column name and the profiled values agree, and a dedicated identifier test supersedes the generic pattern match on the same column, so you get one precise, named result instead of two overlapping ones. Eleven of the twelve check form and check digits rather than membership in a published code set, so a failure there is conclusive and a pass is not; Valid CMS POS is the exception, and it carries the list.
None of this requires ripping out what you have. Your volume floors become adaptive monitors, your uniqueness and reference checks become generated tests, your reconciliation SQL becomes aggregate balance. The pharma pack layers on top of all of it to cover what’s specific to this industry.
FAQ
What are the key points in this blog?
Commercial pharma data breaks in six ways generic data quality checks never catch. No single source is complete, so failures are relational. Syndicated feeds fail in predictable but invisible ways. Identifiers like NPI and NDC fail silently. Each medallion layer fails differently. Gold dataset logic breaks on its own. And nobody can hand-write enough tests to cover it.
Why is commercial pharma data harder to test than other data?
Because the picture of a prescriber, account, or patient is assembled from several systems, so no single table is ever complete and the failures live in the relationships between feeds. A platform pulls CRM activity, specialty pharmacy dispense data, claims, patient services records, REMS data, 3PL reports, and syndicated feeds. A check that validates one table in isolation cannot see the break.
What identifiers cause silent failures in pharma data?
NPI, NDC, DEA, ICD, HCPCS, and CMS place-of-service codes are the join keys of the entire commercial pharma ecosystem, and they fail without erroring. ICD-9 and ICD-10 look similar enough that a generic format rule accepts both. An NDC in the wrong segment format still looks like an NDC. The join silently drops rows and every downstream number is quietly low.
What is syndicated data and how does it fail?
Syndicated data is purchased market data that feeds your most important analytics and produces your most visible numbers. It fails in predictable ways: restatements of prior periods, changed methodology between deliveries, shifted territory or account mappings, and partial files that arrive looking complete. None of those trip a null check, because the data is well-formed and simply different from last month.
Why can’t you hand-write enough tests for pharma data?
Because the surface area is too large. Between the number of source feeds, the identifier systems, the medallion layers, and the business logic in gold datasets, the number of meaningful checks runs well past what a team can author and then maintain as feeds change. Coverage has to be generated from profiling, with human effort reserved for the domain rules a profiler cannot infer.
How does DataOps TestGen handle commercial pharma data?
It profiles every table and column and generates the mechanical coverage automatically, so the volume problem stops being the constraint. Custom conditions and full custom SQL then cover the relational and business-specific checks: cross-feed reconciliation, identifier validation, and the internal logic of gold datasets. It runs behind your firewall, which is usually where a pharma security review ends other evaluations.