NOTE
First published on Medium in September 2018 and republished here in August 2026.
Trust takes years to build, seconds to break, and forever to repair.
We recently talked to a data team in a financial services company that lost the trust of their users. They lacked the resources to implement quality controls, so bad data sometimes leaked into user analytics. After several high-profile episodes, department heads hired their own people to create reports. For a data analytics team, this is the nightmare scenario, and it could have been avoided.
Organizations trust their data when they believe it is accurate. A data team can struggle to produce high-quality analytics when resources are limited, business logic keeps changing, and data sources have less-than-perfect quality themselves. Accurate data analytics are the product of quality controls and sound processes.
The data team can’t spend all of its time checking data. But if data analysts or scientists spend 10 to 20 percent of their time on quality, they can produce an automated testing and monitoring system that does the work for them. Automated testing can work 24x7 so that bad data never reaches users, and when a mishap does occur, it helps to be able to assure users that new tests can be written to make certain that error never happens again. Automated testing and monitoring multiplies the effort a data team invests in quality.
Data flow as a pipeline
Think of data analytics as a manufacturing pipeline. There are inputs (data sources), processes (transformations) and outputs (analytics). A typical manufacturing process includes tests at every step in the pipeline that attempt to identify problems as early as possible. As every manufacturer knows, it is much more efficient and less expensive to catch a problem in incoming inspection than in finished goods.
In a data analytics pipeline, databases are accessed and then data is transformed in preparation for being input into models. Models output visualizations and reports that provide critical information to users.
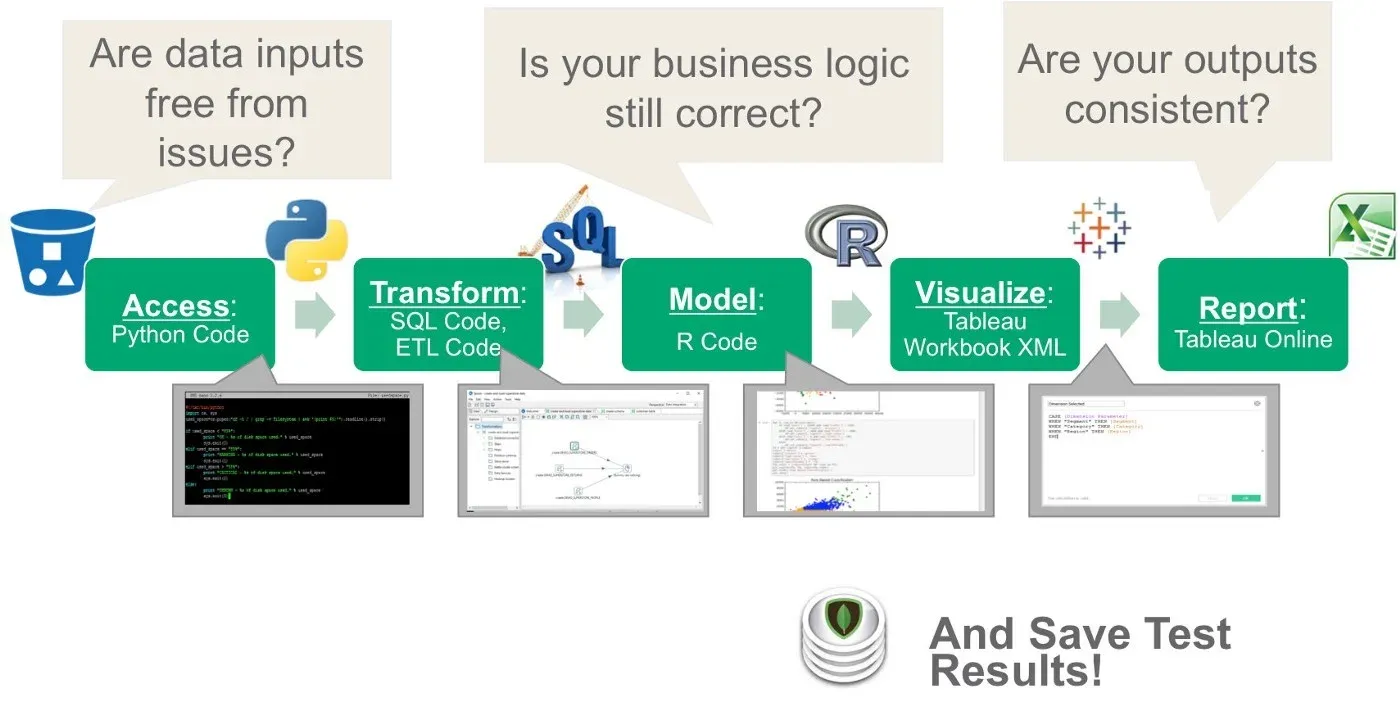
Testing each stage of the data analytics pipeline, and keeping the results.
Along the way, tests ask important questions. Are data inputs free from issues? Is business logic correct? Are outputs consistent? As in lean manufacturing, tests are performed at every step in the pipeline. Data input tests are analogous to manufacturing incoming quality control.
Data input tests strive to prevent any bad data from being fed into subsequent pipeline stages. Allowing bad data to progress through the pipeline wastes processing resources and increases the risk of never catching an issue. It also focuses attention on the quality of data sources, which must be actively managed. Manufacturers call this supply chain management.
Data output tests verify that a pipeline stage executed correctly. Business logic tests validate data against tried and true assumptions about the business, such as every European customer being assigned to a member of the Europe sales team. Test results saved over time provide a way to check and monitor quality against historical levels.
Failure modes
A disciplined data production process classifies failures according to severity level. Some errors are fatal and require the data analytics pipeline to be stopped. In a manufacturing setting, the most severe errors stop the line.
Some test failures are warnings. They require further investigation by a member of the data analytics team. Was there a change in a data source? Or a redefinition that affects how data is reported? A warning gives the data analytics team time to review the changes, talk to domain experts, and find the root cause of the anomaly.
Many test outputs will be informational. They help the data engineer who oversees the pipeline monitor routine pipeline activity or investigate failures.
Types of tests
The data team may sometimes feel that its work product is under a microscope. If the analytics look off, users can often tell immediately. They are experts in their own domain and will see problems in analytics with only a quick glance.
Finding issues before your internal customers do is critically important for the data team. There are three basic types of tests that will help you find issues before anyone else: location balance, historical balance, and statistical process control.
Location balance tests
Location balance tests ensure that data properties match business logic at each stage of processing. An application may expect 1 million rows of data to arrive via FTP. The location balance test verifies that the correct quantity of data arrived initially, that the same quantity is present in the database and in other stages of the pipeline, and finally that it reconciles in reports: 1 million rows in the raw source, the corresponding 300,000 facts and 700,000 dimension members in the database schema, and those same counts in the Tableau report.
Historical balance tests
Historical balance tests compare current data to previous or expected values. These tests rely on historical values as a reference to determine whether data values are reasonable, or within the range of reasonable. A test can check the top fifty customers or suppliers. Did their values unexpectedly or unreasonably go up or down relative to historical values?
It is not enough for analytics to be correct. Accurate analytics that look wrong to users raise credibility questions. Consider a change in allocations of SKUs, moving from pre-production to production, that shifts the sales volumes for two product groups. You can bet the VP of sales will notice immediately and report back that the analytics look wrong. This is a common issue: the report is correct, but it reflects poorly on the data team because it looks wrong to users. What has changed? When confronted, the data analytics team has no ready explanation. Guess who is in the hot seat.
Historical balance tests could have alerted the data team ahead of time that product group sales volumes had shifted unexpectedly. That gives the team a chance to investigate and communicate the change to users in advance. Instead of hurting credibility, the episode builds it, by showing users that reporting is under control and that the data team is on top of changes that affect analytics. “Dear sales department, you may notice a change in the sales volumes for G1 and G2. This is driven by a reassignment of SKUs within the product groups.”
Statistical process control
Lean manufacturing operations measure and monitor every aspect of their process in order to detect issues as early as possible. These are called time balance tests, or more commonly statistical process control. These tests repeatedly measure an aspect of the data pipeline, screening for errors or warning patterns. Statistical process control is a critical tool for catching failures before users see them in reports.
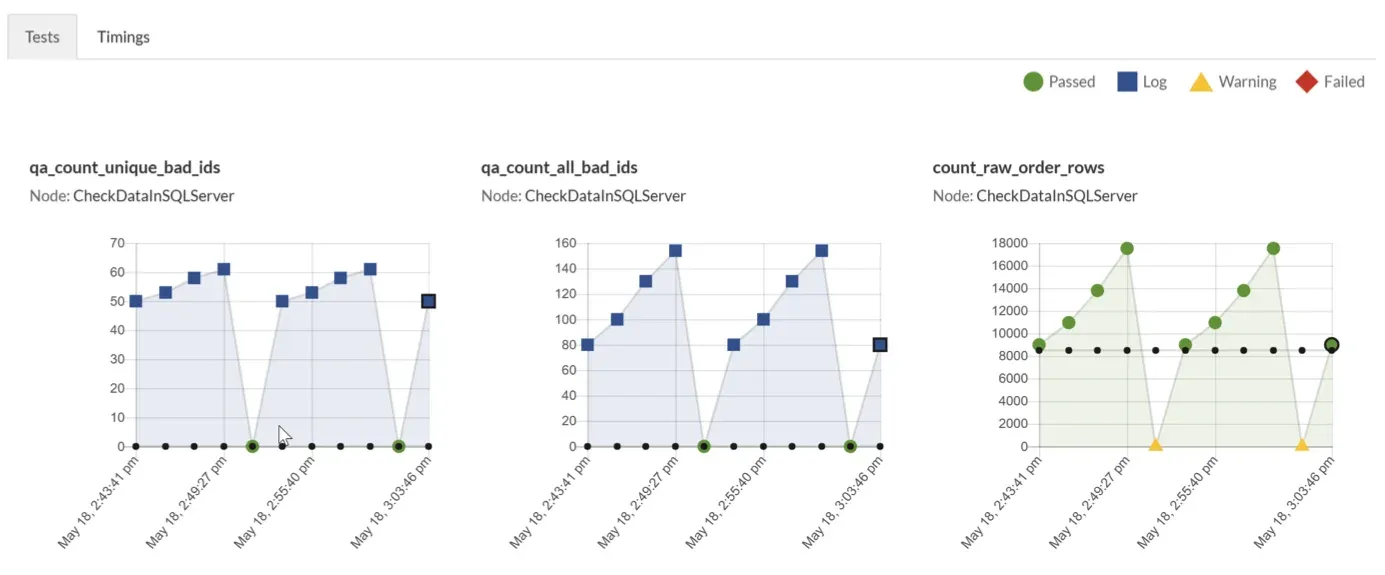
Statistical process control applies numerical criteria to measurements taken from the pipeline itself, run after run.
Notifications
A complex process could have thousands of tests running continuously. When an error or warning occurs, a person on the data team should be alerted in real time through email, text, or a notification service like Slack. This frees the data team from the distraction of having to periodically poll test results. If and when an event takes place, they will be notified and can take action.
Conclusion
Automated tests and alerts enforce quality and greatly lessen the day-to-day burden of monitoring the pipeline. The organization’s trust in data is built and maintained by producing consistent, high-quality analytics that help users understand their operational environment. That trust is critical to the success of an analytics initiative. After all, trust in the data is really trust in the data team.
The companion piece to this one covers testing the analytic code rather than the data: disband your impact review board.
TIP
Open source TestGen generates these tests from your data’s own profile, including the historical balance checks that catch a number which is correct but looks wrong.
FAQ
What are the key points in this blog?
Trust in data is trust in the data team, and it breaks when bad data reaches a user. A team that invests 10 to 20 percent of its time in automated testing gets a system that checks quality around the clock. Three test types do most of the work: location balance, historical balance, and statistical process control. Failures need severity levels so the pipeline stops only when it should.
What is a location balance test?
A location balance test confirms that data properties match business logic at each stage of processing. If an application expects 1 million rows to arrive by FTP, the test verifies that 1 million arrived, that the same quantity is present in the database, that it survives the later pipeline stages, and that the counts still reconcile in the finished report.
What is a historical balance test?
A historical balance test compares current data against previous or expected values, using history as the reference for whether today’s numbers are reasonable. It catches the case where analytics are technically correct but look wrong to a user, such as sales volume shifting between product groups because SKUs were reassigned.
Why do accurate analytics still damage credibility?
Because users are experts in their own domain and can tell at a glance when a number looks off. If a report is correct but reflects an unannounced change, the data team has no ready explanation and ends up in the hot seat. A historical balance test gives the team the chance to explain the change before anyone else notices it.
How should test failures be classified?
By severity. Some errors are fatal and should stop the pipeline, the way the most severe defects stop a manufacturing line. Some are warnings that need a human to investigate whether a source changed or a definition was redefined. Most results are informational and exist to help whoever oversees the pipeline monitor routine activity.
How much time should a data team spend on testing?
Between 10 and 20 percent. A data team cannot spend all its time checking data, but that share is enough to build an automated testing and monitoring system that then does the checking for it. The investment compounds, because every incident becomes a new test that prevents a repeat.