Your Monday starts with a Slack message. Somebody in finance says the numbers look wrong. Three people drop what they were doing. By four in the afternoon, you find it: an upstream system added a column and changed a type, and the load has been quietly dropping rows since Thursday. You fix it, you write the apology, you go home.
Nothing on that Monday was in the sprint. That’s the whole problem.
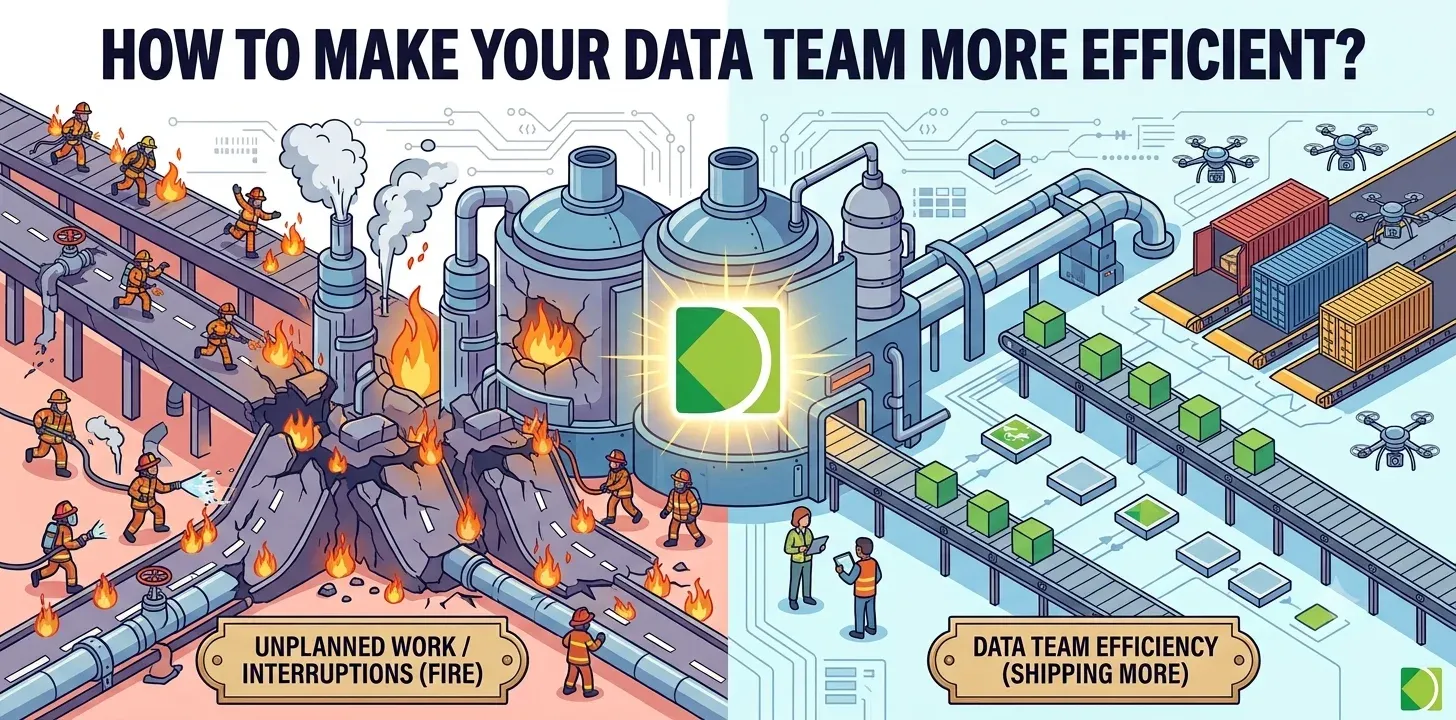
When someone asks how to make a data team more efficient, they usually mean: how do we ship more? Typing faster won’t do it. A large share of the week goes to unplanned work, and shipping more means reducing that number.
What the research actually says
You’ve seen the stats on bad data. The time ones hold up better than the money ones, so start there.
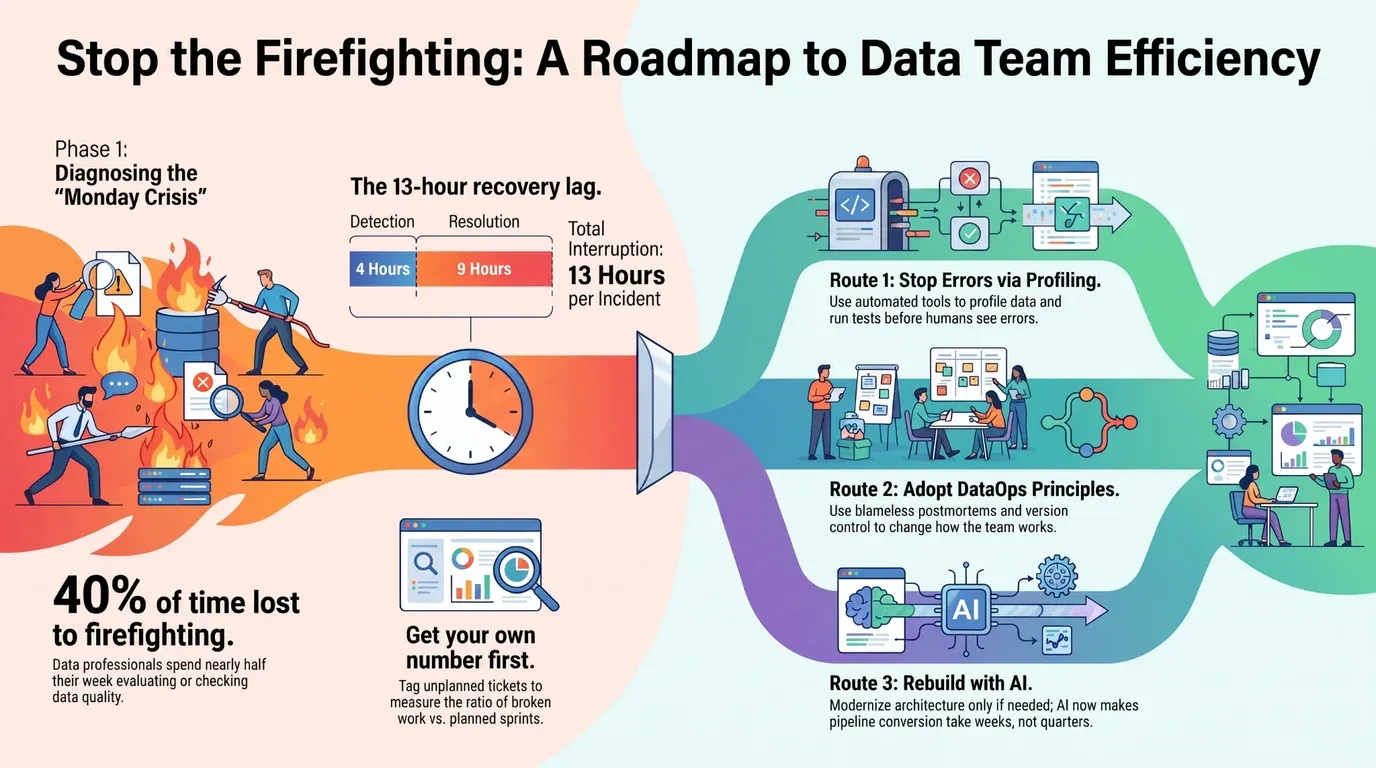
The most useful one comes from a 2022 survey of more than 300 data professionals, fielded by Wakefield Research and sponsored by Monte Carlo. Respondents said 40 percent of their time goes to evaluating or checking data quality. Three quarters of them need four hours or more just to detect an incident, and about half need another nine hours to resolve it once they’ve found it. Call it 13 hours per incident, between the break and the fix, before anyone corrects a single downstream report. More than half also said incidents were going up, not down.
That is the time cost. There is a human one underneath it, and the best evidence I know of is ours. In 2021 we surveyed 600 data engineers with data.world, also fielded by Wakefield. 97 percent reported burnout in their day-to-day work. The causes they named were not exotic: too much time finding and fixing errors, manual repetitive work on data prep and pipelines, and a pace of incoming requests nobody could stay ahead of. The same three things this post is about.
When the subject comes up, somebody usually reaches for governance. That survey is unkind on the point. 69 percent of those engineers said their own company’s data governance policies made their day-to-day job harder. Governance gets sold as the fix and lands as friction.
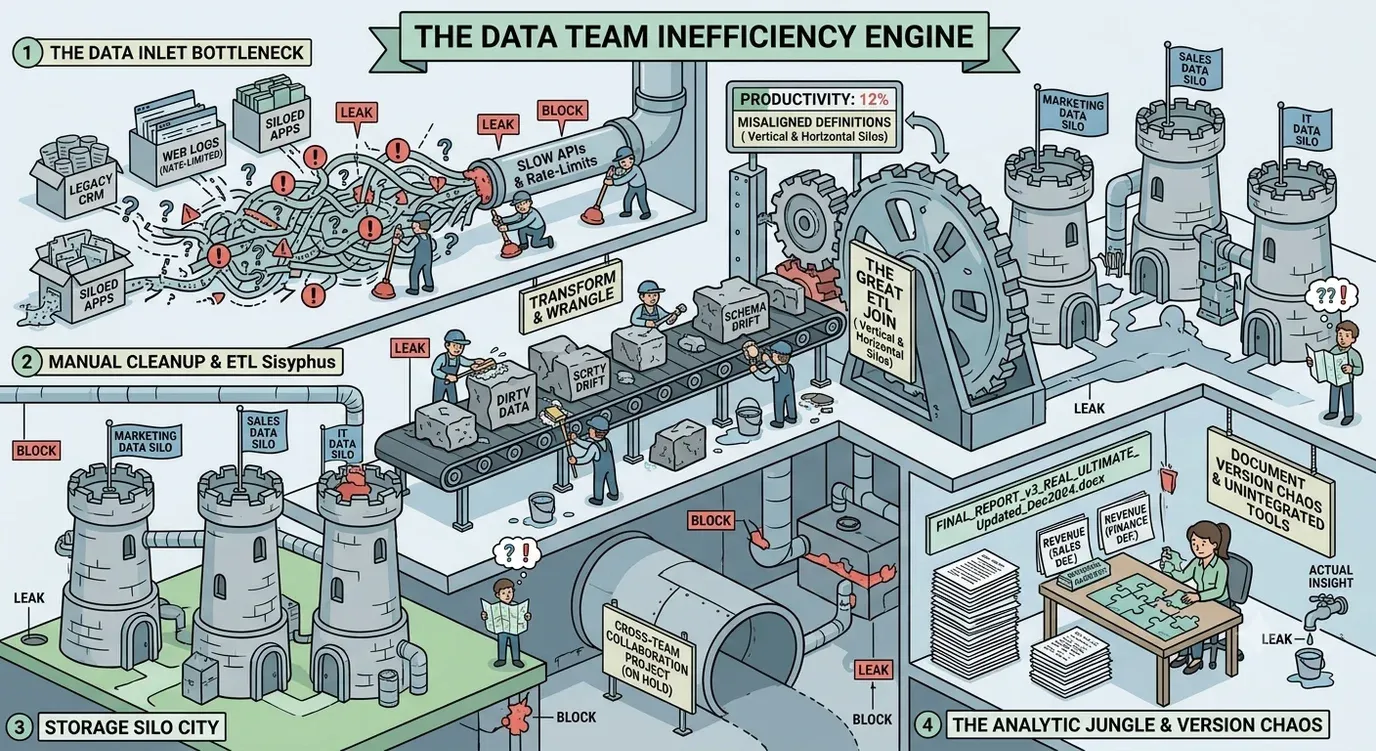
The tactics below assume a small or mid-size data team, where you know everyone who is breaking things and you can change something without a review board. Inside a large enterprise the diagnosis holds and the tactics don’t, because getting a check into production there is a procurement exercise, not an afternoon. Three routes follow, and most teams need more than one.
First, get your own number
The money numbers are softer than the time ones, and you should know why before you put them on a slide. Gartner’s widely quoted $12.9 million average annual cost of poor data quality comes from its 2020 data quality Magic Quadrant, where 154 reference customers of data quality vendors were asked to estimate their own losses. Self-reported guesses from large enterprises who were already buying the software. Fine as an order of magnitude, useless as a benchmark for your team. People cite IBM’s $3.1 trillion figure from 2016 even more often, and it has never carried a published methodology. MIT Sloan’s estimate that companies lose 15 to 25 percent of revenue to bad data is in the same family.
Use those to establish that the problem is real and expensive. Don’t take them to your CFO as evidence about your own team. Take your own number instead, and you can have it in a month.
Before you pick a route, measure what’s actually happening. Not with a timesheet. Your engineers already resent the tracking they have, and asking them to log every interruption will get you a spreadsheet with four entries.
Use what you already collect. Tag every ticket that came from something breaking rather than something being planned, then read the ratio at the end of the sprint. Or count incidents per week and multiply by an honest estimate of what one costs end to end. Or spend an hour scrolling back through the channel where people report broken dashboards and reconstruct last month. Any of these gets you a number you can defend in a room, and none of them needs a new process.
Then track detection lag: from the moment bad data lands to the moment a human says something. You probably know this one already. If the answer is “a day or two, unless it’s the exec dashboard, then 20 minutes,” you have a detection problem, not a data problem. You are eyeballing row counts and praying whether you call it that or not.
Those two numbers tell you which route to take, and they give you a before, which you’ll want when someone asks in six months whether any of this worked.
Route one: stop the errors
This is the highest return per dollar, and almost nobody starts here, because it isn’t exciting.
Production errors are a time problem before they are a quality problem. Every one of them buys you an investigation, a fix, a re-run, a set of downstream corrections, and a conversation with whoever built a report on the broken table. The fix takes 20 minutes. Everything around it takes a day.
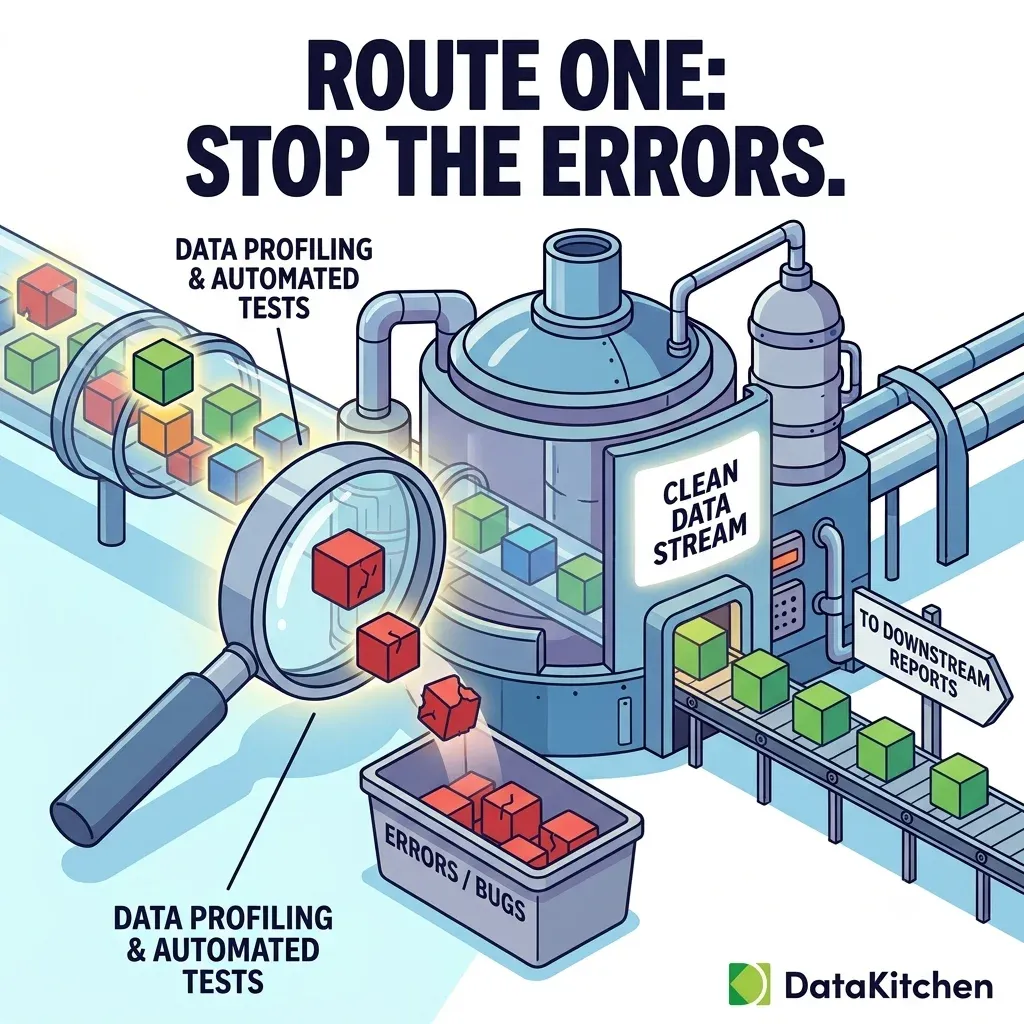
The reason errors cost so much is that you find out about them from a person. Somebody who trusted your table enough to build on it is now your monitoring system. An expensive alerting layer, and it costs you a little credibility every time it fires.
Be precise about what tests fix, because many vendors are not. Most of your breakage starts upstream, in systems you don’t own, run by people who don’t know you exist. Tests don’t prevent that. The Salesforce admin will still add a field on a Tuesday without telling anyone. What tests change is when you find out and how far it spread. Monday at 9am from finance becomes Tuesday at 6:14am from a check that ran before anything downstream read the table. The claim stops there. It’s enough.
The counter is a test that runs before humans read the data. The objection is always that nobody has time to write tests for 4,000 tables, which is true and also the wrong frame, and we got roasted on Reddit for asking about it. You don’t write them. You profile what the data actually does and generate tests from that: column ranges, null rates, cardinality, freshness, referential integrity, distribution shifts. Then you keep the ones that make sense. An afternoon, not a project.
Start where a wrong number reaches someone who can escalate it. Usually a couple dozen tables, not 4,000, which is what test coverage as a measure actually means, and it’s a better filter than picking by volume or by which pipeline annoys you most.
Then tune, because this is where generated tests usually die. Profile-based checks will flag legitimate variation. Somebody mutes the channel, and six weeks later the tests are decoration. Split them from the start. Hard constraints you know are true, like a key being unique or an amount never going negative, can fail loudly on day one. Statistical checks like distribution shifts and volume ranges run in warn-only mode for a couple of weeks while you learn what normal looks like. Promote them once they stop crying wolf.
Wire the ones you trust into the path your changes already take. On a normal stack, that means the tests run in the pull request, and the same checks run again against production data right after the load, before anything downstream reads the table. That is what shifting left and shifting down means in practice.
Decide in advance what a failure does, because halting is not free. Stop the pipeline and finance opens an empty dashboard instead of a wrong one, and now you’re explaining that instead. Your rule: halt when the data would be silently wrong, warn when it would be obviously incomplete. A wrong number gets used. A missing one gets questioned.
This route works on the system you already have. No migration, no reorg, nothing to procure. It’s also the only one of the three you can start without asking anyone for permission, which matters more than it should.
Route two: steal the principles
The second route costs the least money and the most patience. Start it yourself on Monday, for free.
Hold a blameless postmortem on every data incident. 15 minutes, written down: what broke and why, no names attached to blame. Keep the list somewhere shared. Read it once a month. After a quarter, the things eating your week will have named themselves, and you’ll be holding the evidence you need to ask for anything bigger.
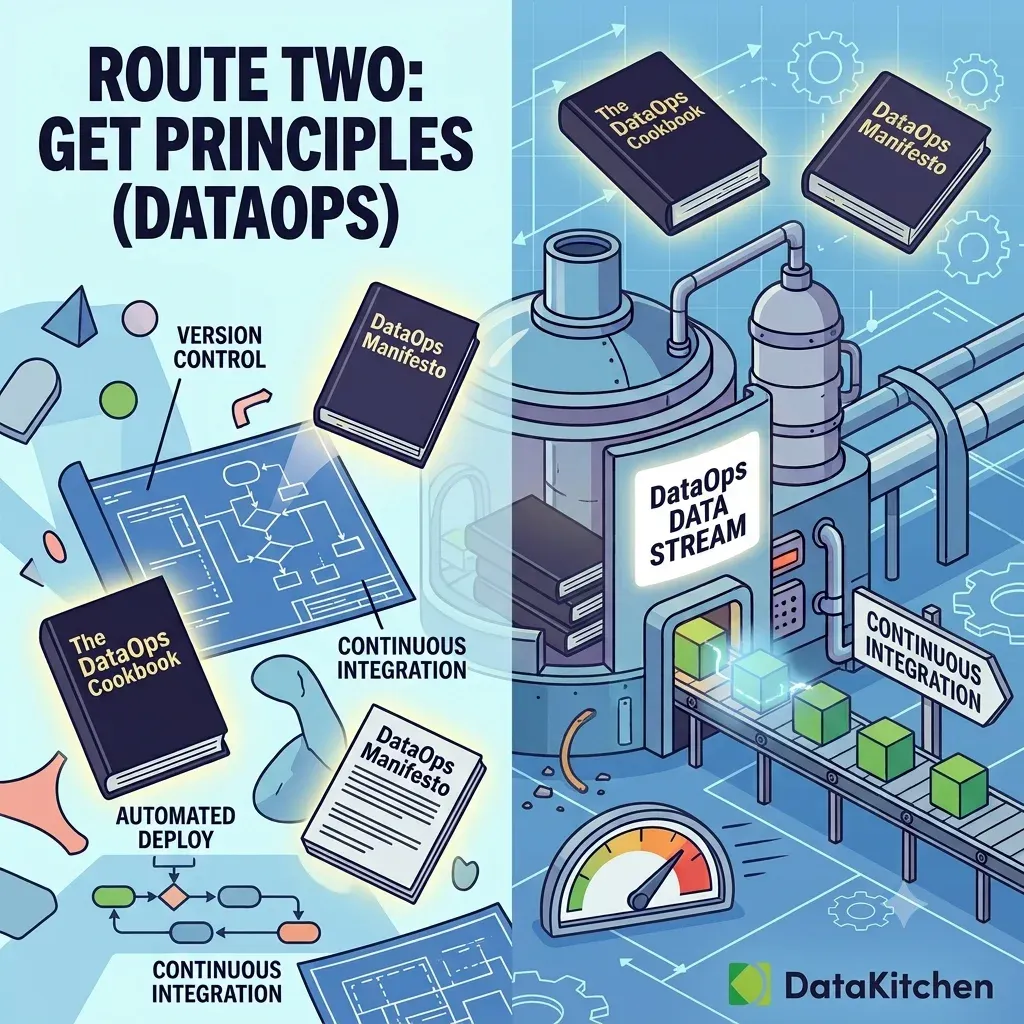
Then bring in people who have made data teams faster before, and take their principles rather than their labor. This works because much of what slows you down is not technical. It’s that every change requires a human to verify it manually. It’s that nobody agrees on which tables matter, so either everything gets watched or nothing does. It’s that one person knows why that filter is there, so when they’re on vacation, changes stop or break. That last one has a name, process guardianship, and it is usually nobody’s job. No tool fixes those. A different way of working does.
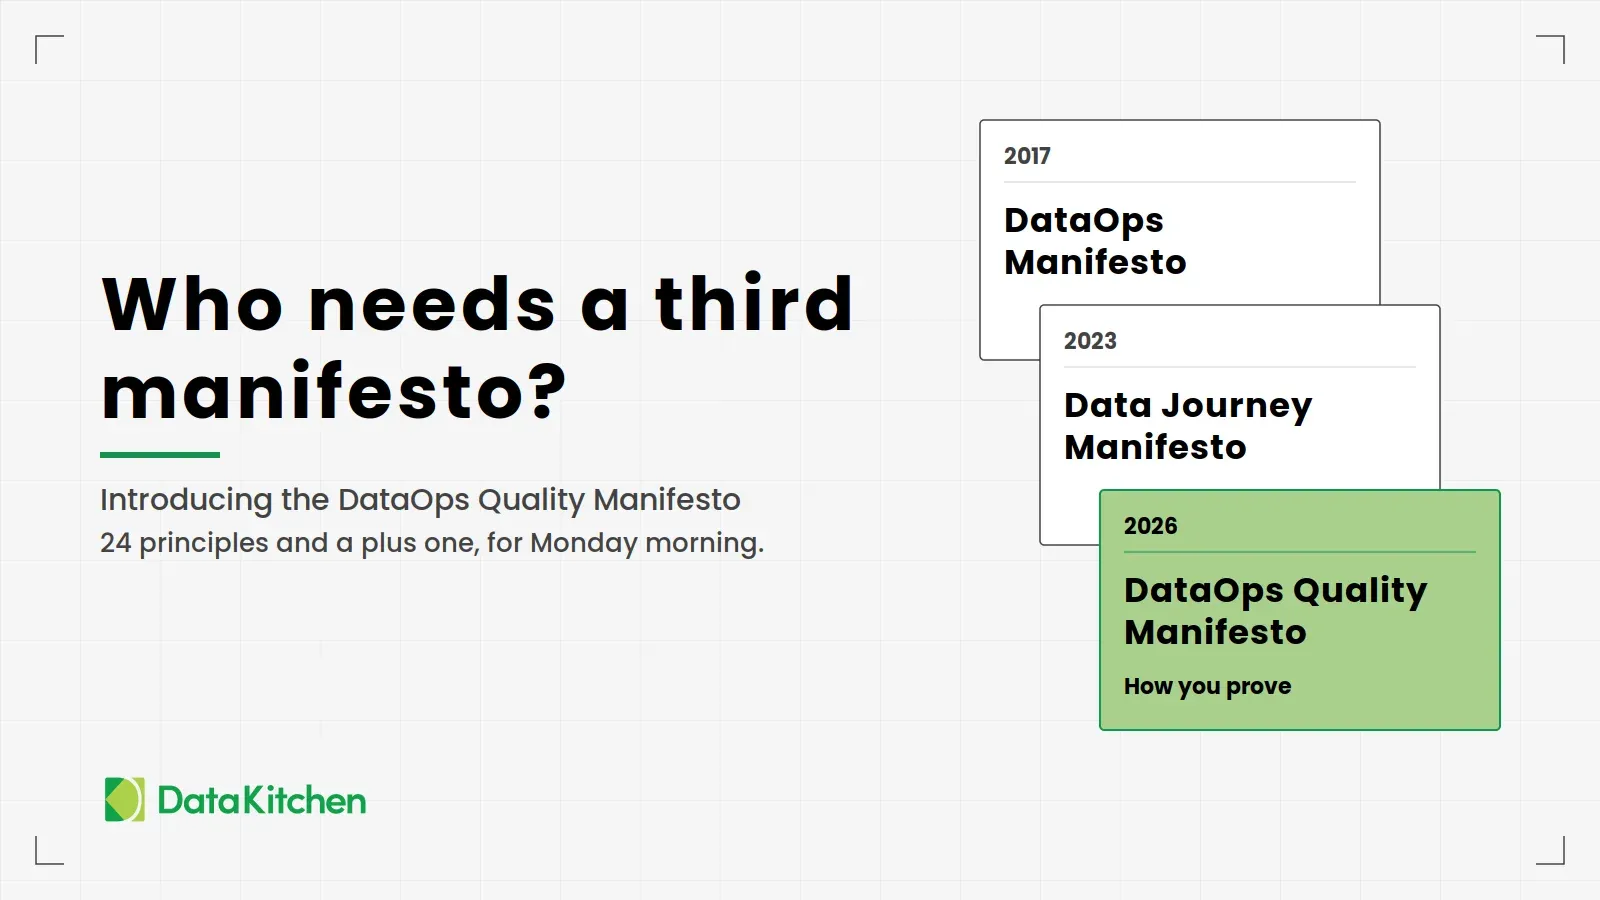
The ideas are not secret. Software teams and manufacturing plants solved most of this decades ago with version control, automated testing, continuous integration, and statistical process control. Read the foundational DataOps material before you pay anyone, because then you can tell whether the consultant across the table knows the practice or is selling you a maturity model. If you want that material in an order, Where to Actually Start with DataOps in 2026 lays out what to hand your team and what to do first.
The honest warning on this route: principles only move the number if leadership changes what it rewards. If your team is still measured by tickets closed, you’ll end up with the best firefighters in the industry and no fire code. Advice can’t fix an incentive.
Route three: rebuild it, if it needs rebuilding
The most expensive route, and the one to be honest with yourself about. Plenty of the pipelines you hate are fine underneath and just have no tests. Rebuild when the architecture is the problem, not when the last six months were painful.
The classic rewrite failed for a predictable reason. It took 12 months, the old pipelines kept breaking the whole time, and at month nine the sponsor changed and the project got shelved. Everyone reading this has seen that happen at least once.
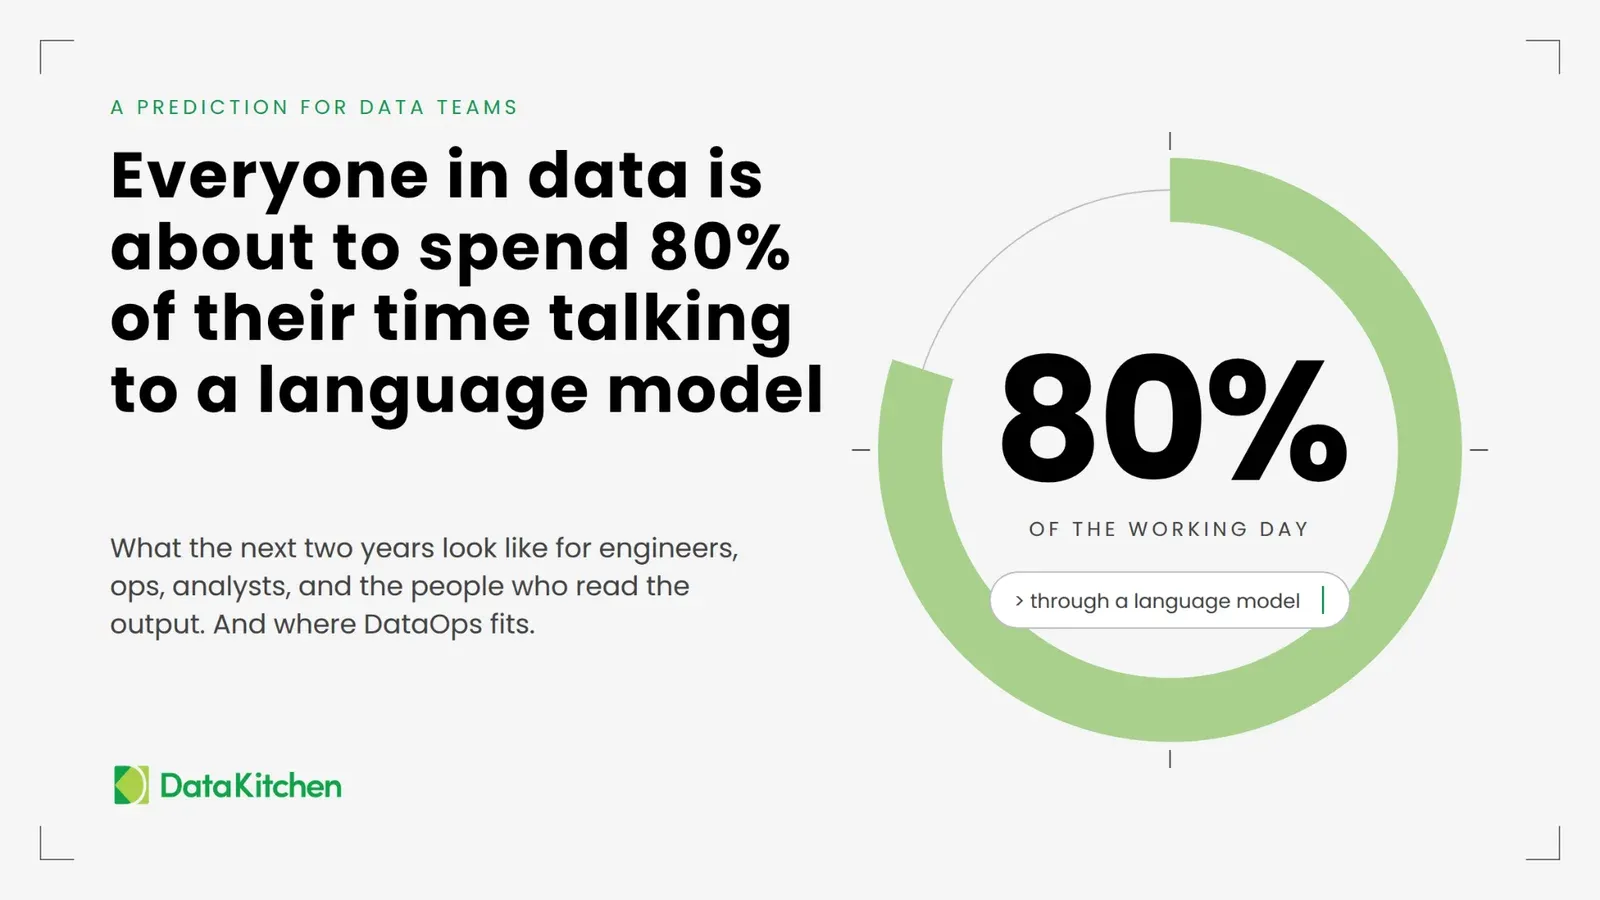
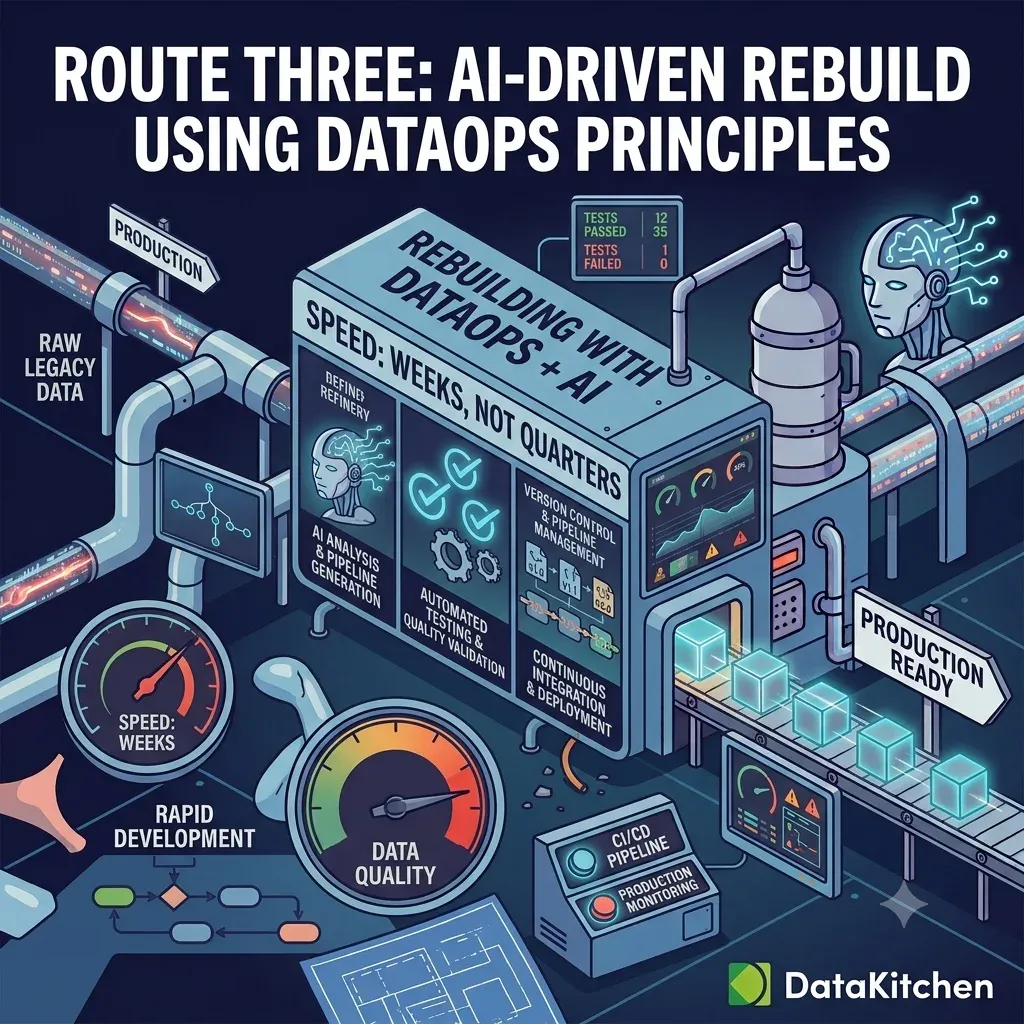
AI changed the arithmetic, though less than the pitch decks claim. What collapsed is the mechanical work. A transform that took an engineer a day takes a couple of hours now, and that is the part we can show from our own work. It works best when the pipelines are functional and idempotent, because that is what lets AI reason about them and change them safely. What did not collapse is the rest of it: agreeing what the output should be, running old and new side by side until the numbers match, and cutting over without breaking the reports people already depend on. That still sets the calendar. So the rewrite is a smaller bet than it was three years ago, which is worth repricing if that is the last time you looked at it. Anyone quoting you a fixed number of weeks has not seen your pipelines.
Two things determine whether it works.
The first is who runs it afterward. A rebuild that ends with an outside team holding the keys has only moved your bottleneck somewhere with a contract attached. The handover is the deliverable, not the code.
The second is tests, which is why this route is third and not first. AI will generate a pipeline that looks right, runs clean, and is quietly wrong in a way nobody notices for a month. Without tests, you have built a much faster way to produce errors you can’t see. If you’re going to rebuild with AI, do route one first, or at a minimum in parallel. Otherwise you’re buying speed and paying for it in Mondays.
The order
Be realistic about which of these you can actually start. Route one you can begin this week on your own authority. Routes two and three need a sponsor, because you don’t set what your organization rewards and you can’t authorize a rebuild. So do route one first. The number it produces is how you get the sponsor.
Most teams do this in reverse. They rebuild first because it feels like progress, hire a consultant when the rebuild stalls, and get to testing in year three when someone finally adds up the hours.
What next Monday looks like
The load runs at 6:14. A test fails on row count and the pipeline stops before anything downstream reads it. Somebody on your team gets a message at 6:20 with the table, the test, and the column that changed. They fix it before finance opens the dashboard.
Nobody outside the team ever knows it happened. That’s what efficient looks like. It’s boring, and boring is the point.
Where DataKitchen fits
Everything above works whether you buy from us or not, and most of it works even if you buy nothing. Here’s what we do, for the parts where you want help. We are data team efficiency nerds.
The books are free. The DataOps Cookbook, Recipes for DataOps Success, and the DataOps Manifesto cover the principles in route two. All three are here, with no form in front of them. More than 30,000 people have signed the Manifesto. Read them, argue with them, and use them to judge whoever you end up hiring, including us.
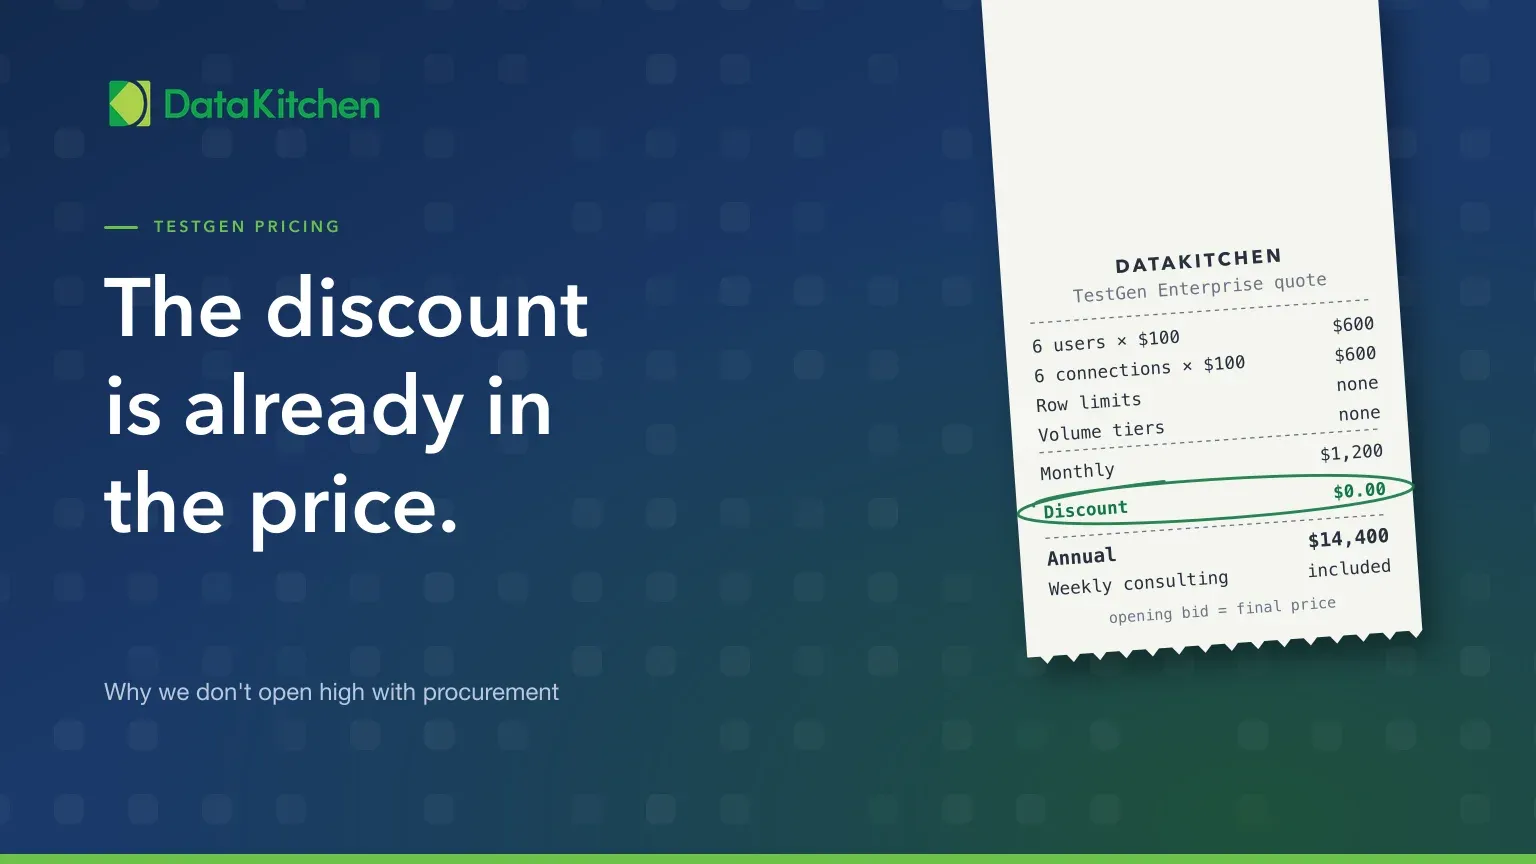
The tools are open source. DataOps TestGen profiles your tables and generates the tests described in route one. DataOps Observability watches the pipelines around them. Both are Apache 2.0 and on GitHub. Install TestGen, point it at a schema, and read the results the same day. The enterprise version is a flat $100 per user per month, because a usage-based vendor earns more as your data grows.
The consulting is for routes two and three. We’ll sit with your leadership and tell you where the hours are going, assess where you stand, or do the rebuild ourselves and hand it back to your team to run. We leave when it’s running. That is what you’re paying for. All of our services are here.
FAQ
What are the key points in this blog?
A data team is usually not slow, it is interrupted, so shipping more means shrinking the share of the week that goes to unplanned work. Measure your own ratio of unplanned to planned tickets first. Then take three routes in order: stop the errors with generated tests, take the principles from people who have done it, and rebuild only if the architecture is genuinely the problem.
How much of a data team’s time goes to bad data?
In Monte Carlo’s 2022 Wakefield survey of more than 300 data professionals, respondents said 40 percent of their time goes to evaluating or checking data quality. Three quarters said they need four hours or more just to detect an incident, and about half need another nine hours to resolve it once found, which is 13 hours per incident. More than half said incidents were increasing rather than decreasing.
Is Gartner’s $12.9 million cost of poor data quality a reliable number?
Use it for order of magnitude, not as a benchmark. The figure comes from Gartner’s 2020 data quality Magic Quadrant, where 154 reference customers of data quality vendors were asked to estimate their own losses. Those are self-reported guesses from large enterprises already buying the software. IBM’s $3.1 trillion figure has never been published with a methodology at all.
Do data quality tests prevent upstream changes from breaking pipelines?
No, and any vendor claiming otherwise is overselling. Most breakage starts in systems you do not own, run by people who do not know you exist. A Salesforce admin will still add a field on a Tuesday without telling anyone. What tests change is when you find out and how far it spread, which is the difference between a day of investigation and six minutes.
How do you stop generated data quality tests from becoming noise?
Split them from the start. Hard constraints you know are true, like a key being unique or an amount never going negative, can fail loudly on day one. Statistical checks like distribution shifts and volume ranges run in warn-only mode for a couple of weeks while you learn what normal looks like, then get promoted once they stop crying wolf.
Should a failing test halt the pipeline or just warn?
Halt when the data would be silently wrong, and warn when it would be obviously incomplete. A wrong number gets used and reaches a decision; a missing one gets questioned. Halting is not free either, because a stopped pipeline means finance opens an empty dashboard instead of a wrong one, and you are explaining that instead.