TL;DR: Four places to test data in a Medallion. You need all four. Test source data so it’s fit for purpose. Poll at ingestion to catch what arrives late, short, or reshaped. Put tripwires through bronze, silver, and gold so bad data stops before it reaches your customer. Run regression tests in CI/CD so a code change doesn’t break a downstream report. The same null check means a different job in each place. Skip a point and your dashboard is wrong by 9 am. Start with monitoring on bronze. One hour, no cost.
Why this keeps happening
Most data teams build on hope. You trust your data providers. You trust the pipeline ran. You trust the report is right. Then a Slack message arrives at 9 am, and the dashboard is already wrong in front of your customer.
We wanted to know why this keeps happening, so we used Claude Code to scan the internet and pull about 850 comments from data engineers about why they don’t test. The reasons rhymed. I don’t have time. I don’t have support. Errors aren’t visible until someone yells at me. The data changes too much. The tools aren’t good. The whole industry is still immature. Almost nobody said, “Testing is easy, and I do it everywhere.” Almost everybody said some version of “we eyeball row counts and pray.”
The Medallion architecture has become the default in many large organizations, and it makes the praying worse, not better. You have more layers, more tables, more tools, and more places for an error to slip through unnoticed. So this is the practitioner’s guide to where you test in a Medallion architecture and how to do it. There are four points. Miss one, and you keep getting yelled at.
What Medallion actually is
Medallion is a layered data architecture. You read it left to right.
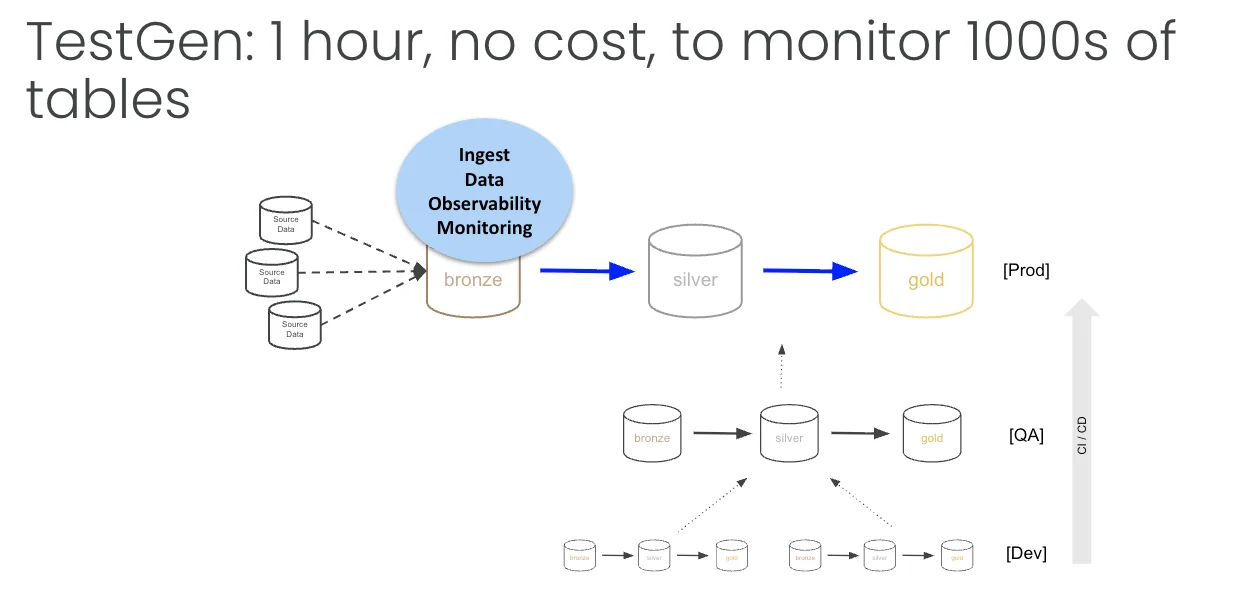
You take source data and land it in a bronze layer. Bronze is a near-table-by-table copy of the source. No cleanup, just capture. From there, you move data into a silver layer, which gets “just enough” cleaning and transformation: mastering, patching, and a unified view of your core business entities. Then you build the gold layer, which is fit for consumption. Gold is your facts and dimensions, your aggregate tables, and the schemas your BI tools and analysts actually query. Sometimes there’s a platinum layer after gold. Sometimes the layers are called L1, L2, and L3. Databricks popularized the pattern, and it shows up everywhere in the lakehouse now.
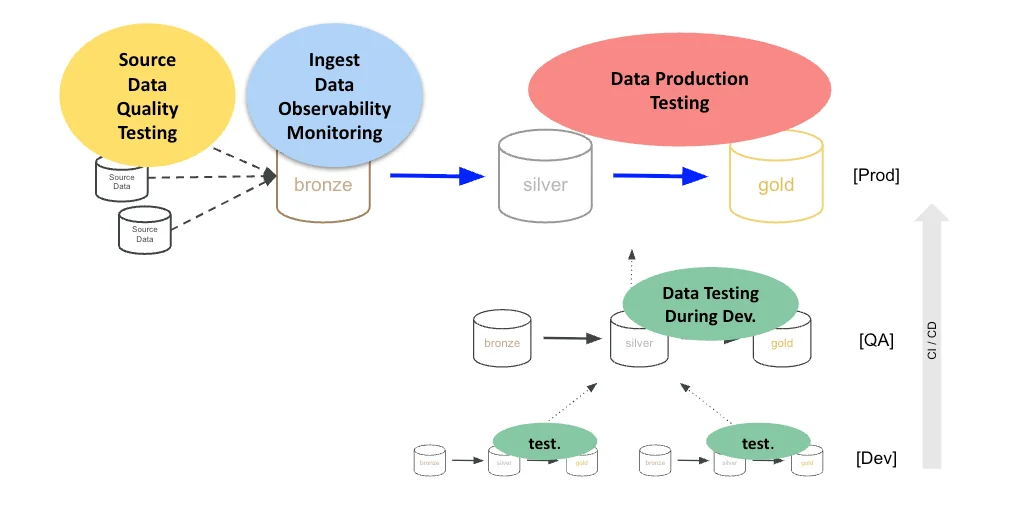
There’s a second axis you can’t ignore. Bronze, silver, and gold run in production, but they also run in QA and in development. Your engineers build a new transformation or add a new dataset in dev. It moves to QA, and then it ships to prod through CI/CD. So you don’t have one Medallion. You have three copies of it stacked on top of each other, and code has to travel up the stack without breaking anything.
That second axis is why people get confused about testing. They think testing is a single activity that happens in one place. It isn’t. The same Medallion gives you four distinct testing jobs, each with a different goal, a different owner, and a different failure mode.
One test, four jobs
Here’s the thing that trips everyone up. A data quality test is just code that checks data. It’s scriptable, automated, and reusable. Take the simplest test you can imagine: check for nulls. That one test means four completely different things depending on when and where it runs.
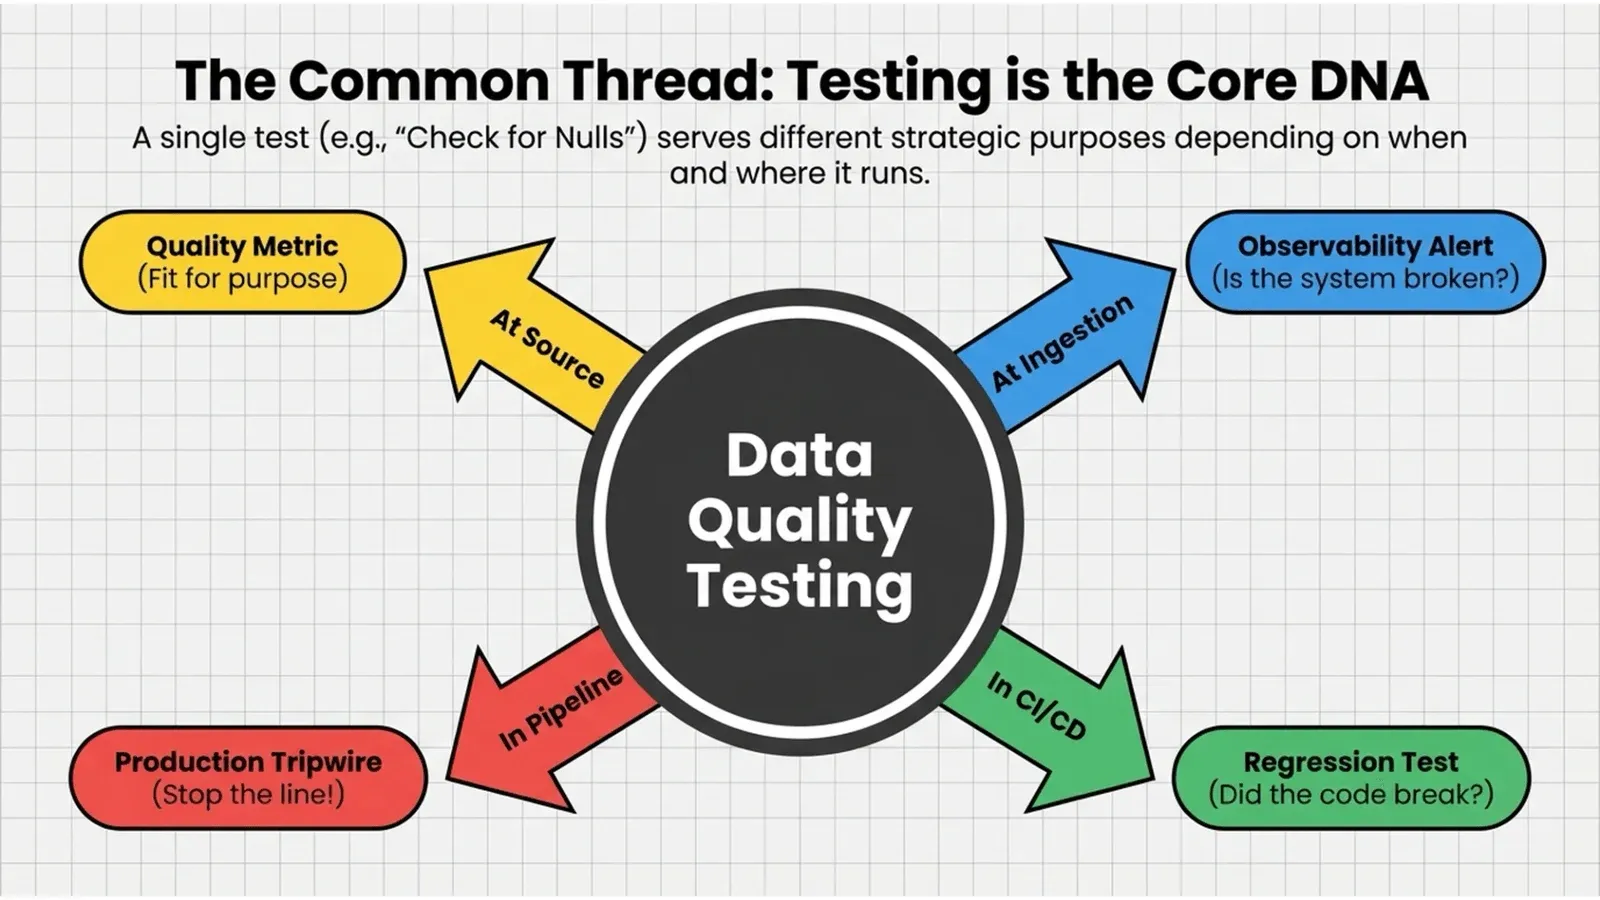
Run it on source data, and it’s a quality metric. This column shouldn’t be null, and the fact that it is tells you the source isn’t fit for purpose. Run it at ingestion, and any column that was full yesterday and is half-null today is an anomaly. Something changed, and you want to know before your customer does. Run it in production, and a null in your gold fact table after you joined three datasets is a reason to stop the line before that table reaches anyone. Run it during development, and a column that’s suddenly null after a code change means you broke something, and you should know before you deploy.
Same test. Four purposes. Four places. If you only run it in one of them, you’re covered for one failure mode and blind to the other three. That’s the whole point of the four points.
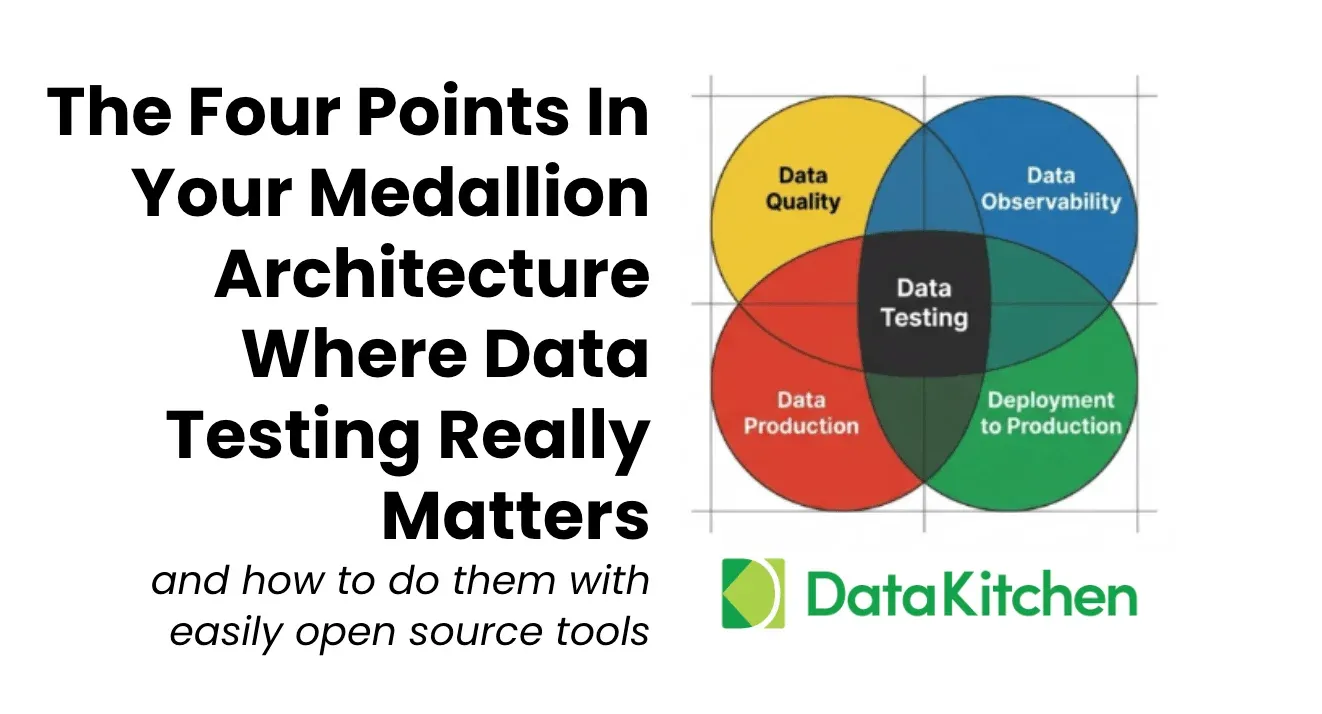
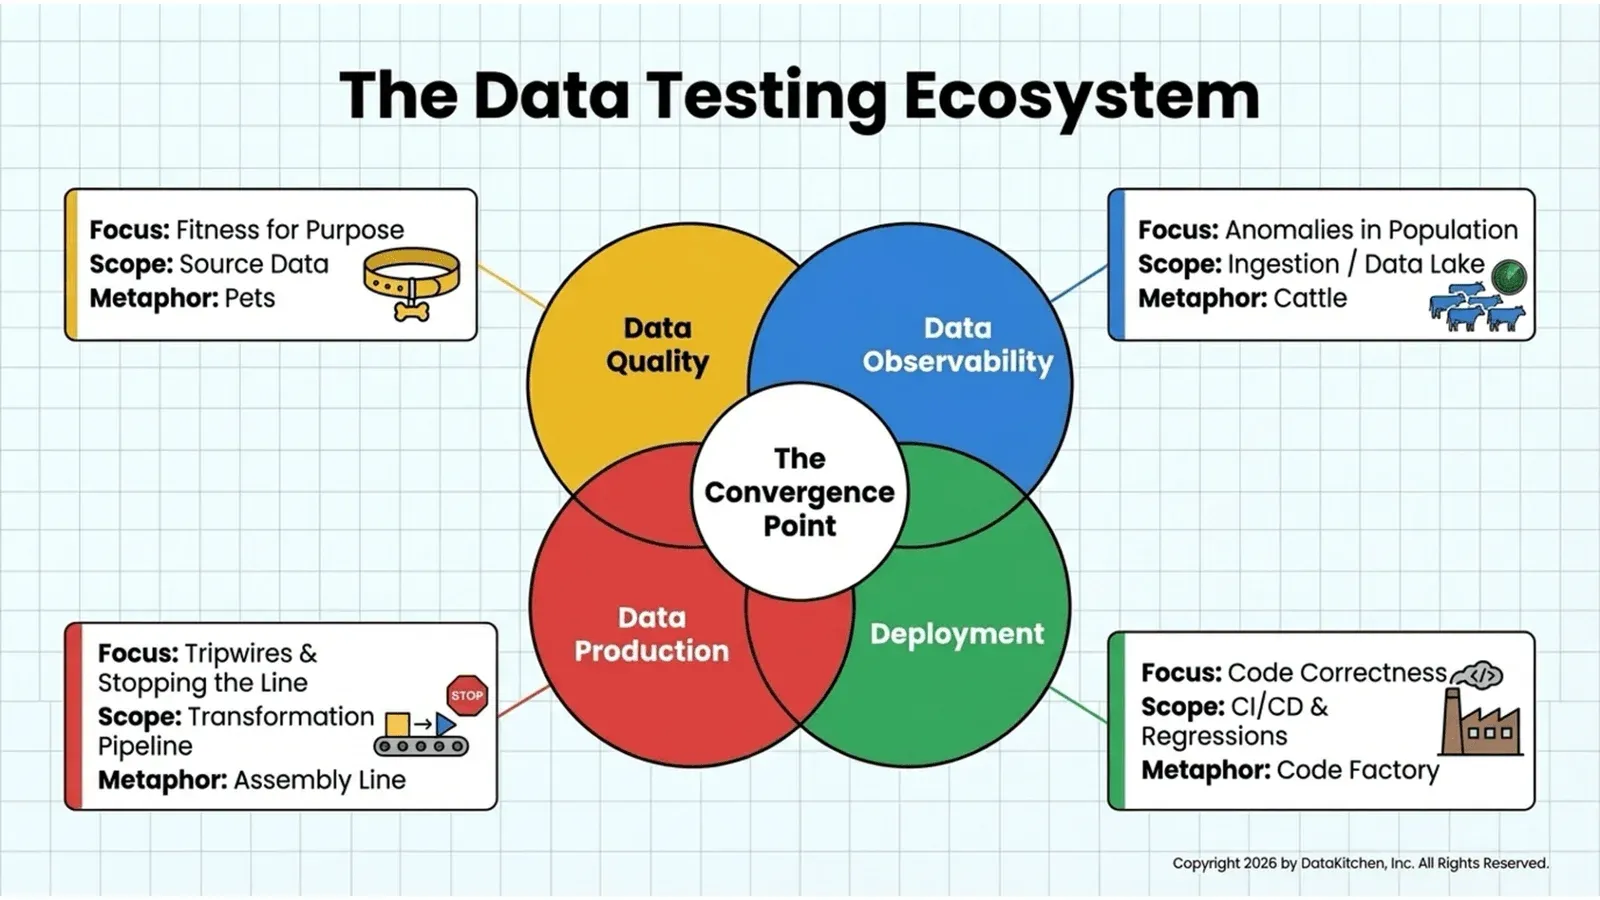
So let me lay them out in the architecture. On the left, you have source data quality testing, where you check data in the source systems or in their reflection in bronze. At ingestion, you have data observability, where you watch whether data arrived on time and looks normal. Through the transformation steps, you have data production testing, where you check the data as it moves through bronze, silver, and gold, and stop on errors. And underneath the whole stack, you have development testing, where you run today’s code against test data to catch regressions before they ship.
I like alliteration, so the four actions are persuading at the source, polling for problems, protecting production with tripwires, and protecting the production push. Pets, cattle, the assembly line, and the code factory. Let’s go through all four.
Point one: data quality. The pets
Source data quality is the pets problem.
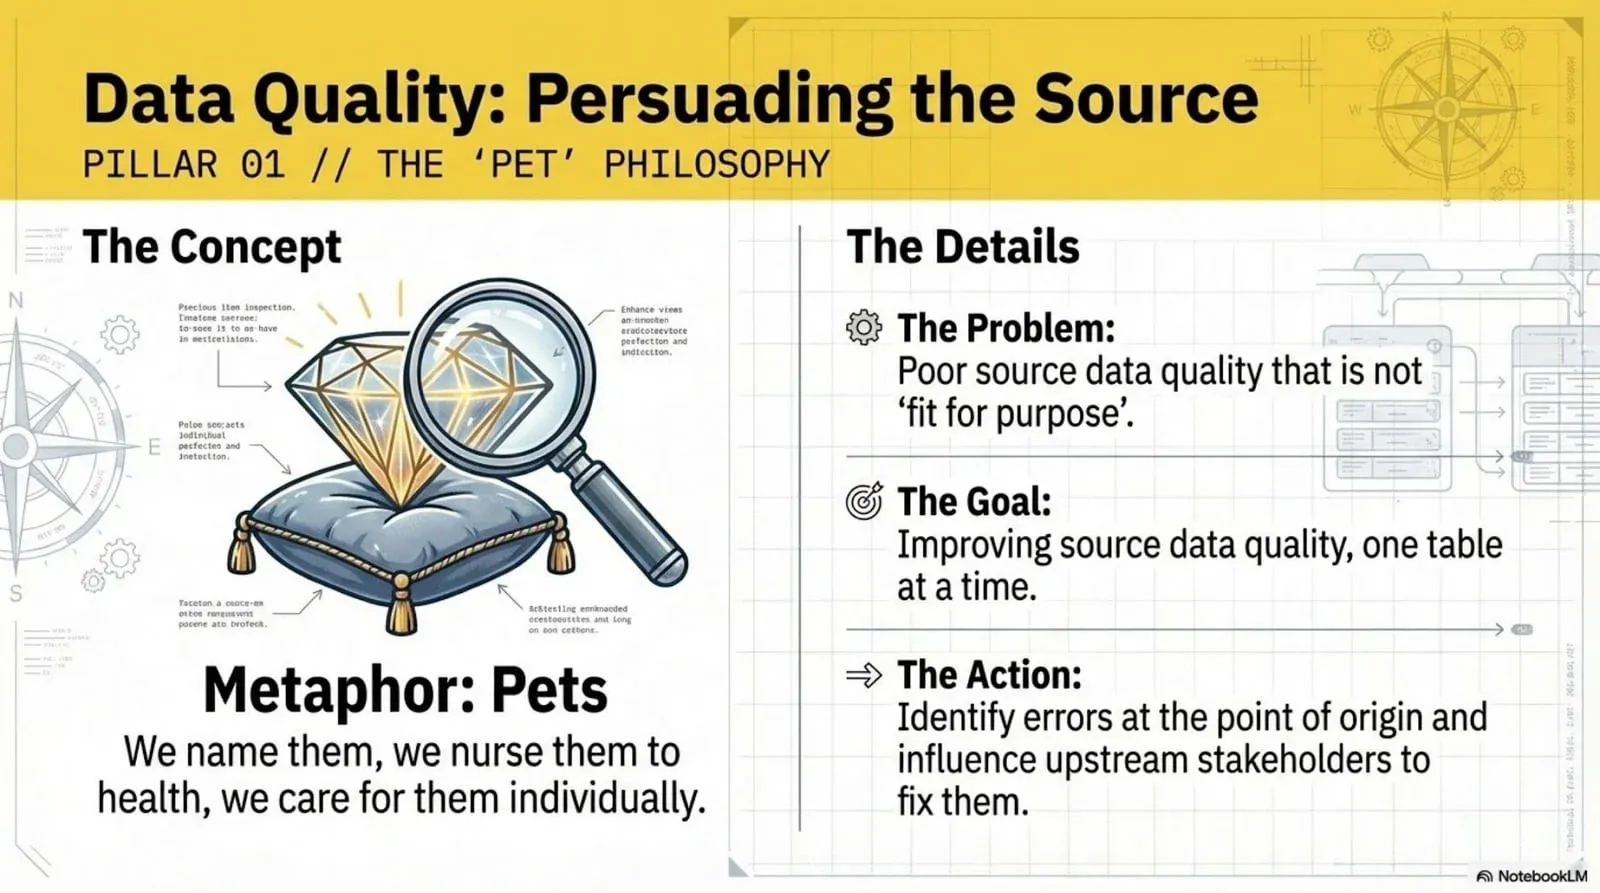
In DevOps, there’s a metaphor for pets and cattle. A pet is the server you set up by hand, the one where you have to remember which buttons you clicked, the one you nurse back to health when it’s sick. Cattle are the herd you manage by the numbers and never name. Source data is pets. You’re trying to make specific tables fit for purpose, one table and one column at a time, and you can’t automate your way out of it because you usually don’t own the source.
That’s the hard part. The data you need to fix lives in someone else’s system. You can’t change it. You can only prove it’s wrong and persuade the owner to fix it. So data quality is an influence game. You work small. You pick a specific set of fields that matter instead of boiling the ocean, score them, and use the score to get someone to act.
The way you win that influence game is with data quality dashboards, not one generic dashboard. Different stakeholders need different views. Some dashboards focus on critical data elements. Some tie quality to a business goal. Some are organized by data source so you can hold a specific supplier accountable. Some are built for a single data consumer, like the eight fields a data scientist actually cares about. One size doesn’t fit all here, and a multi-dashboard strategy is what gets you real coverage.
But a dashboard is worthless on its own, and this is the rule that matters most. Every dashboard score must be traceable to a data test. We call it the DQ test equivalence principle. A score without a clear “fix this” path is just noise. Every dashboard score breaks down into a set of data-quality workflow tickets, and each ticket must be backed by a test that both demonstrates the problem and verifies the fix. Test results roll up into the score. The score points back to the ticket. The ticket points back to the test. We’ve watched teams drop the dashboard entirely and just work the test results and tickets, and that’s fine. What doesn’t work is an abstract quality score floating free of any test that says exactly what to do.
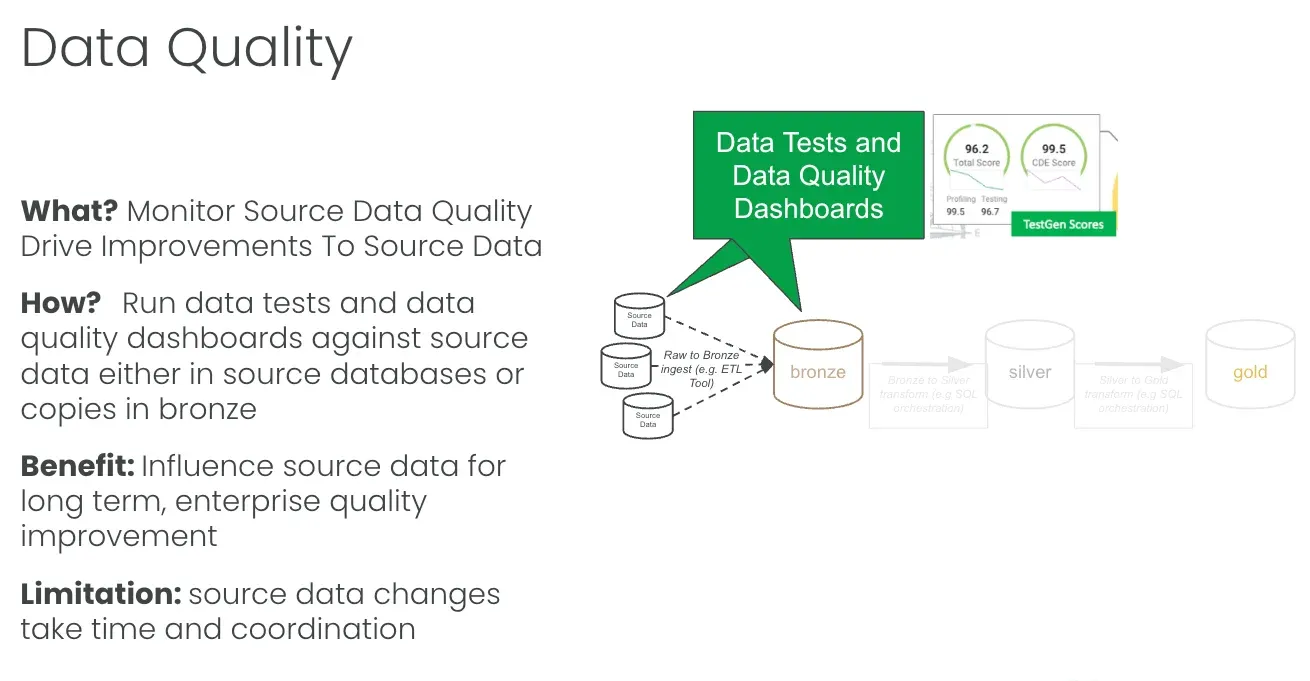
The limitation is real. Source quality testing tells you nothing about silver, gold, or anything downstream. Your sources can be perfect, and your reports can still be wrong, because the transformation broke or the data never showed up. The benefit is that it’s simple. You’re just connecting to data, either in the source databases or in their bronze copies, and checking it. One connection, no orchestration required.
Point two: data observability. The cattle
Now stop thinking about individual tables and start thinking about the herd.
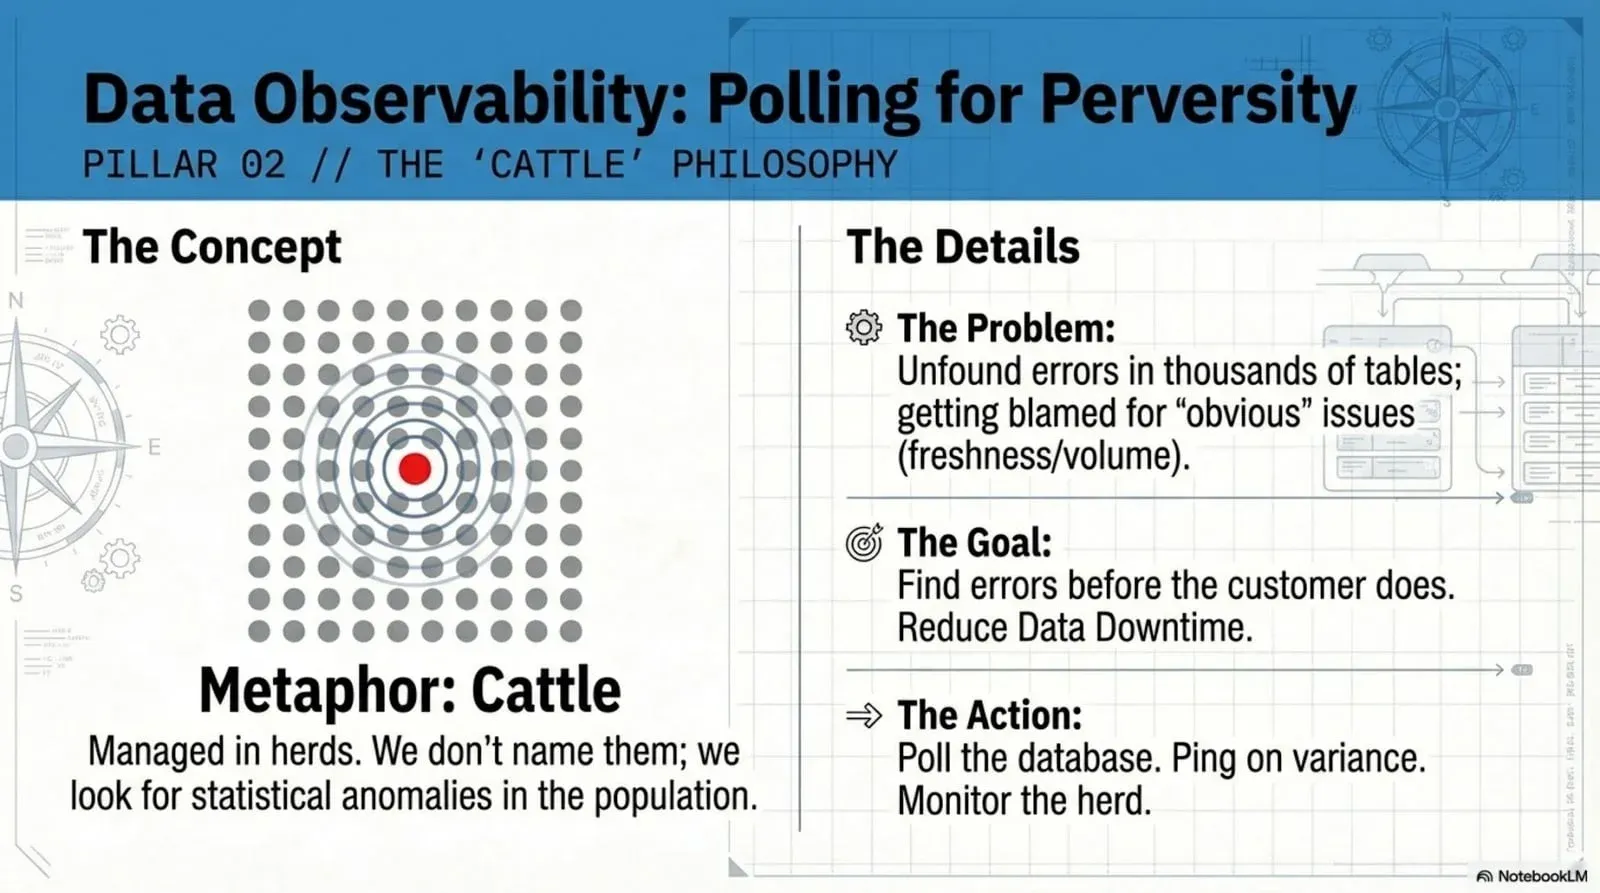
When source data lands in bronze, somebody owns that landing zone, and it’s not six tables. It’s 600 or 6,000. That person doesn’t have time to lovingly improve each one. They have a transportation problem. Data moves from the source into bronze through Informatica, or Fivetran, or a pile of custom scripts, and what they need to know is whether it arrived, whether it’s all there, and whether anything looks off. They’re scanning a herd of a thousand cattle for the one with the lame leg, or the one that isn’t there anymore.
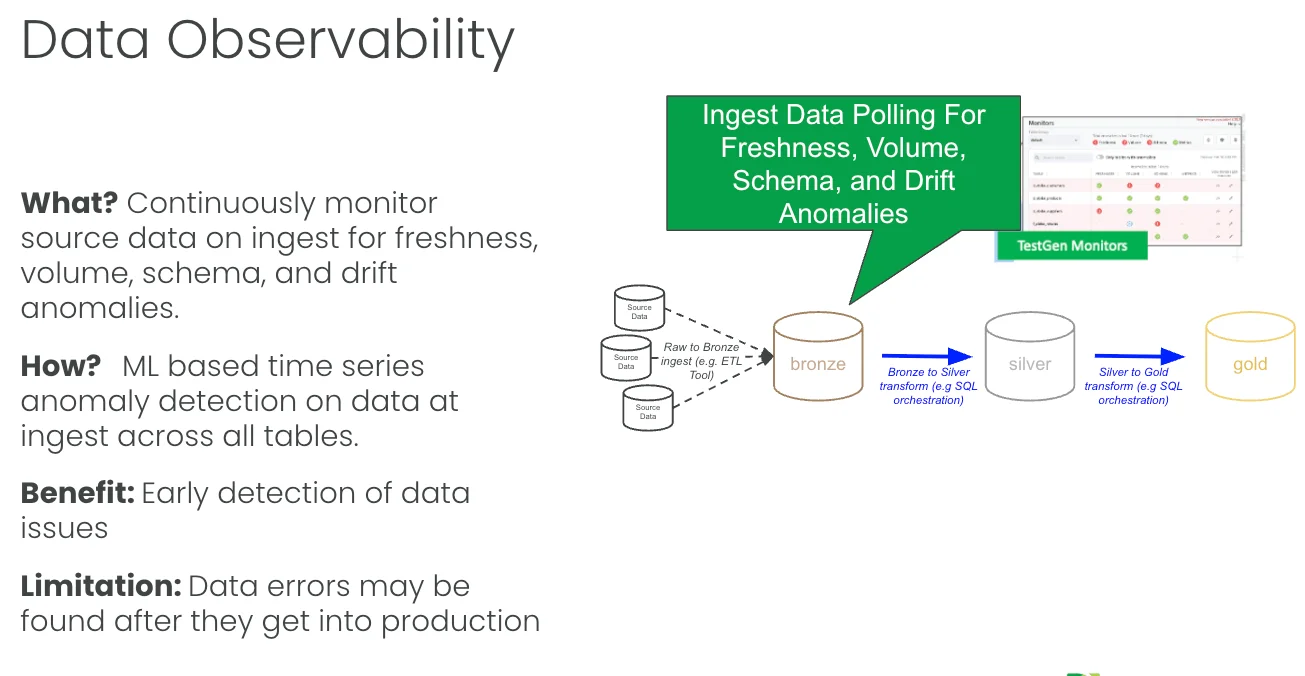
That’s observability, and it’s polling for problems. You continuously monitor the bronze tables and ping someone when a value drifts. The mechanism is time series anomaly detection. You learn each table’s normal behavior over time and flag the runs that don’t fit. There are four monitor types worth running.
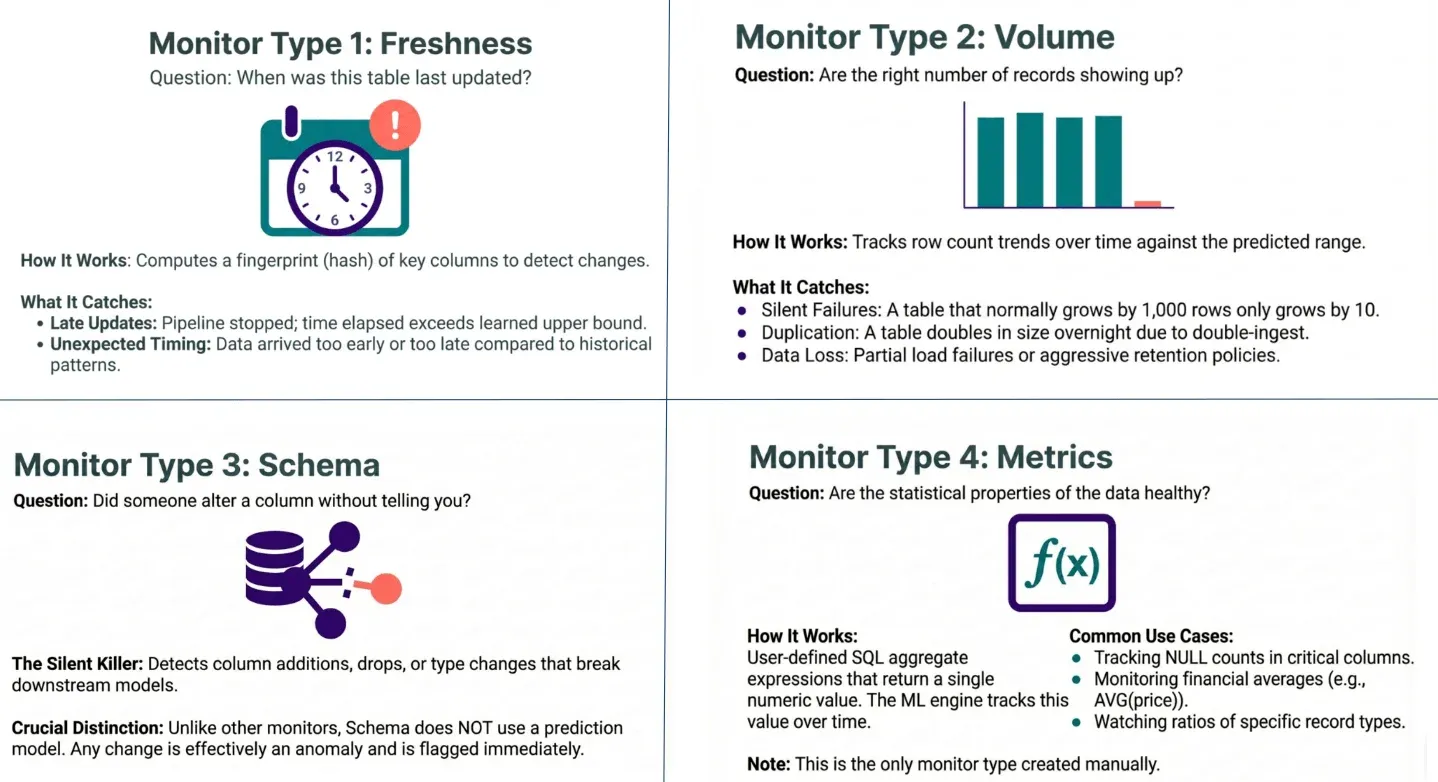
Freshness asks when the table was last updated. It learns each table’s update cadence and flags late or oddly timed loads. If a table updates every Tuesday and it’s Wednesday with no data, something’s wrong. Volume asks whether the right number of records showed up. A table that normally grows by 1,000 rows and grows by 10 is a silent failure. A table that doubled overnight was double-ingested. Schema asks whether someone altered a column without telling you. Schema is the silent killer, and it’s the one monitor that doesn’t use a prediction model, because any change at all is effectively an anomaly and gets flagged immediately. Metrics assess whether the statistical properties of the data remain healthy. You write an SQL aggregate that returns a single number, such as the average discount or the null count in a critical column, and the engine tracks it over time. Metrics is the one monitor type you build by hand.
The value is an early warning. Finding the problem when it arrives is far better than finding it three layers downstream in front of a customer. The limitation is that this is passive detection. Observability tells you the data is late, short, or reshaped, but it doesn’t stop anything. Errors still flow into production while you read the ping. You also get the occasional irrelevant ping, which is the price of anomaly detection. But in the land of the blind, running freshness, volume, schema, and metrics on every bronze table is so much better than hoping, and you can stand it up fast.
Point three: data production. The assembly line
Now we get into the actual production process, the part where data moves through bronze, silver, and gold with code transforming it at every step. This is the assembly line, and the metaphor carries its own rule: put a quality control station at every step, and stop the line when you find a defect.
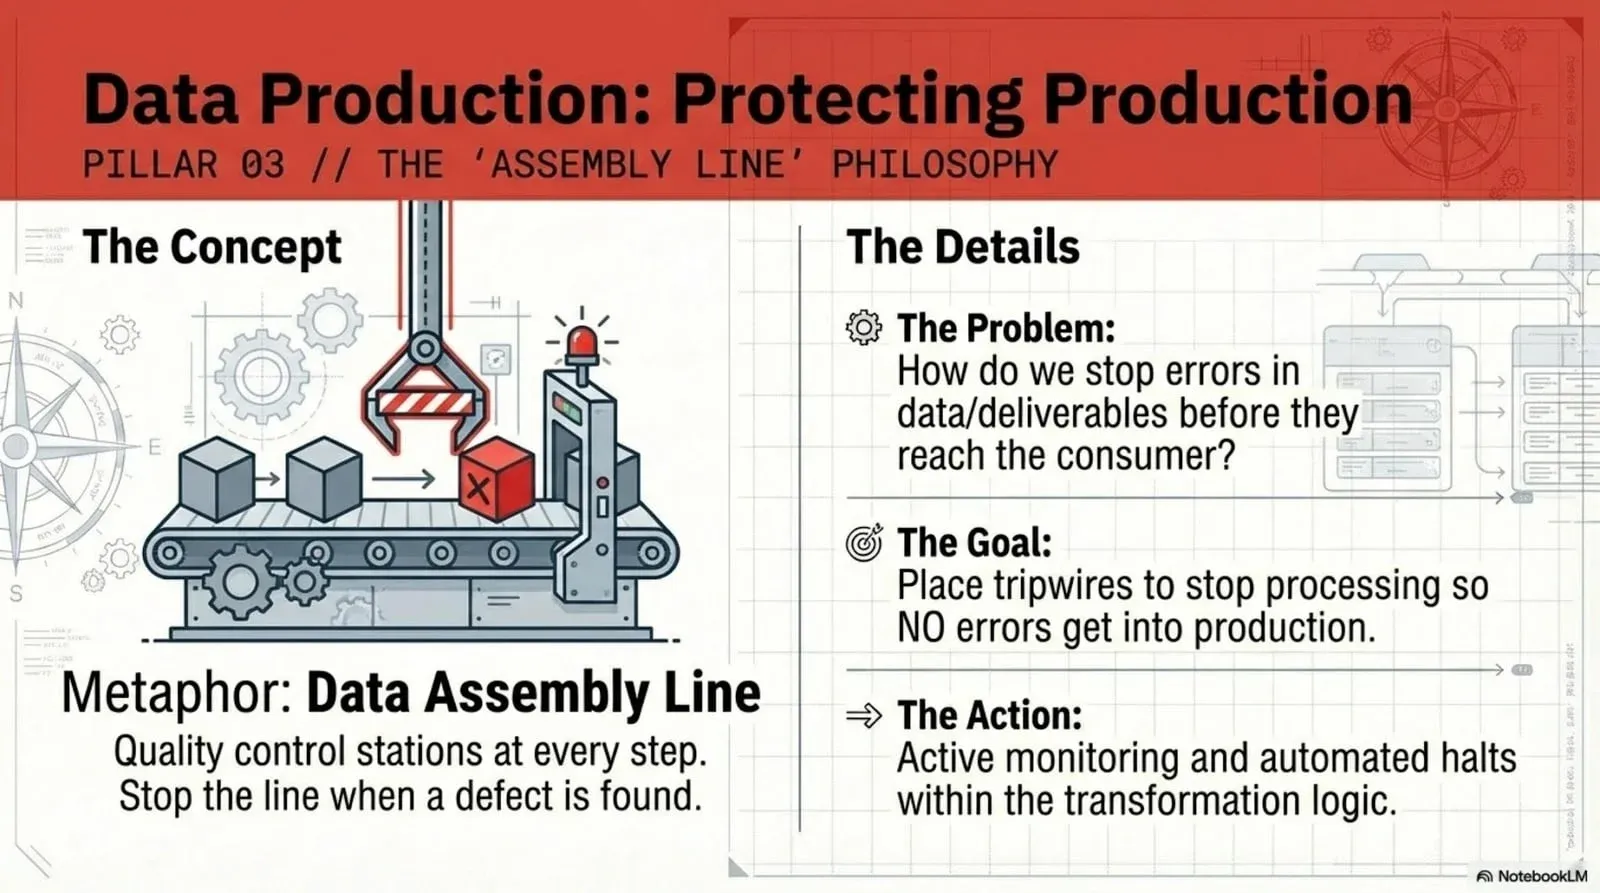
The goal is to prevent bad data from reaching the customer. The tool is the tripwire. A tripwire is a test embedded in your transformation logic that halts the pipeline on failure. Your orchestrator (Airflow, Dagster, dbt, run-through tasks, whatever you use) runs a series of steps on a schedule. You add test steps between them. In bronze-to-silver runs, you test silver, and if the tests fail, the line stops, and gold never gets the bad data.
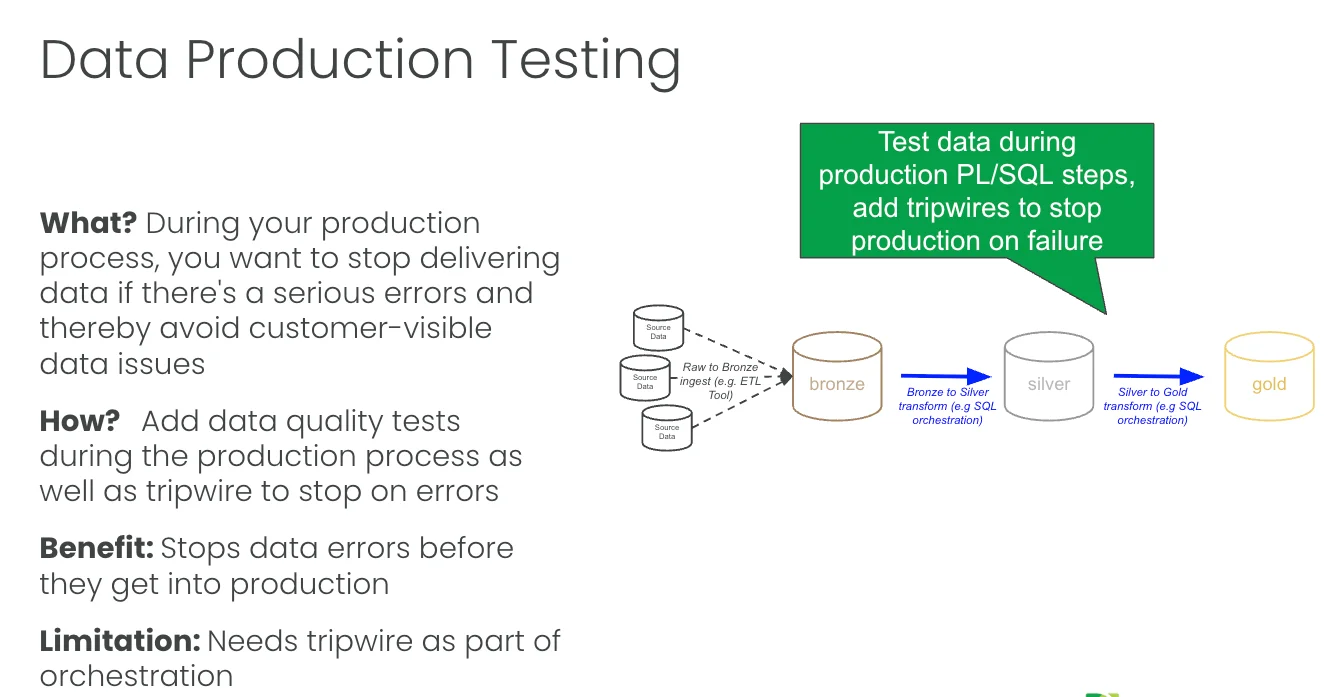
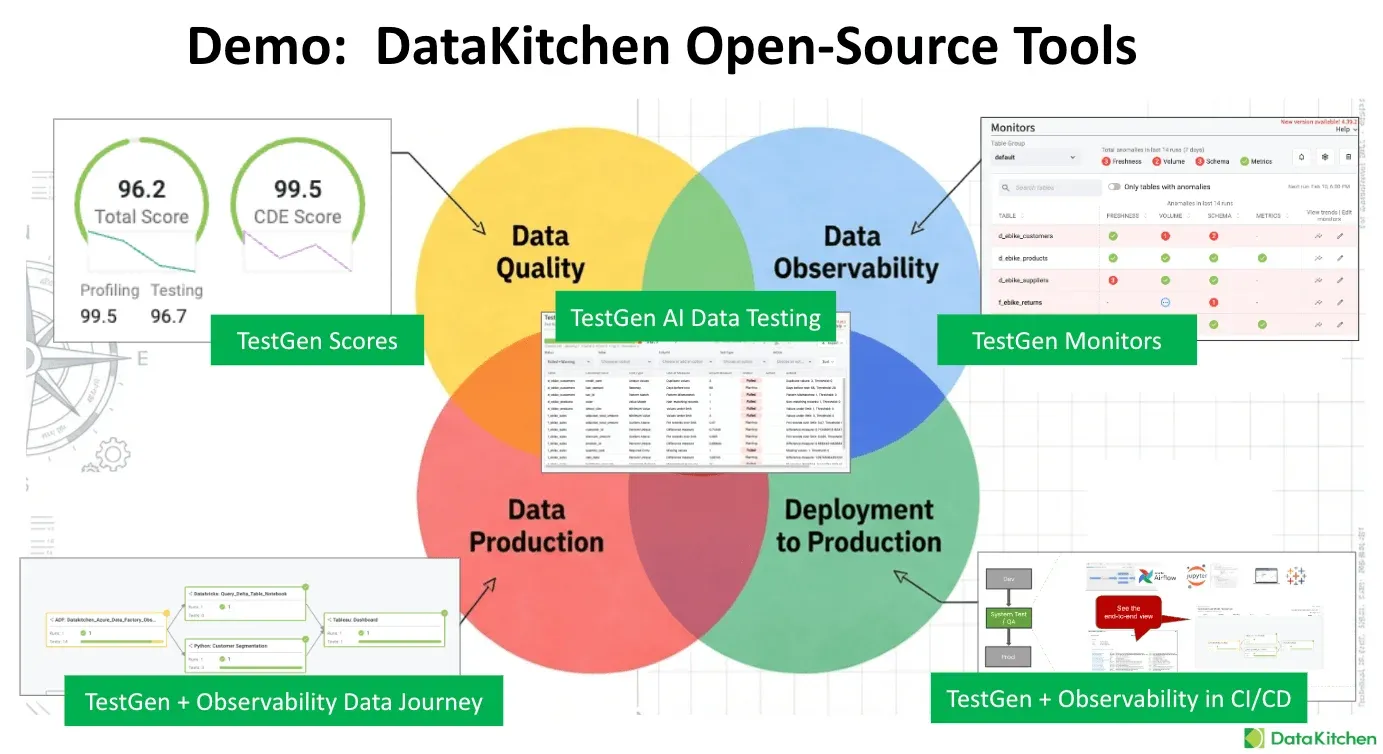
We built an example of this in Databricks. The pipeline ingests raw data into bronze through IICS. TestGen monitors the bronze database for issues, and then the bronze-to-silver and silver-to-gold transforms each have a TestGen tripwire task right after them. The transform is plain SQL run through tasks or dbt. The test step is a bit of Python that calls out to TestGen, runs the suite against the new data, and returns the results. If the silver suite fails, the job stops before silver-to-gold ever runs. When a suite passes, you see it in the run log: 41 of 41 tests passed in the silver suite, no failures or warnings, results written back to a Delta table. There’s a full walkthrough of this setup in Data production tripwires in Databricks: stop bad data before it reaches production.
The part people like is that the results don’t stay buried in a test tool. We push every TestGen result up into Unity Catalog, so when you open the customers table in the catalog, you see the test summary right there: 3 of 3 passed on customer_id, the test types that ran, the last run time, and a tag for how many tests failed. The catalog becomes the place your whole team already looks, and now the test status lives there too.
But data is only half of it. You also have tools acting on the data, and tools break in ways your data tests won’t catch. Your Airflow job hangs for three hours for no obvious reason. Your reporting tool’s scheduled refresh silently didn’t run. So the necessary and sufficient condition for no customer-visible errors is this: check the data and monitor the tools acting on it. Every tool should be checked for errors and for timing.
You have two ways to watch the tools. You can use a test-aware orchestrator with built-in monitoring, so the checks run as part of the tool itself. Or, when you have several orchestrators (one loads data, another runs the bronze ETL, another handles gold, and a script kicks off the Power BI refresh), you need something sitting above all of them. That’s what a data journey observability tool does. It watches every step across every tool and gives you one place to see the failure. I’m not a believer that data lineage solves this. Lineage is a blueprint, and what you need in production is a fire alarm control panel that says, “Here’s the problem, here’s where it stopped.” You consult the blueprint after the alarm goes off to diagnose. You don’t stare at a blueprint waiting for a fire.
The limitation is that this approach takes more work, because you have to integrate both the data and the tools into your orchestration. The benefit is the one that actually matters to your customer: you stop visible errors in data, reports, and AI models before anyone sees them.
Point four: deployment. The code factory
The first three points are about data. This one is about code.
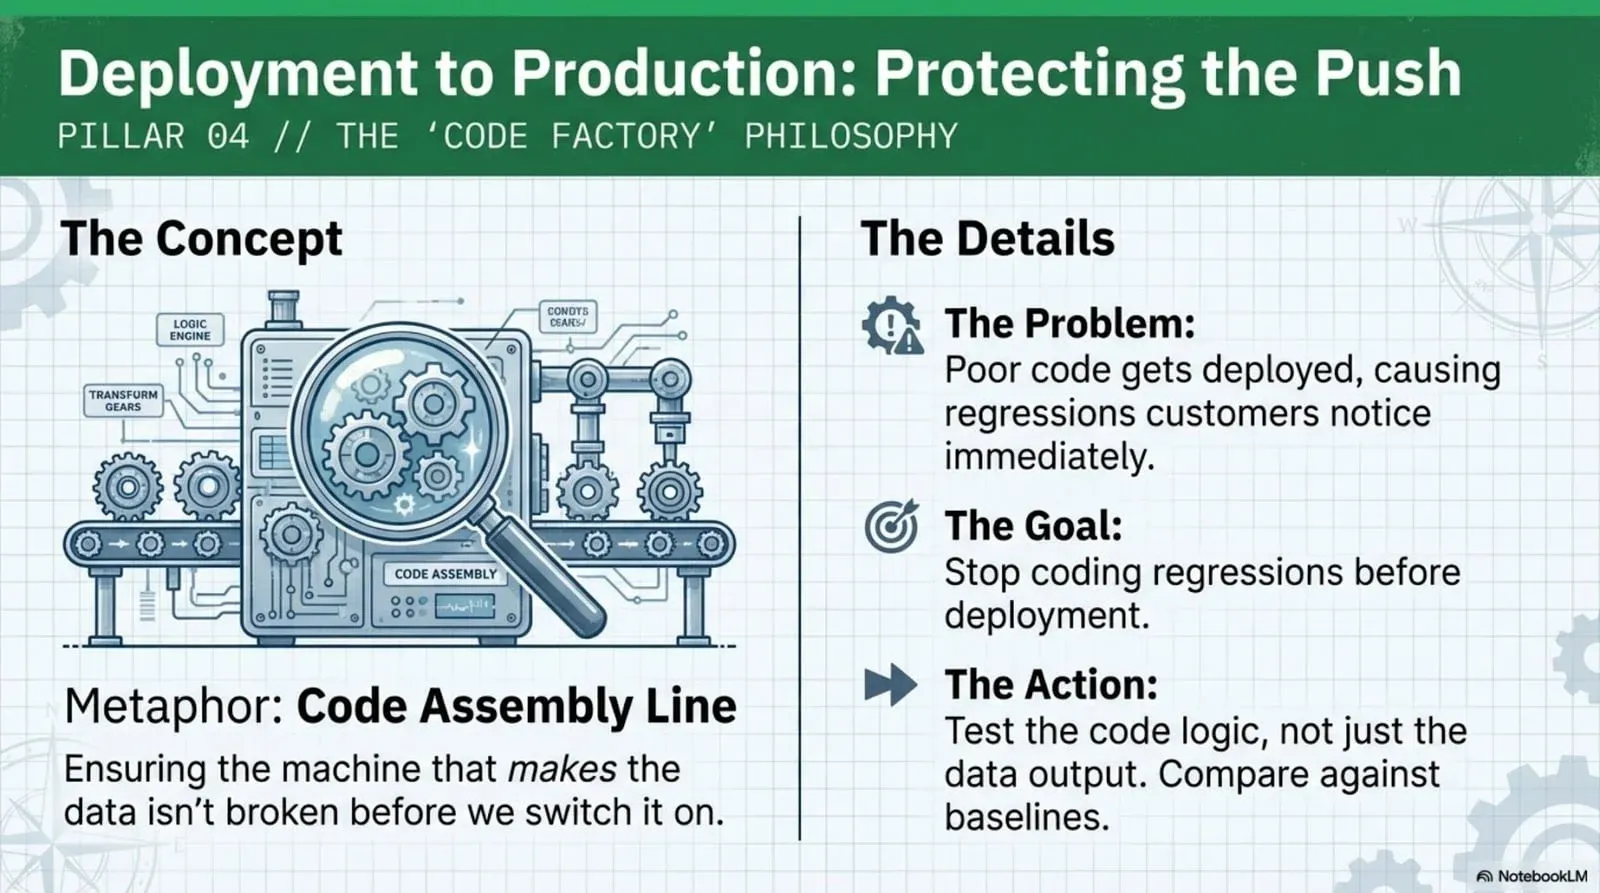
You have a second manufacturing line, and it isn’t making data; it’s making the transformations that produce the data. This is the code factory, and the job is to prove your code still works before it ships. Specifically, prove that the new code you wrote works and that it didn’t break the code that was already there. Regressions.
Most teams do almost nothing here. They hope it works. A good engineer might write a unit test. That does very little to prevent a regression, because the bug usually isn’t in a single function; it’s in what happens when the column you renamed flows three layers downstream.
Here’s the concrete failure mode. You rename a column in Silver to fix a misspelling. Simple change. But some process in gold knows that column name, so it breaks. And some reports read the gold column, so the report breaks. You won’t see any of that in a unit test. You’ll see it from your customer.
The fix is full regression testing across the entire Medallion in your dev and QA environments. You run the same bronze, silver, and gold pipeline you run in production, but with test data pulled from production instead of live data. Maybe a filtered slice, maybe a zero-copy clone. Your data tests pull double duty here. The same tests that check data quality in production now verify that your code change didn’t move the numbers in an unintended way. Think of it as today’s code against yesterday’s data, where production is yesterday’s code against today’s data.
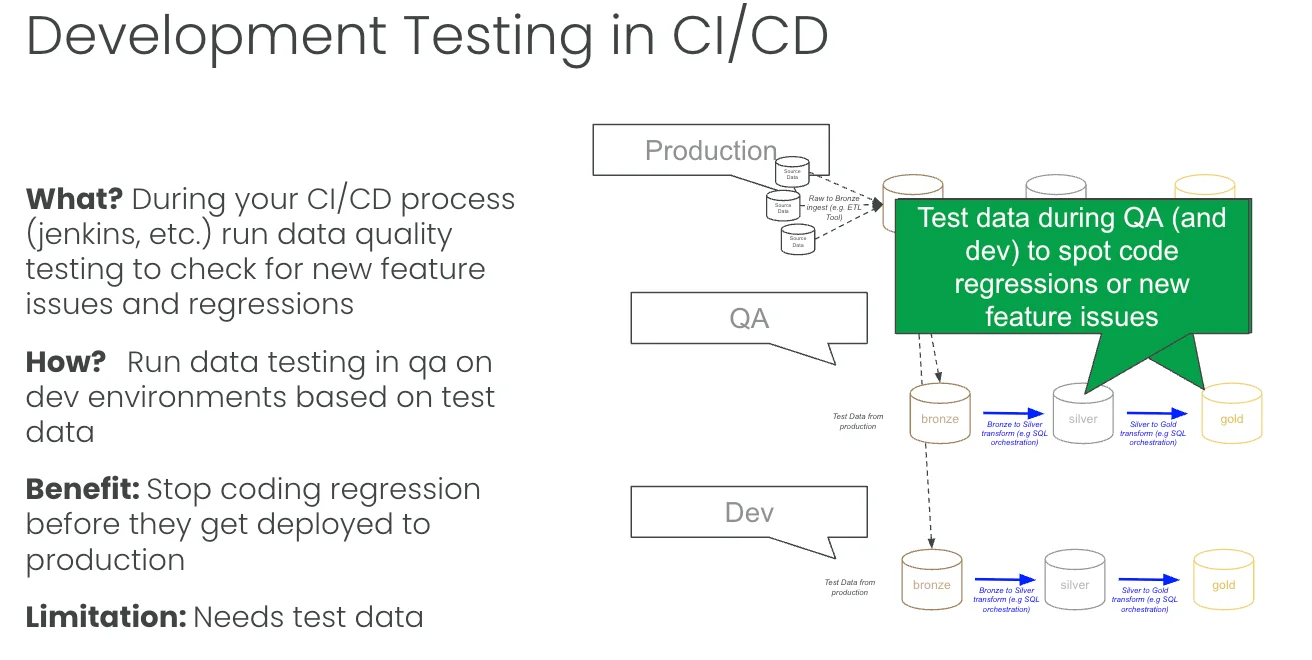
This is the highest-impact and highest-complexity point. The payoff is speed. Good regression coverage lets you ship smaller changes more often with less risk, and that matters more as your team grows. One person keeping the whole pipeline in their head can wing it. Three people can’t, and AI agents writing transformations definitely can’t. The marker of a high-performing data engineering team is that you can hand a 22-year-old the keys, let them rename a column, and have a big red light go off that says “you broke a downstream report” before it ever reaches prod. That red light is regression testing.
You need a few things to get there. Good test data. A development environment that looks like production from a DevOps standpoint. A real CI/CD process that moves code from one environment to the next. And regression tests across every layer of the Medallion. Unit tests and manual business reviews won’t cut it, and you will get screwed if you rely on them. The reason to do the work is the 1:10:100 rule: catching a bug here costs about 1/100 of what it costs in production, where you’re rebuilding the system and apologizing to people.
How much testing is enough?
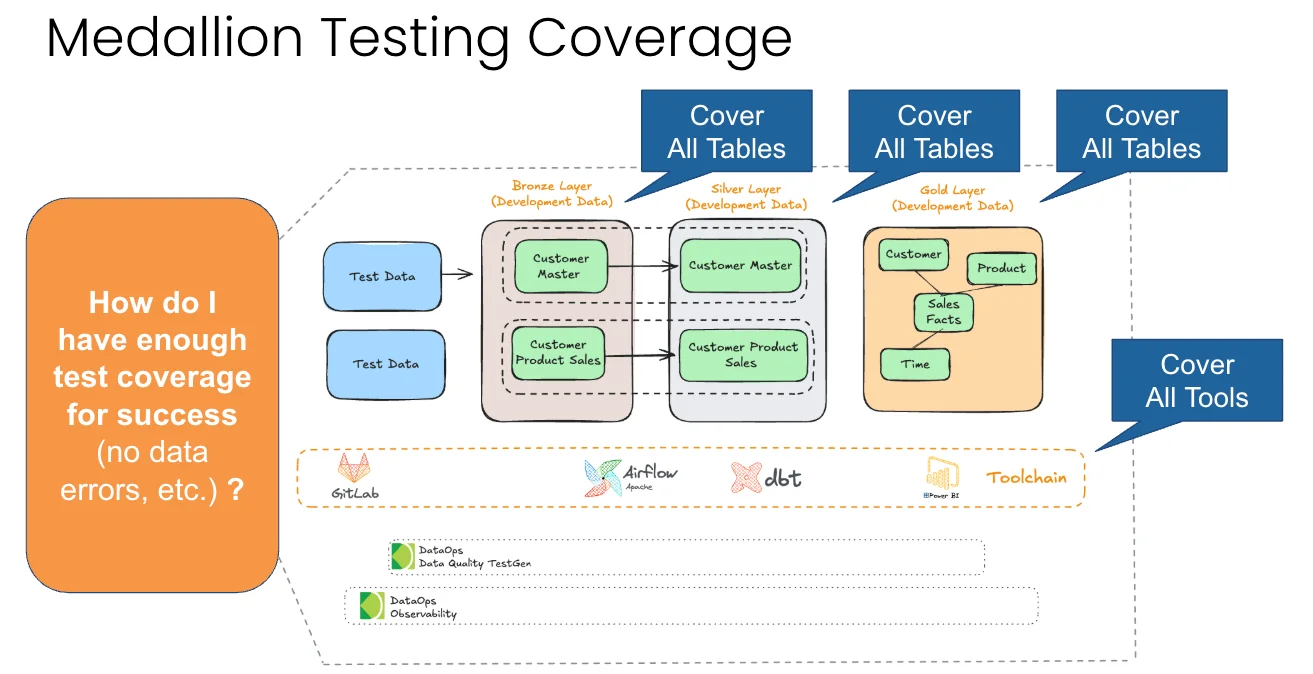
Partial coverage is better than nothing, but it keeps the problems coming. If you test one table out of a hundred, you’ve covered one table, and you’re still praying about the other ninety-nine. There are gaps in depth versus breadth, prevention versus detection, and runtime versus dev time, and you can’t close them by testing your three favorite tables.
So the standard is simple and common sense. Cover all the tables in bronze, silver, and gold. Cover all the tools. Concretely, every table should have tests (two to three per table, covering freshness, volume, and schema at a minimum). Every column in every table should have tests (at least two per column). Every significant business metric, such as how your customer sees sales by region or production volume, should have at least one custom test. And every tool that touches data should be checked for errors and for timing: at least one check per tool for errors in the logs, one check per job for task status, and one check per job for timing and duration.
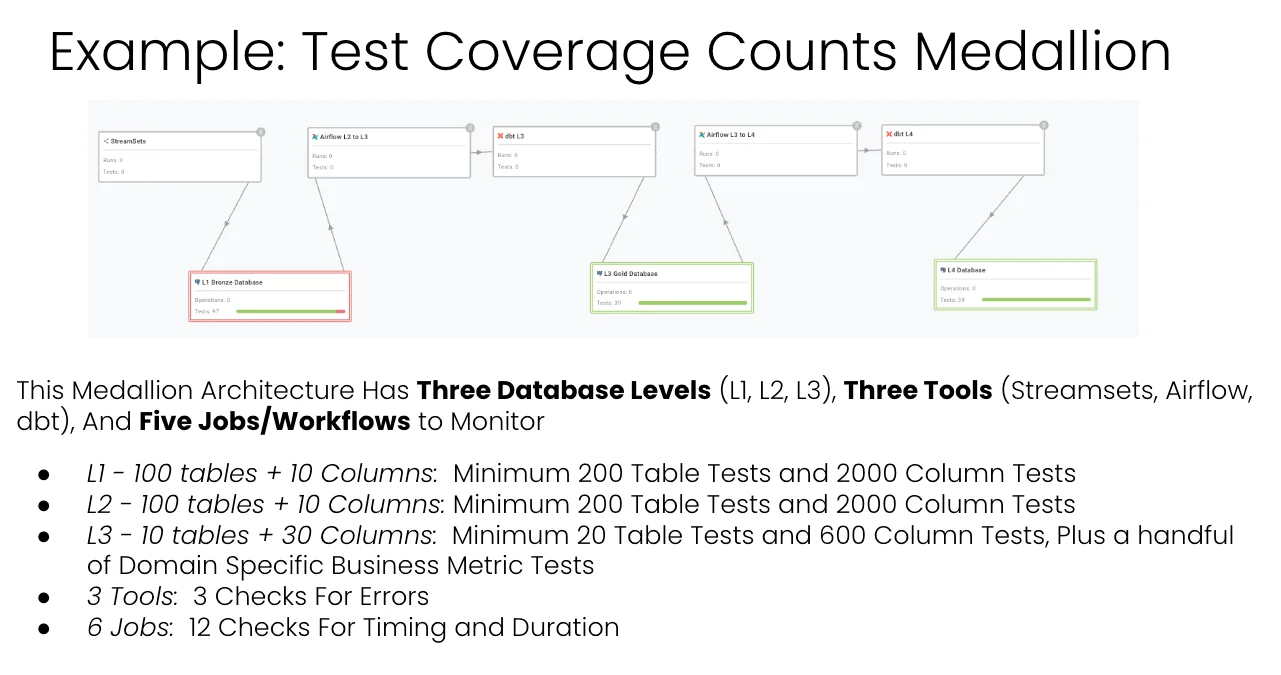
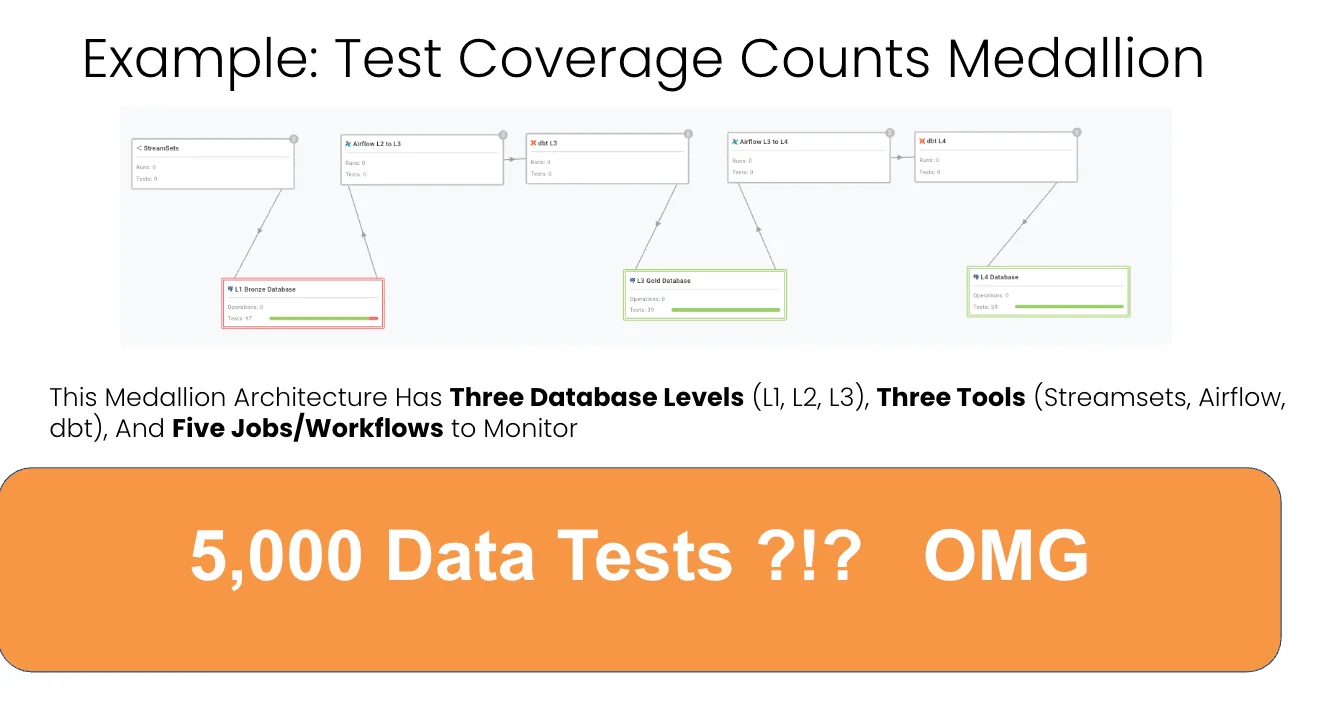
Now do the math on a real Medallion. Say you have three database levels, three tools (StreamSets, Airflow, dbt), and five or six jobs. L1 has 100 tables averaging 10 columns, so that’s 200 table tests and 2,000 column tests. L2 is the same, another 200 and 2,000. L3 has fewer tables but more columns, call it 20 table tests and 600 column tests, plus a handful of business metric tests. Three tools mean three error checks. Six jobs mean twelve timing checks.
Add it up, and you’re looking at roughly 5,000 data tests. OMG, basically. That number is exactly why people give up and go back to praying.
The cost of doing it the slow way
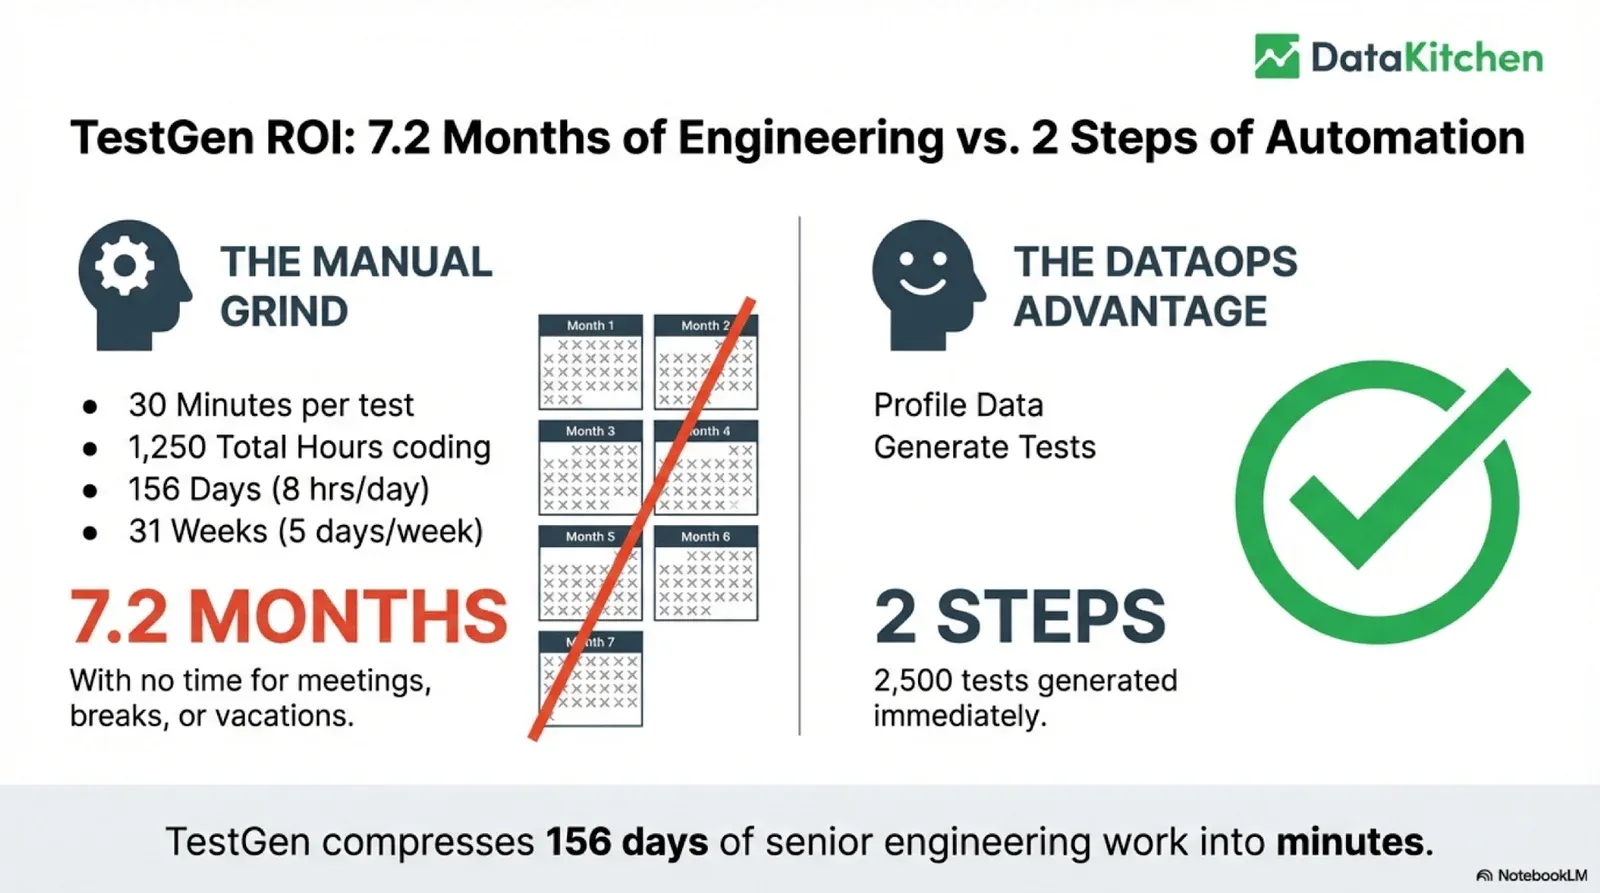
Those tests are a lot of typing. Take just half that load, 2,500 tests. At 30 minutes per test, that’s 1,250 hours of coding, 156 working days, 7.2 months of a senior engineer doing nothing but writing tests, with no time for meetings, breaks, or vacations. That’s the manual grind, and it’s why “I don’t have time” was the most common answer in our survey.
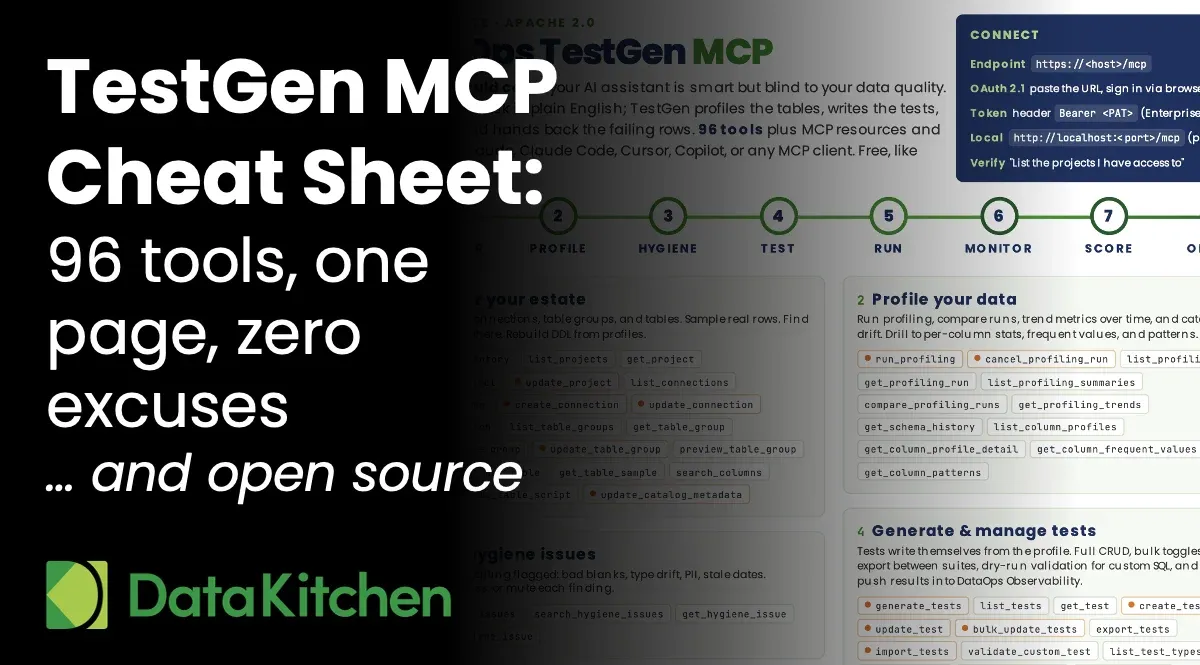
We built our open-source DataOps TestGen to solve exactly this. You profile the data, you generate the tests, and you’re done. TestGen writes about 80 percent of the tests you need automatically and gives you a UI to handle the rest, plus 100 percent of the monitors. So 156 days of grinding compress into minutes. Not 100 percent, but 80 percent of 5,000 tests generated immediately is the difference between a quarter of dead-end work and an afternoon.
The other cost is the vendor tax. We studied how data observability and data quality vendors price, and most of them charge by usage: per credit, per table, per row scanned. The more tables you monitor and the more tests you run, the more you pay. The more you test, the more it costs. That’s backward. You should be testing your source data, testing in production, and testing in development, all the time, everywhere, because every error you prevent buys back hours. Punishing the right behavior with a bigger bill makes no sense. Yet market prices for this run from $50k to well over $1M a year, and teams end up rationing quality, picking favorite tables to monitor, and praying the rest hold.
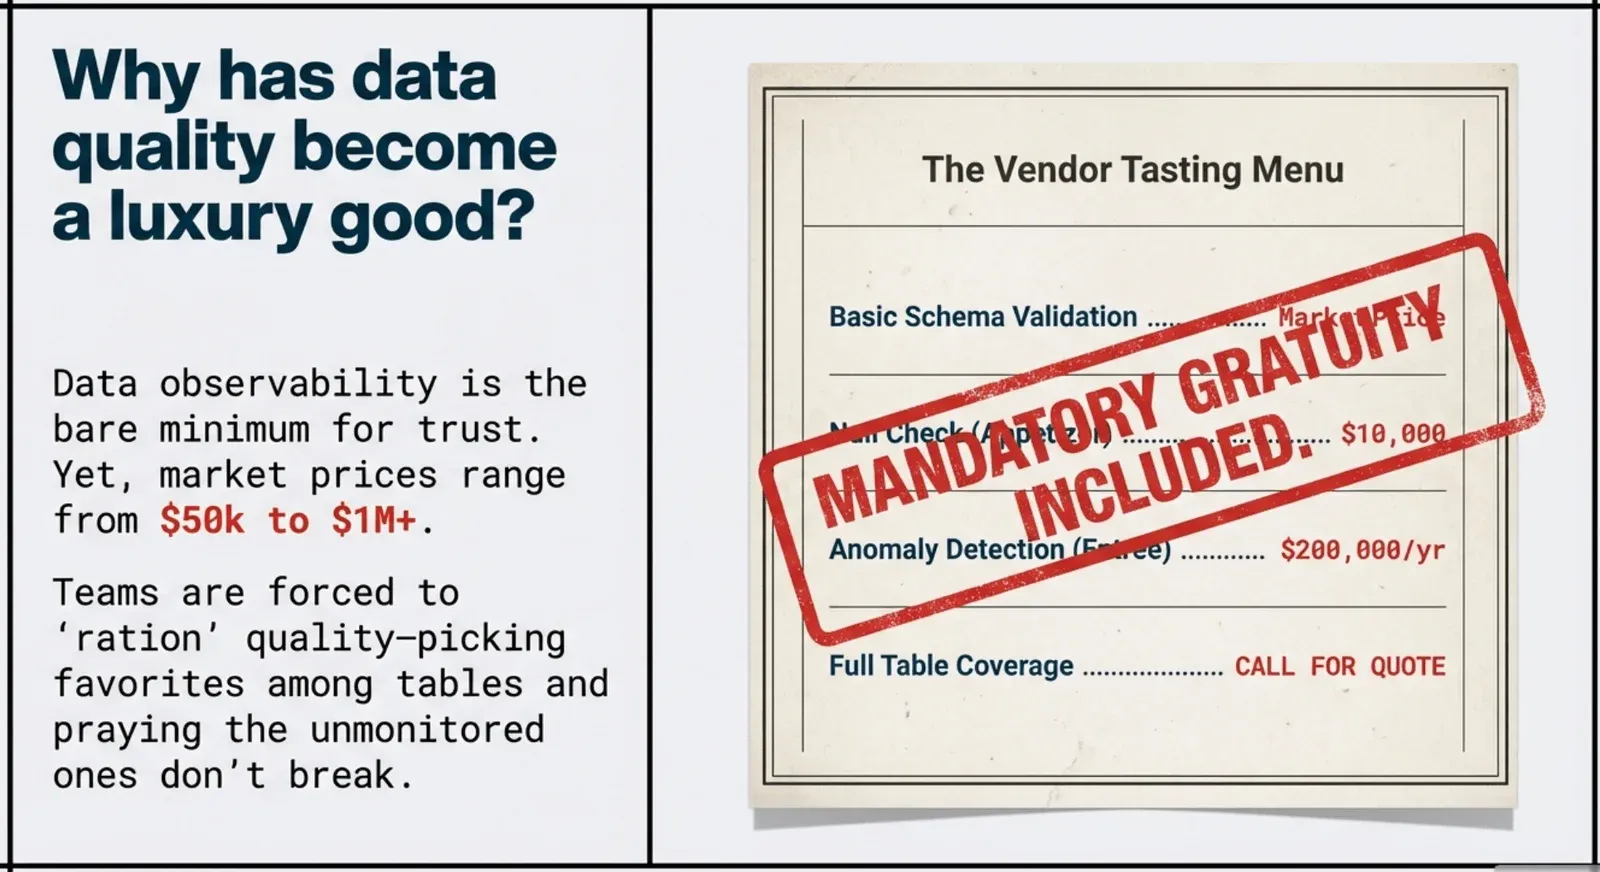
We don’t think data quality should be a luxury good. TestGen open source is under the Apache 2.0 license and is free forever, with one limit: one user and one database connection. Unlimited tables, unlimited volume, every feature. Enterprise pricing is flat: $100 per user per month and $100 per database connection per month, still with unlimited tables, volume, and tests. A small team of half a dozen engineers with a couple of databases costs about a month of one engineer’s salary per year. You pay for people and connections, never for how much you test.
Where to start
Don’t try to build all four points on day one. Start at bronze and forget everything else.
All you need is a read-only connection to your bronze database. Turn on observability monitoring: arrival frequency, volume, schema, and a couple of metrics. That’s it. This takes about an hour, costs nothing, and monitors as many tables as you have, whether that’s a hundred or a few thousand. You go from blind to watching the whole herd in an afternoon.
Second, build a data quality dashboard. Same single connection, no cost, and you get a score you can actually act on. Those two moves, monitoring on bronze and one quality dashboard, are the highest return starting point I know.
This works regardless of your stack. If you’re AWS native and your “Medallion” is S3 buckets moving through Lambdas into Postgres, the principle doesn’t change. You still need automated checks that can stop bad data, and you have options: write tests as step functions that fire after data lands, point a query engine like Redshift Spectrum at the buckets, or, in the simplest case, write your errors to a table or a bucket and read it once an hour. The pattern of S3 to S3 is everywhere, and the rule is the same. Take hope out of the system and put a check in its place.
The reason all of this is worth it comes back to the 1:10:100 rule. Prevention costs a dollar, remediation costs ten, and a failure in front of your customer costs a hundred. Every test you write is a gift to your future self. Shift left to catch problems in development, shift down to catch them earlier in production, cover every table, cover every tool. Do that, and you end up running pipelines with almost no errors, which frees you from the burden and the embarrassment that eats most of a data engineer’s week.
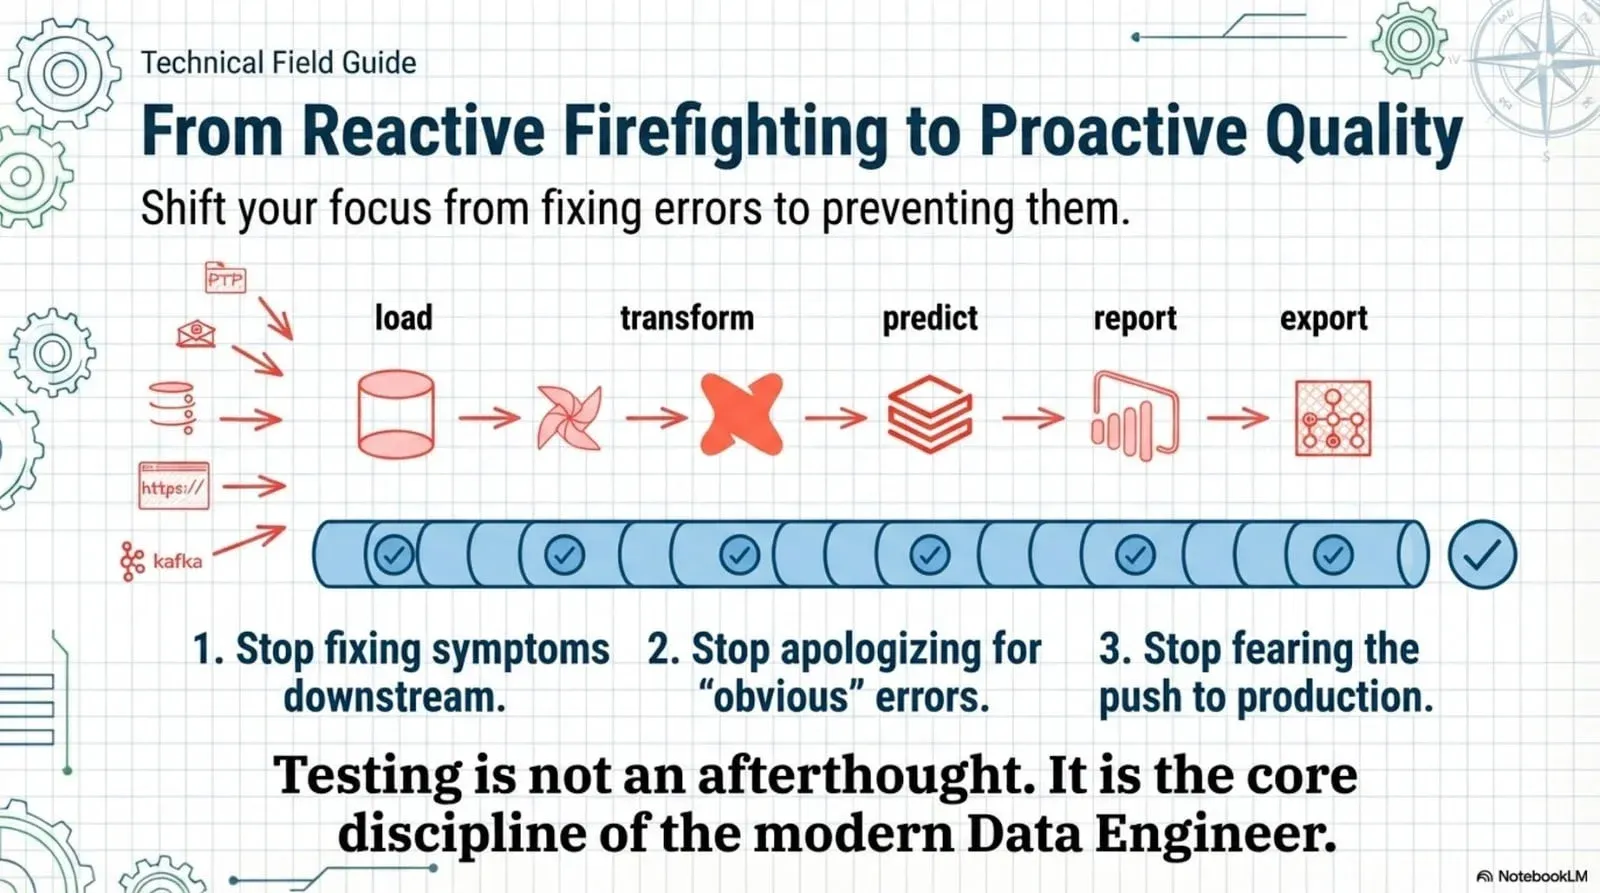
Stop being reactive
Testing is not an afterthought you bolt on after the dashboard is already wrong. It’s the core discipline of the modern data engineer working in a Medallion architecture. Stop fixing symptoms downstream. Stop apologizing for “obvious” errors. Stop fearing the push to production. Stop being an ostrich with data issues.
There are four places to test, and you need all four. Persuade at the source so your data is fit for purpose. Poll at ingestion so you catch what arrives broken. Put tripwires through production so nothing bad reaches gold. Run regression tests in CI/CD so your code changes don’t break what already works. The tools exist, the tests can write themselves, and you can stand up the first point in an hour. Point it at your bronze database today and start watching everything.
TIP
DataOps TestGen is Apache 2.0, free for individuals, and Docker and Kubernetes-ready. Install the open source, read the setup guides at docs.datakitchen.io, and when your team is ready for support and proprietary database connections, the Enterprise version runs $100 per user per month.